Publisher’s version / Version de l'éditeur: Technical Report, 2013-09-01
READ THESE TERMS AND CONDITIONS CAREFULLY BEFORE USING THIS WEBSITE.
https://nrc-publications.canada.ca/eng/copyright
Vous avez des questions? Nous pouvons vous aider. Pour communiquer directement avec un auteur, consultez la première page de la revue dans laquelle son article a été publié afin de trouver ses coordonnées. Si vous n’arrivez pas à les repérer, communiquez avec nous à PublicationsArchive-ArchivesPublications@nrc-cnrc.gc.ca.
Questions? Contact the NRC Publications Archive team at
PublicationsArchive-ArchivesPublications@nrc-cnrc.gc.ca. If you wish to email the authors directly, please see the first page of the publication for their contact information.
Archives des publications du CNRC
For the publisher’s version, please access the DOI link below./ Pour consulter la version de l’éditeur, utilisez le lien DOI ci-dessous.
https://doi.org/10.4224/21270993
Access and use of this website and the material on it are subject to the Terms and Conditions set forth at
Evaluating exposure time until recovery by location
Kennedy, Allison; Gallagher, Jack; Aylward, Katie
https://publications-cnrc.canada.ca/fra/droits
L’accès à ce site Web et l’utilisation de son contenu sont assujettis aux conditions présentées dans le site LISEZ CES CONDITIONS ATTENTIVEMENT AVANT D’UTILISER CE SITE WEB.
NRC Publications Record / Notice d'Archives des publications de CNRC: https://nrc-publications.canada.ca/eng/view/object/?id=8287b632-f625-4645-89cc-dc4c29bffd72 https://publications-cnrc.canada.ca/fra/voir/objet/?id=8287b632-f625-4645-89cc-dc4c29bffd72
Page 1 of 98
NATIONAL RESEARCH COUNCIL CANADA OCEAN, COASTAL AND RIVER ENGINEERING
Evaluating Exposure Time until Recovery by
Location
Technical Report - UNCLASSIFIED
OCRE-TR-2013-036
September, 2013
Allison Kennedy, National Research Council
Jack Gallagher, Hammurabi Consulting
Katie Aylward, National Research Council
Project Number: IA 1 - 0 0 3 4 8 2
Program
I
S e c u r it y C la s s if ic a t io nI
D is t r ib u t io nM a r in e S a fe ty U N C L A S S IF IE D U N L IM IT E D
Title (and/or other title)
E v a lu a tin g E x p o s u r e T im e u n til R e c o v e r y b y L o c a tio n
Author(s) - Please specify if necessary, corporate author(s) and Non-NRC author(s)
1 . A llis o n K e n n e d y 2 . J a c k G a lla g h e r ( n o n - N R C : H a m m u r a b i C o n s u ltin g ) 3 .' K a tie A y lw a r d
Client(s) Publication Type Language
T r a n s p o r t C a n a d a T e c h n ic a l R e p o r t E n g lis h
Key Words (5 maximum) Pages Confidentiality Period
E x p o s u r e , S u r v iv a b ility , S e a r c h a n d R e s c u e 5 6
Date: R E V # Description: Prepared Check Approved
by: by: by:
1 3 /0 9 /2 0 1 3 1 F in a l r e p o r t v e r s io n - s e n t to c lie n t A . K . J .
P.1
A .S .R . C lic k h e r e to/(L L
P
,A]YL
e n te r a d a te . C lic k h e r e tof
e n te r a d a te . C lic k h e r e to e n te r a d a te . C lic k h e r e to e n te r a d a te . C lic k h e r e to e n te r a d a te . C lic k h e r e to e n te r a d a te . C lic k h e r e to e n te r a d a te . N a tio n a l R e s e a r c h C o n s e il n a tio n a l C o u n c il C a n a d a d e r e c h e r c h e s C a n a d aCanada
Canada Canada
Ocean, Coastal and River Génie océanique, côtier et fluvial Engineering
Evaluating Exposure Time until Recovery by Location
Technical Report
UNCLASSIFIED
OCRE-TR-2013-036
Allison Kennedy, National Research Council
Jack Gallagher, Hammurabi Consulting
Katie Aylward, National Research Council
EXECUTIVE SUMMARY
This report summarizes the proceedings and findings of the project “Evaluation of Exposure Time until Recovery by Location,” which was funded by Transport Canada. The study involved the investigation of potential exposure times at eight locations dispersed throughout northern Canada. Exposure time, as defined in this report, relates to the total time from which an alert notification of an emergency event is sent, to when a rescue is affected. The primary goal of this study was to identify and assess key factors that influence the exposure time by quantifying the effect where possible.
In order to evaluate exposure time and the numerous factors that can influence this time, a two-part study was conducted. This approach allowed us to obtain experienced based quantitative and qualitative information relating to the potential exposure times and related factor effects. The first component of the study involved the development of a two-part survey which was distributed to experts in the area of marine-based SAR resources as well as air-based SAR resources. The first part of the survey was a questionnaire which prompted responses relating to the effect of key factors at the different locations considered. The second part of the survey, termed as the factor ranking sheet, listed the key factors that had been identified through a literature review and requested that they be ranked in terms of their potential to increase exposure time.
The second part of the study involved hosting a workshop to present the consolidated results of the exposure time survey, the details of the methodology that was applied to the consolidated results in order to determine the range in exposure time at each location and finally, the resulting exposure time range values. The workshop was attended by representatives of JRCC Trenton and JRCC Halifax as well as other representatives with experience in marine or air based northern operations. The workshop allowed for refinement of the survey-based exposure time ranges based on an open discussion of the factors considered as well as identification of other factors that were not captured through the survey.
The workshop findings were applied to the survey-based exposure time ranges which resulted in the final survey plus workshop based exposure time range values. These range values are applicable to the conditions under which they were investigated and are subject to change if the actual conditions are vastly different. One such condition relates to the time of year for which the exposure time ranges were defined. The marine-based exposure times may differ greatly for different periods of the year since the strategic positioning of CCG vessels can change dramatically. The conditions and assumptions surrounding the defined exposure time ranges should be considered when contemplating the exposure times indicated.
The final exposure times indicated that the minimum of the low-range exposure time values was 13 hours and this related to locations 6 and 8. The maximum of the low-range exposure time values was 27 hours which occurred at location 1, the most northerly of the locations considered. Another interesting point is that when considering marine resources only, the maximum low-range exposure time jumps to 48 hours and occurs at location 1. Survival in the harsh environmental conditions of northern Canada even at the minimum predicted exposure times would be challenging. Efforts to ensure that operations in these locations are equipped with adequate emergency and survival equipment is essential to help prevent loss of life, given the exposure times that can be expected in these areas. This could be supported by strengthening policy and regulation relating to operational requirements and Life Saving Appliance testing conditions. This partial solution could be complemented by the more costly alternative of enhancing Canada’s search and rescue capabilities in the north.
TABLE OF CONTENTS
Executive Summary ... i
1
Introduction ... 1
2
Approach ... 2
3
Timeline of Exposure... 4
4
Canadian Response Resources ... 5
4.1 Marine Based Resources ... 5
4.2 Air Based Resources ... 6
5
Identification of Factors Affecting Exposure Time ... 8
5.1 Distance from airport ... 8
5.2 Distance from Shore ... 8
5.3 Wind and Waves ... 8
5.4 Air Temperature and Precipitation ... 9
5.5 Ice Conditions ... 9
5.6 Type of Response Resource ... 10
5.7 Physical state of response resource(s) and crew ... 11
5.8 Communication Effectiveness ... 11
5.9 Preparation of Response Crews ... 11
5.10 Communication Capability ... 12
5.11 State of Evacuees ... 13
5.12 Visibility ... 13
5.13 Bathymetry Charting ... 13
5.14 Training of Captain and Crew ... 13
5.15 Accuracy of Environmental Models ... 14
6
Selection of Locations... 15
6.1 Selection Justification ... 15
6.2 Location Details ... 17
6.3 Environmental Conditions ... 20
7
Selection of Emergency Scenario ... 24
7.1 Event Details ... 24
8
Exposure Time Survey ... 26
8.1 Survey Development ... 26
8.2 Survey Distribution ... 27
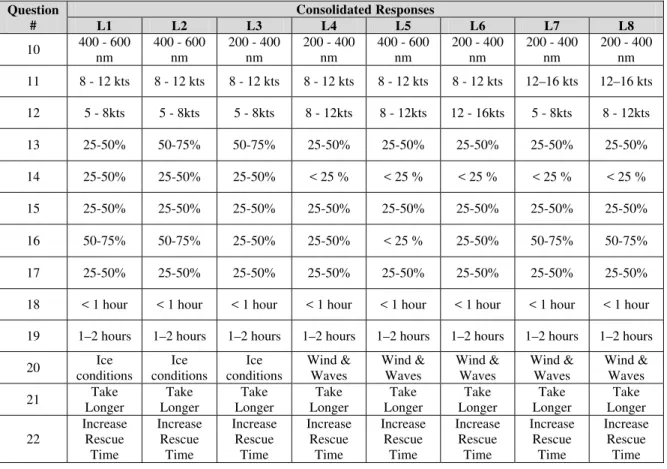
8.3 Survey Results: Compilation of Data ... 27
8.3.1 Questionnaire ... 27
8.3.2 Factor Ranking ... 29
8.4 Survey Data Analysis ... 31
8.4.1 Marine Questionnaire Analysis ... 31
8.4.2 Marine Questionnaire Analysis Results ... 34
8.4.3 Assumptions in Marine Exposure Time Analysis ... 34
8.4.4 Air Questionnaire Analysis ... 35
8.4.5 Air Questionnaire Analysis Results ... 37
8.4.7 Discussion of Marine and Air Questionnaire Analysis Results ... 38
8.5 Remaining Questions ... 39
9
Exposure Time Workshop ... 41
9.1 Workshop Goals ... 41
9.2 Workshop Attendees ... 41
9.3 Workshop Results ... 41
10
Final Data Analysis ... 44
10.1 Exposure Time Refinement... 44
10.2 Key Assumptions and Applicability of Defined Exposure Times ... 45
10.3 Exposure Time Results: Map of Expected Ranges ... 46
11
New Canadian Resources & Policy ... 49
12
Conclusions and Recommendations ... 52
13
Acknowledgement ... 54
14
References ... 55
Appendix A ……….. A1
Appendix B ……….. B1
Appendix C ……….. C1
Appendix D ……….. D1
Appendix E ……….. E1
Appendix F ……….. F1
LIST OF FIGURES
Figure 1. Exposure timeline and relevant phases ... 4Figure 2. CASARA zone organization locations and coverage areas ... 7
Figure 3. Area of interest for location selection (From AMSA, 2009) ... 15
Figure 4. Shipping Activity 2004 (Modified From: AMSA, 2009) ... 16
Figure 5. Phased Arctic ice retreat (From: ACIA, 2004) ... 16
Figure 6. Locations for consideration across Canadian North ... 17
Figure 7. JRCC coverage areas ... 20
Figure 8. Drift speeds (From Maisondieu and Pavec, 2008) ... 33
Figure 9. Merged exposure time ranges (based on all Canadian resources) ... 47
LIST OF TABLES
Table 1. CF SAR Squadron Locations ... 6Table 2. Weather station and corresponding location ... 21
Table 3. Environmental Conditions at Selected Locations ... 22
Table 4. Emergency Scenario Details ... 24
Table 5. Consolidated Marine Questionnaire Responses ... 27
Table 6. Consolidated Air Questionnaire Responses ... 28
Table 8. Consolidated Factor Ranking Results: Marine – “Other” ... 30
Table 9. Consolidated Factor Ranking Results: Air – “Listed” ... 30
Table 10. Consolidated Factor Ranking Results: Air – “Other” ... 30
Table 11. Exposure time range based on Marine Questionnaire results (in hours) ... 34
Table 12. Exposure time range based on Air Questionnaire results (in hours) ... 37
Table 13. Workshop Findings: Quantifiable ... 41
Table 14. Workshop Findings Non-Quantifiable ... 42
Table 15. Exposure time ranges based on Air & Marine Resources ... 47
Table 16. New CCG Icebreaker Particulars ... 50
LIST OF ABBREVIATIONS
ACIA Arctic Climate Impact Assessment AIS Automatic Identification System
AMSA Arctic Marine Shipping Assessment
AOPS Arctic Offshore Patrol Ships
CASARA Civil Air Search and Rescue Association
CCG Canadian Coast Guard
CCGA Canadian Coast Guard Auxiliary
CF Canadian Forces
CIS Canadian Ice Services
CSC Canadian Surface Combatant
CWEA Canadian Wind Energy Atlas
DND Department of National Defense
EPIRB Emergency Position Indicating Radio Beacons
FRC Fast Rescue Craft
FWSAR Fixed Wing Search and Rescue
GEO Geostationary Earth Orbit
GMDSS Global Maritime Distress and Safety System
HF High Frequency
HF/DSC High Frequency Digital Selective Calling
ILD Instrument Landing System
IMO International Maritime Organization JRCC Joint Rescue Coordination Centers
JSS Joint Support Ship
LEO Low Earth Orbit
LSA Life Saving Appliances
MF Medium Frequency
MRSC Maritime Rescue Sub-Center
NDB Non-Directional Beacon
NSPS National Ship Building Procurement Strategy
NSS National SAR Secretariat
POB Persons on Board
RCAF Royal Canadian Air Force
SAR Search and Rescue
SMMS Search and Rescue Mission Management System
SOLAS Safety of Life at Sea
1 INTRODUCTION
Climate change in the Canadian north is leading to an evolution in available marine transportation paths due to varying ice conditions. In recent years global warming has led to the reduction in sea ice levels which allows for travel in remote areas of northern Canada that were inoperable in the past due to extreme ice conditions. Also, less severe ice conditions are leading to an increase in the type of vessel capable of transiting through the north. Hence, not only is climate change leading to increased activity in the Canadian north, but it is also leading to operations in new remote locations as well as operations with new vessel types. Thus, climate change is causing an increased potential for an unexplored marine emergency scenario to occur within the remote areas of northern Canada.
Search and rescue operations in response to a marine emergency within Canada are managed by the federal government through three Joint Rescue Coordination Centers (JRCC’s) and one Maritime Rescue Sub-Center (MRSC). The lead agency for federal search and rescue is the Department of National Defense (DND). DND provide primary air resources to response and Air Force personnel in the JRCC’s. The Canadian Coast Guard provides the marine component of the search and rescue system and provides primary marine resources and personnel for the JRCC’s. Incidents occurring in Canadian oceans or within the federal waters of the Great Lakes and St. Lawrence River system are considered federal SAR incidents and are managed by the JRCCs. Additional information pertaining to the coordination and organization of SAR operations in Canada can be found in the National SAR Manual (DFO, 2000). Marine SAR operations are undertaken by a number of different resources including SAR vessels, helicopters, fixed wing aircraft as well as vessels and aircraft of opportunity. A vessel or aircraft of opportunity denotes a vessel or aircraft whose primary function is not SAR activities but which could be tasked with assisting in SAR activities.
This project involves an evaluation of the potential exposure times resulting from a marine emergency scenario occurring in the Canadian north. The Canadian north is defined here as locations within Canadian boundaries and above 60 degrees northern latitude. Exposure time in this context is defined as the time from when an emergency alert is sent out to the time that rescue is completed. The evaluation of exposure time is complex and requires the consideration of a number of factors that have the potential to affect the exposure time relevant to a given scenario. A key factor affecting exposure time may be location which is a primary investigation in this study. The exposure time for a marine incident occurring at a location within the high Canadian north may be much greater than the exposure time for the same incident occurring at lower northern latitude due to large distances from search and rescue assets and vessels of opportunity as well as inaccessibility caused by severe environmental conditions.
Currently available Life Saving Appliances (LSA), such as survival suits and life rafts, may not be designed to withstand the possible lengthy exposure times due to a marine emergency occurring in northern Canada. Thus, an evaluation of exposure times for different locations across the vast Canadian north will provide data that will be useful in not only gauging potential exposure time, but also assessing levels of preparedness, developing relevant regulations, and setting a baseline for the design of LSA adequate for use in such harsh, remote regions.
2 APPROACH
The approach taken to evaluate the exposure time resulting from a marine emergency occurring at locations across northern Canada is described below.
Development of exposure timeline
A timeline, representing the different phases that make up overall exposure time is formulated and described. Development and description of the exposure timeline will allow a clear understanding of what exposure time means in this context and influence consistency in terms of how exposure time is evaluated.
Canadian response resources
A review of Canadian SAR response resources was conducted and is presented in brief. This includes Canadian Forces air resources and Canadian Coast Guard marine resources. Secondary air resources offered by the Civil Air Search and Rescue Association (CASARA) and secondary marine resources offered by the Canadian Coast Guard Auxiliary are also identified.
Determination of key factors
A literature review of occurrence reports pertaining to northern emergencies along with discussions with search and rescue experts will help identify key factors that affect the duration of exposure time resulting from a marine accident in northern Canada. A qualitative review of these factors will be completed to identify how they affect exposure time and if they have the potential to restrict any phase of the exposure timeline.
Selection of locations
General locations across northern Canada to consider in the evaluation of exposure time were selected based on a number of key factors. All locations are above 60o latitude and within Canadian jurisdiction. Current and future northern Canadian shipping trends was a primary factor in that locations were selected that fall along routes that are currently travelled and those that could open up due to climate change. The quantity of locations considered was limited to the number that could be thoroughly examined in the selected evaluation scheme which includes a survey and follow-up work shop.
Development of emergency scenario
An emergency scenario was defined to allow for a comprehensive evaluation of exposure time at each of the locations selected for consideration. The scenario details were limited in an attempt to find generalized results that could be applied to a number of potential emergency scenarios. The scenario details were included as a component of the survey package and hence, considered in the survey responses.
Survey development and review
A survey was developed with the aim to gauge expert opinion on the effect that key factors have on exposure time relevant to each of the defined locations. The consolidated survey results were analyzed for each location to provide an indication of the expected range in exposure times.
Workshop for subject matter experts
A workshop was designed to obtain feedback and confirmation regarding the consolidated survey results and elicit expert opinion on factor ranking. Another goal of the workshop was to determine if experts could agree on map zones or limits where the exposure time can be differentiated.
Data analysis
The data arising from the survey and workshop was compiled and reviewed to gauge the range in potential exposure time relevant to each considered location. Survey and workshop results were used to develop a ranking scheme which is used to prioritize the exposure time factors considered in this study. Factor ranking is conducted for each location to gauge if and how the prioritization of factors, in terms of their significance in effecting exposure time, varies from one northern Canadian location to another.
Development of exposure time map
The range in exposure time, resulting from survey and workshop output, were summarized for each location considered. The results are displayed on a geographical map to provide a visual of the disparity in potential exposure times at different locations throughout the Canadian north.
Consideration of future developments
A qualitative investigation was conducted to assess the effects that future Canadian Government Arctic infrastructure projects could have on exposure times in northern Canada.
Conclusions and recommendations
Conclusions regarding the identified exposure times and factor affects across northern Canada are presented. Recommendations for further work that would complement the results of this project are provided.
3 TIMELINE OF EXPOSURE
The process by which exposure time was defined is given in Figure 1. The first phase, entitled
Initial Communications, involves the duration of time between the initial alert call and the rescue
resource departure. This phase includes the time it takes to select rescue resources and collect the required personnel. The second phase, entitled Travel to Location, is the duration of time from which a resource departs its original location to when it reaches the incident location. The travel time may vary largely for different response resources that could be used, such as a helicopter or a vessel. The third phase, entitled Search Period, involves the duration of time between arriving at the desired location and locating the personnel in distress. The duration of this phase could fluctuate depending on the emergency scenario details, for example if the ship has been abandoned and personnel are in survival craft the search time will likely be longer than if all personnel are still on the ship. The fourth and final phase, Rescue Activities, involves the duration of time between locating personnel and successfully performing rescue operations to get all personnel on board a rescue resource. Again, the duration of this phase may change depending on the location of the personnel, whether still aboard the vessel in distress, in a lifeboat, or in the water.
Figure 1. Exposure timeline and relevant phases
The factors that influence exposure time may affect a single, multiple, or all phases of the exposure timeline. A factor that affects multiple exposure timeline phases may be more significant than a factor that only affects one phase depending on the severity of the factor. The severity of a factor is gauged by the magnitude of its potential effect on the overall exposure time.
4 CANADIAN RESPONSE RESOURCES
The National SAR Secretariat (NSS) indicates that in Canada, marine SAR resources are generally provided by the CCG and the CCG Auxiliary while air SAR resources are generally provided by the Canadian Forces (CF) and CASARA. Response resources are divided into two categories namely, primary and secondary resources. Primary SAR resources refer to those resources whose primary function is to respond to SAR incidents. These resources are specially designed and equipped to deal with a SAR event and are continuously held at a standby level so that operations can begin quickly after an alert is received. Secondary SAR resources refer to any CCG or CF resource whose primary function is not SAR operations but could be directed to respond to a SAR event if assistance is required.
4.1 Marine Based Resources
The CCG provides primary and secondary marine SAR resources in Canada. The CCG has three regions across Canada namely, the Atlantic region, the Central and Arctic region and the Western region. The Central and Arctic region covers the majority of northern Canada above the Arctic Circle. The CCG has a number of bases located throughout Canada however; there are no operational bases in the north. All CCG icebreakers are considered secondary resources since their primary operational function is not SAR activities.
The CCG has two Heavy Arctic Icebreakers namely, the Louis St.-Laurent and the Terry Fox. These vessels generally operate throughout the Canadian Arctic between the months of June and mid-November and within the Gulf of St-Lawrence and East Coast of NL during winter months. The CCG has four Arctic Icebreakers which are capable of ice breaking and escort operations in the Canadian Arctic during the summer months. Additionally a light icebreaker from the Western Region works in the Western Arctic each summer.
The Canadian Coast Guard Auxiliary (CCGA) provides volunteer responders to marine search and rescue incidents across Canada. In the north, the CCGA currently have units in Aklavik, Inuvik, Pangnirtung, Rankin Inlet, Cambridge Bay, Yellowknife, Hay River, Fort Resolution, Fort Chipewyan and Fort McMurray. The response vessels used are typically in the 18 to 24 foot range and ideal for the local areas but not suitable for longer range operation. The CCGA is actively working to expand the network to other communities.
A “vessel of opportunity” is a commercial vessel that is in the proximity of an emergency event at the time of occurrence. Such a vessel could be directed to assist in Search and Rescue operations and may reach the scene first depending on the circumstance. The availability of a vessel of opportunity is by chance and therefore cannot be relied upon for emergency preparedness.
Though Canada is equipped with a strong fleet of primary and secondary SAR vessels, all of these vessels are based in southern latitudes which would lead to large transit times to an emergency scenario in the north. This may result in a heavier reliance on air based response resources for Arctic emergencies. In this assessment the Canadian icebreakers are used as the marine response. The icebreakers are secondary SAR resources however this makes the Arctic no different than any other offshore region in Canada where the SAR coverage is by multi-tasked ships that have other primary programs. None of the icebreakers are based in the north but spend their operational summer period there.
4.2 Air Based Resources
The Canadian Forces provide primary air based resources in Canada. The SAR aircraft are broken into squadrons which are based at different locations across the country. The Canadian Forces SAR squadrons are supported by approximately 750 personnel, including ground crew, air crew, and Search and Rescue Technicians. There are currently five operational SAR squadrons in Canada, as listed in Table 1 (National Defence, 2013a). There is a sub-unit of 8 Wing Trenton located in Alert, Nunavut which is the most northerly location with permanent inhabitants in the world. However, CF station Alert is a signals intelligence unit and is not equipped with any full-time SAR air resources.
Table 1. CF SAR Squadron Locations Squadron Name Squadron Location
9 Wing Gander Gander, Newfoundland and Labrador 14 Wing Greenwood Greenwood, Nova Scotia
8 Wing Trenton Trenton, Ontario
17 Wing Winnipeg Winnipeg, Manitoba
19 Wing Comox Comox, British Columbia
The Canadian Forces are equipped with three primary aircraft including the CH-149 Cormorant, the CC-130 Hercules and the CC-115 Buffalo. The first aircraft listed, which has the prefix CH is a helicopter, while the last two, with the prefix CC, are fixed-wing aircraft. In general fixed-wing aircraft are used for searching since they have a relatively long range. The rescue capabilities of fixed wing aircraft lag behind those of helicopters. Hence, marine rescue efforts, beyond the dropping of equipment and food, are generally undertaken by helicopters. Disadvantages of a helicopter when compared to a fixed wing aircraft include a smaller range and a higher operational cost.
To elaborate on rescue capabilities of the primary CF air resources: the CH-149 Cormorant can hold 10 seated passengers and four stretchers when configured for SAR operations (McGuire, 2011). CH-149 Cormorant helicopters are based at CF squadrons in Gander, NL, Greenwood, NS and Comox, BC. The CC-130 Hercules can hold 128 non-combat passengers or a maximum payload of 30,000 lbs. This fixed-wing aircraft is located at the CF squadron 8 Wing in Trenton, Ontario. The CC-115 Buffalo can carry a payload of 2727 kg or 41 combat passengers. The CF owns six CC-115 Buffalo aircraft and all are housed at the CF squadron 19 Wing in Comox, BC. The Canadian Forces also has three secondary air resources. These resources include: the CH-146 Griffon, CH-124 Sea King and the CP-140 Aurora. The CH-146 Griffon has a maximum passenger capacity of 10 and is located at nine different CF squadrons all across Canada. The CH-124 Sea King is based at two locations including Shearwater, NS and Patricia Bay, BC. The Sea King can carry a payload of approximately 2730 kg. The CP-140 Aurora is based in two CF squadrons including 19 Wing in Comox, BC and 14 Wing in Greenwood, NS. This fixed-wing aircraft has a maximum payload of approximately 36,500 kg.
The Civil Air Search and Rescue Association (CASARA) is a provider of secondary air response services in Canada. CASARA is a volunteer organization that has over 2600 members divided into zone organizations located across Canada. CASARA members are trained to assist in SAR operations in support of Canada’s National Search and Rescue Program. The location of CASARA zone organizations and their coverage areas are illustrated in Figure 2. In the north the CASARA members are trained spotters with no aircraft owners. In the event of a SAR incident a
local aircraft may be chartered and crewed with CASARA spotters. CASARA spotters are also used by the Canadian Forces on their aircraft to supplement regular crew. CASARA volunteers are on call 24 hours a day, 365 days a year.
5 IDENTIFICATION OF FACTORS AFFECTING EXPOSURE TIME
For a given marine emergency scenario, the resulting exposure time could have a large variation due to a number of key factors. To provide a meaningful representative assessment of exposure time due to a marine emergency scenario throughout Northern Canada these factors must be considered so that comprehensive results are obtained. To identify key factors affecting exposure time a literature review of accident reports, table top exercise summaries and workshop reports relating to Arctic emergency scenario’s was conducted. This research was complemented by correspondence and discussions with industry experts. The following sections provide a list of the key factors affecting the exposure time relating to a marine emergency scenario in northern Canada and a qualitative review of how these each factor affects the exposure timeline.5.1 Distance from airport
This factor refers to the physical distance between the site of the marine emergency scenario and the location of the nearest airport. The nearest airport may be the base site for an airborne SAR resource, in which case it would affect the travel time. This factor may also dictate whether an airborne SAR resource needs to stop to refuel enroute to the scenario location. It could also be a potential site for refueling of airborne SAR resources. If the distance is large, the casualties, whether in a lifeboat or free-floating, would have a longer time to drift while refueling is underway. Thus this factor has a potential effect on the search period as well as the rescue period. To summarize, this factor has the potential to effect phases 2, 3 and 4 of the exposure timeline. The distance from the airport may be more relevant in northern locations where marine activity is less frequent, the distances from primary marine SAR resources are greater and there is more of a reliance on airborne resources. This factor may also be more important in scenarios that involve a large number of casualties and an air-based rescue since the helicopter may need to drop off some casualties and refuel prior to continuing with the rescue of the remaining casualties.
5.2 Distance from Shore
This factor refers to the physical distance between the site of a marine emergency event and the closest point of land. This factor may have an effect in scenarios where airborne rescue resources are relied upon and the distance to the nearest refueling station is large. In such instances it may be possible for casualties to be lifted from the water and deposited on land while other casualties are rescued. If land were further away, the helicopter may have to refuel before it could continue to rescue additional casualties. This would increase overall travel time and potentially reduce the search period. Hence, this factor has the potential to influence phases 3 and 4 of the exposure timeline.
Since marine activity is not as frequent in the north, and the distance from primary rescue vessels may be large, the effect of this factor may be more common at northern locations than it would be in southern locations.
5.3 Wind and Waves
The wind speed and wave height at the time of a marine emergency event will undoubtedly have a large effect on the resulting exposure time. In terms of the phases of exposure time, the wind and wave conditions will play a role in the duration of phase two, three and four: travel to location, search period and rescue activities. Under high wind and wave conditions each of these phases would potentially be longer in duration in comparison to the same event occurring in low wind and wave conditions.
Besides having the ability to lengthen the exposure time, the effect of wind and wave conditions could potentially prohibit the travel to location phase (for certain resources, specifically helicopters) and the rescue activities phase if the conditions are severe. When wind speeds are above a certain level, airborne resources are not able to fly for safety reasons. For emergency scenario’s that occur at a location that is far from any potential vessel rescue resource, this condition could be critical and lead to a significant increase in exposure time. The operational limitation for wind speed is defined for each type of aircraft in the operations manual. Also, weather limits are set by both Transport Canada (TC) and the operator. Take-off and landing limits at airports, set by Transport Canada, reflect the type of landing aids and aircraft at the given airport. For example, at an airport served by an Instrument Landing System (ILD) would have lower take-off and landing limits than an airport served by a Non-Directional Beacon (NDB). In terms of rescue activities, today’s rescue technologies are not proven capable of rescuing casualties in extreme wind and wave conditions. The steepness of a wave plays a large role in successful rescue operations using an FRC. According to a Marine Rescue Advisory Group report “differences in wave steepness could enable a successful launch / recovery in one area whereas it could be prevented in another even though both have the same wave height” (MaTSU, 2001). This report describes wave steepness as being more location specific than wave height and indicates that the steepness is increased due to conflicting ocean current and wind directions. High wind in flight may delay arrival of helicopters but in prevailing wind conditions it may speed up the process. The main limitation in high winds is the ability to start the rotors. In emergencies, pilots may be expected to disregard operational limits and fly to the limits of air-worthiness.
5.4 Air Temperature and Precipitation
This factor refers to the ambient air temperature during a marine occurrence. If the temperature is cold and there is precipitation, problems could arise relating to SAR efforts. First, airborne SAR resources cannot operate safely under certain conditions where extreme icing is possible. These conditions are defined in the aircrafts operations manual and are distinct for each type of airborne resource. The presence of snow and rain could also restrict a spotter’s level of vision and thus hinder a search. Another effect of this factor could be the buildup of ice on emergency equipment, such as the outside of a lifeboat, which could complicate a rescue effort. This factor has the potential to influence phases 2, 3 and 4 of the exposure timeline.
In freezing conditions ice builds up on the helicopter in flight potentially causing loss of efficiency of rotors, damaging vibrations, blockage of intake air, reduced communications capability, and, ingestion of ice into the compressor causing damage and loss of power.
5.5 Ice Conditions
This factor related to the concentration of sea ice in the vicinity of a marine emergency as well as along the route that a SAR vessel would take to arrive on scene. The travel time could be increased for a vessel response when ice conditions are severe. The search period could be increased due to decreased maneuverability and the inability to follow standard search patterns which could create gaps in the planned search coverage leading to missed detection opportunities. The maneuverability issue would not affect an airborne resource however; decreased target detection due to the presence of ice could increase the search time. Rescue operations may be more challenging with the presence of ice since the ease of which to align the rescue vessel would be restricted. Moving ice can also make rescue by a small boat launched from a ship challenging, as an approach could be difficult. The ice conditions could impact phases 2, 3 and 4 of the exposure timeline.
The presence of ice could also damage the structural integrity of evacuation craft and restrict their operational performance. Ice pressure could prevent an evacuation craft from advancing or damage the hull causing it to leak or sink.
Ice conditions could also have some effects that could lead to decreasing exposure time. Under certain conditions, ice could allow a helicopter of opportunity that has no hoisting capability to land on the ice near a casualty and complete a rescue. Also, ice could provide a damping effect on waves allowing for calmer conditions, reducing fatigue of survivors, increasing probability of detection and making a rescue easier.
5.6 Type of Response Resource
This factor relates to the type of response resource that responds to a marine emergency scenario. The resource could be an airborne respondent such as a helicopter or fixed wing asset or a marine respondent such as a SAR vessel or vessel of opportunity. The type of response resource may play a large role in the expected exposure time. For starters, the operational speed capabilities vary for each type of resource which would influence the transit time. Secondly, the rescue capabilities of each resource type could dictate the length of time it takes to rescue casualties. Primary SAR vessels would be equipped with specialized rescue gear while a vessel of opportunity due to structural difference and lack of specialized equipment may take a longer time to complete a successful rescue operation. Another influence on exposure time relates to the search equipment and capabilities of the response resource. An airborne resource would be able to cover a larger search area over the same time period as a marine based resource. Also, an airborne resource may be equipped with dedicated spotters and infrared technologies designed to support search efforts.
The type of response resource aiding in a SAR effort has the potential to directly affect phases 2, 3 and 4 of the exposure timeline. In some instances weakness in communication systems aboard a vessel or aircraft of opportunity may relate to an increase in the initial communications time. Thus, phase 1 of the exposure timeline can also be influenced though perhaps to a lesser extent. The type of response resource available to a SAR effort may have the potential to prevent certain phases of the exposure timeline as well. Under extreme wind conditions an airborne resource may not be operable. In this case full reliance would have to be placed on a marine based resource until wind speeds diminished. In remote locations of the Canadian north the nearest marine resource may be days away. Alternatively, a fixed wing aircraft may be the first to arrive at the scene while all other resources are still hours away. A fixed wing aircraft does not have the capability to affect a marine rescue and thus rescue operations would have to wait for the arrival of a different type of response resource. The fixed wing aircraft may be able to drop supplies or personnel that can increase the potential of surviving until other assistance arrives but the timeline for the actual rescue is not reduced by these efforts. The fixed-wing aircraft could reduce overall exposure time in a scenario in which it is first to arrive on scene and embarks on a search pattern prior to a helicopter arriving on location. In instances such as this the search time, and overall exposure time, is likely to be reduced.
The exposure time resulting from a marine incident in the north may vary largely depending on the type of resource tasked to assist in SAR efforts. The effect of this factor can be intensified by the occurrence of other factors such as wind, wave and ice conditions. Quantification of this factor is challenging since there are so many possibilities of resources that could be involved in a marine incident in the Canadian North. To provide a meaningful evaluation some limits are implemented in terms of the types of resources considered. Since the availability of a resource of
opportunity cannot be counted on for SAR preparedness, this type of resource is not considered in this evaluation. Since traffic in the high north is relatively low in comparison to lower latitudes, this limitation appears reasonable.
The Canadian Coast Guard is currently evaluating a methodology of planning and evaluating SAR coverage that does account for vessels of opportunity. This represents a new dimension in SAR coverage planning in the maritime environment. If the methodology is validated and accepted for use, it may be useful to revisit the assumptions in this report and determine whether there is a measurable effect on the identified outcomes.
5.7 Physical state of response resource(s) and crew
This factor refers to the physical state of a response resource and its crew, which could influence its performance in SAR activities. For example, an icebreaker tasked to aid in SAR operations for an emergency, could have to transit through heavy ice to get to the scene. The current level of fuel onboard may affect the icebreaking efficiency, endurance and ultimately the transit time. Also, a helicopter arriving at the scene of an emergency after a 20 hour trip including stops may not have well rested spotters which may increase search and rescue times. This factor has the potential to affect phase 2, 3 and 4 of the exposure timeline.
The effects of this factor may be hard to quantify since the state of the response resource and crew have many possibilities.
5.8 Communication Effectiveness
This factor involves the process of notifying and directing SAR resources once an emergency alert has been received. For example, the communications time would depend on the number of phone calls required to notify and task the responding resources. Processes in place at JRCC’s help alleviate this factor and allow for quick notifications and tasking.
Communication effectiveness can also be a factor in the Search Phase. The effectiveness of communications will be entirely dependent on what communications capabilities are available in the survival craft and whether the survivors can communicate directly with searching craft.
5.9 Preparation of Response Crews
This factor refers to the state of preparation of the response crew members at the time of an emergency alert notification. Whether the crew is on standby or not may play a big role in the time taken to get a response resource actively engaged. Primary SAR resources are always held to a level of standby.
The Department of National Defense maintains a maximum 30 minute response capability during working hours and a maximum two hour response capability during quiet hours. The Canadian Coast Guard maintains a 30 minute response standard 24 hours a day and seven days a week for primary search and rescue vessels (TSB, 2004).
This factor would only affect Phase 1, Initial Communications, of the exposure timeline. The factor may be of higher significance when an incident occurs at a location far from the nearest primary SAR resource and thus relying more heavily on a secondary resource which may not have a stand by requirement.
5.10 Communication Capability
This factor relates to the potential for the incapability to send an alert notification in a marine emergency event occurring in northern Canada. It also relates to the capability of an evacuation craft to communicate with search personnel. Hence, this factor has the potential to affect phase one and phase three of the exposure timeline. Previous work, ranging from planning to infrastructure development, has been completed to help improve marine communication capabilities in general, and also with respect to northern regions. An international system, known as the Global Maritime Distress and Safety System (GMDSS), is a significant result of such work. The GMDSS is an international system designed to automate and improve marine emergency communications. This system is described on the Canadian Coast Guard website. In short, the system uses terrestrial and satellite technology and ship-board radio systems to help ensure a rapid alerting in the event of an emergency. The system also alerts vessels in the area and provides improved means of locating survivors (CCG, 2013). The GMDSS is mandated through the International Maritime Organization (IMO) via amendments to the Safety of Life at Sea (SOLAS) convention.
Terrestrial marine communications in the Canadian north are supported by a High Frequency Digital Selective Calling (HF/DSC) system which is operated by the Canadian Coast Guard. This system is operated at the Iqaluit Marine Communications and Traffic Service Centre and includes a remote receiver which is located in Resolute Bay. The system provides continuous HF/DSC alerting, voice communications and printing broadcasting capabilities through a designated set of frequencies of radio bands. Operational coverage includes Arctic waters above 70o northern latitude (CCG, 2013).
A recent report by the company Marintek indicates that high frequency and medium frequency communications systems may be used in safety communication, but cannot always be relied on, particularly in northern regions. The systems are susceptible to ionospheric disturbances which could occur in polar areas. Also, low temperatures, snow and icing conditions could cause problems for HF and MF communications by reducing signal strength or damaging equipment (Marintek, 2012).
There are two types of satellites that are currently operational for potential use in marine alerting in northern Canada. The first, known as a low earth orbit (LEO) satellite, have a relatively small footprint due to their proximity to the earth. This, combined with the quick travel time, leaves the LEO satellite with a window of approximately 15 minutes for a given area. If an alert is sent out just after this 15 minute window has expelled then it could be hours before the signal is picked up by the next passing LEO satellite (Paiement, 2012).
The second type of satellite, known as a geostationary earth orbit (GEO) satellite, has a high altitude orbit located directly over the equator. These satellite have a very large footprint, however, due to their positioning, they are unable to monitor the poles. Therefore, much of the Canadian north cannot be monitored by these satellites. Also, obstacles such as mountains or other high geographical features may block the satellite from receiving an alert signal (Paiement, 2012).
Despite the extensive effort aiming to implement marine communication capabilities, there still appear to be some weakness, in particular at locations near the poles. In a case where high frequency terrestrial communications are prevented due to snow and icing and GEO satellite coverage is unavailable, there is a dependency on LEO satellite communications. In this case it could take several hours for the alert to be received and communicated by a passing satellite,
depending on the time of the alert and the given satellite patterns. In the context of the Canadian north, it is deemed necessary to consider communication capability as a potential factor that could increase the exposure time resulting from a marine emergency scenario.
5.11 State of Evacuees
This factor refers to the physical state of the casualties upon rescue. For instance, the level of fatigue of a casualty could impact their ability to hold on to a rescue aid and thus prolong rescue activities. The level of injury of a casualty may dictate whether they could open and set off a flare which could potentially reduce the search period. This factor has the potential to affect phase 3 and 4 of the exposure timeline. Other factors that may affect the performance of the casualties include hypothermia, dehydration and motion sickness (Golden and Tipton 2002).
5.12 Visibility
The level of visibility at the time of the emergency event would have an effect on the length of the search period and potentially the travel and rescue time. The level of visibility is affected by the time of day, the time of year, the level of fog, precipitation and temperature. In extremely poor visibility airborne resources may be unsafe to operate. The operator sets limits related to visibility, usually at or above those limits implemented by Transport Canada. In general, there are different visual flight limits for SAR aircraft than for non-SAR aircraft. Primary SAR aircraft have been known to operate at a visibility level as low as 1/2 a nautical mile.
The SAR Mission Coordinators in the JRCC will develop a search plan based on the target being looked for, the number of search units searching, the capabilities of the search units, the search methodologies being employed and the visibility. When a search is predominately visual the search pattern is “tighter” so that the area is comprehensively swept visually over the time a search pattern is run. Better visibility allows for wider track spacing which in turn translates into a larger area searched in a given time.
5.13 Bathymetry Charting
The Arctic Marine Shipping Assessment indicated that a large percentage of marine incidents occurring in the Arctic are due to groundings (AMSA, 2009). A review of marine incident reports from the Transportation Safety Board regarding groundings revealed that a large number of these incidents were due in part to insufficient bathymetry charting. If an eligible route to an Arctic location is not charted effectively necessitate a change in routing and lead to an increased transit time. The IMO has also recognized the relative lack of good bathymetric charting in the north, amongst other specific risks, and have developed guidelines specific to the Arctic (IMO, 2002).
5.14 Training of Captain and Crew
This factor has the potential to play a large role in defining the transit as well as search and rescue time of a response resource. For starters, an experienced captain may be able to reduce the travel time to the emergency location by taking different routes or effectively using resources at hand to reduce transit and search time. Specifically for marine resources, an experienced Captain may be better capable of maneuvering through multi-year ice. This could affect both transit and search times where relevant. For air-based resources, an experienced Captain and crew may be more familiar with certain search patters or rescue procedures thus reducing the associated time.
5.15 Accuracy of Environmental Models
Environmental models are used to predict drift patterns and plan search patterns for a given emergency. The accuracy of environmental models is not consistent at all locations. For instance, the accuracy is lower for areas with limited historical physical measurements that are used for validation. The accuracy is also affected by other factors such as water depth and latitude. Hence, drift predictions may be more accurate for certain locations leading to less uncertainty in drift predictions and potentially shorter search periods.
This factor may also affect the transit and rescue phases of exposure time, particularly for air resources. If the weather conditions along the route to an emergency scenario change dramatically from those forecasted, the resource may not be as well equipped to operate through such conditions.
6 SELECTION OF LOCATIONS
A series of locations, at points within northern Canada’s oceans, were selected as base-locations for the evaluation of exposure time. By evaluating the exposure time and factor effects at a range of different locations, we will not only obtain and understanding of the variation in potential exposure times across northern Canadian shipping routes, but also get an idea as to why the exposure time varies in terms of critical factors. The following sections describe the justification behind selecting the specific locations for consideration in this analysis, details on each selected location and a discussion on rescue coordination in relation to the different locations.
6.1 Selection Justification
The geographical locations considered in this study were selected based on a number of considerations. The first was to allow for a comprehensive assessment across Northern Canadian shipping routes. As a means of limiting this vast area, the region of interest is described here as Canadian territory that is situated above the Arctic Circle (line of latitude at 66 degrees 33 minutes North) as outlined in Figure 3.
Figure 3. Area of interest for location selection (From AMSA, 2009)
The next consideration involved frequency of travel of current shipping routes across the area of interest. A maritime emergency event is more likely to occur at a location that sits on a frequently traveled route as opposed to one that falls on a route that is not frequently travelled, or not known to have been travelled at all. Travel routes for the area of interest were mapped, based on frequency of travel, as a part of the AMSA as shown in Figure 4. This mapping only includes data up to the end of 2004 and does not include fishing vessel routes.
Figure 4. Shipping Activity 2004 (Modified From: AMSA, 2009)
Another consideration in the selection of locations was the possibility of future shipping routes opening within the area of interest. Since climate change is leading to receding Arctic ice conditions, it is probable that future shipping trends will change due to accessibility of more direct routes. Therefore, areas with potential for high future travel frequencies were considered. Projections on the extent of future sea ice throughout the area of interest are graphically displayed in Figure 5. Both of these images are the result of works conducted as a part of the Arctic Climate Impact Assessment (ACIA), an international project of the Arctic Council.
Predictions indicate that ice cover will decrease initially in the Eastern section of the area of interest, particularly within the Gulf of Boothia, and subsequently decreases will become apparent in the southern section of the Canadian Archipelago. The long term forecast of ice conditions indicate that at the end of the summer months, ice coverage will be dramatically reduced in all locations across northern Canada. Thus, it would be worthwhile to examine locations positioned in the extreme north.
The quantity of locations selected was restricted to eight to allow time for a comprehensive review of each scenario within the bounds of the current project. The locations selected for assessment in this study are indicated in Figure 6. The locations are numbered for ease of reference throughout this report.
Figure 6. Locations for consideration across Canadian North
These eight locations are representative of the considerations presented above, in that they are each located in the area of interest and lie on either shipping routes that are currently travelled frequency or that have potential to have a high travel frequency due to climate change. Another consideration when selecting these locations was to ensure that they were positioned at varying distances from the nearest airport or heliport, since this factor may play a role in the exposure time. The latitude and longitude points as well as enlarged maps for each of the eight selected locations are provided in Appendix A.
6.2 Location Details
Location number one is located at 85.56o N, -81.14o W, and is the most northerly point considered in this assessment. There appears to be relatively little annual shipping activity in this area particularly during the winter months due to the presence of strong, thick ice. The closest Arctic port to location one is the research base Eureka, Nunavut (80.01o N, -86.35o W) which currently has eight staff working on a continuous rotational basis (AMSA, 2009). The research base in
Eureka is supplied by air every three weeks with fresh food and mail. Vessel supply occurs only once annually, in the late summer, during which a vessel from Montreal transfers large and heavy items.
Location number two is situated at 77.12o N, -98.53o W, which is north of Bathurst Island, Nunavut. There is currently a relatively low level of annual shipping activity in this area, particularly during the winter months, due to the presence of strong, thick sea ice. The nearest port to this location is at Resolute which is located at 74.68o N, -94.87o W, approximately 300 km away from location two. Resolute is one of Canada’s northernmost communities with a population of 214 (Canadian Census, 2011). The town is equipped with a gravel airstrip which is 1980 m in length, the longest gravel airstrip in Nunavut. The aircraft operating at this airstrip range from Twin Otters to a Boeing 727.
Location number three, 74.28o N, -102.77o W, is situated northwest of Prince of Wales Island, Nunavut. The closest port to this location is Resolute, as was the case for location two. The distance from Resolute is approximately 225 km, shorter than the distance between Resolute and location two. There is relatively little marine travel in the vicinity of location three. Again, most or all marine transportation in this area would occur during the summer months when ice conditions are less severe.
Location number four is situated at approximately 74.10o N, -80.64o W, and is northwest of Bylot Island, Nunavut. Marine activity in this area is moderate in terms of activity levels in other northern areas. There are a few ports in the relative vicinity of this location including the ports at Pond Inlet, Arctic Bay, Nanisivik and Sachs Harbour, Nunavut. Pond Inlet is the closest port to location number four. This community is located near the top of Baffin Island and has a population of approximately 1550. Pond Inlet has an airport and fresh food is flown to the town several times a week. The waters surrounding Pond Inlet are ice free for approximately 3.5 months in a given year. During the ice free season cruise ships and re-supply cargo ships operate in the area. The approximate distance between location four and Pond Inlet is 190 km. Arctic Bay also has an airport with a gravel runway that is 1199 m long. Location four is approximately 200 km away from the airport in Arctic Bay. Nanisivik has a port and dock which is currently used by the Canadian Coast Guard for training exercises. The Nanisivik port is to undergo construction and conversion into a naval station to be used primarily for refueling of government vessels. The construction is funded by the Federal government of Canada and planned to begin in 2013.
Location number five is positioned at approximately 70.79o N, -125.51o W, which is situated northeast of Tuktoyaktuk, NWT. The level of shipping activity in this area is moderate and the closest ports include those located in Tuktoyaktuk and Sachs Harbour. Sachs Harbour is a small community located on the south coast of Banks Island which has 112 people (Canadian census, 2011). The town has an airport from which it receives supplies year round. Heavy supplies and equipment are supplied via barge during the summer months. The Sachs Harbour airport is approximately 135 km from location five. Tuktoyaktuk is the most northern community that is located on the Canadian mainland. The town has an airport equipped with a gravel runway that can handle jets that have special equipment to prevent damage from gravel. The airport in Tuktoyaktuk is located approximately 325 km away from location number five. During the winter months, the community can be accessed through an ice road which is approximately 150 m long. Location number six, positioned at 68.12o N, -112.63o W, is located in the Coronation Gulf in Nunavut. The level of shipping activity in the area is moderate in relation to the other locations considered. The closest port to this location is the Lady Franklin Point airport which is approximately 45 km away. Other ports in the relative vicinity include the airport in Kugluktuk,
NU, which is approximately 115 km away and the airport in Ross Point which is approximately 80 km away from location six. Also, location six is the closest location to a Canadian Forces primary SAR aircraft station. The most northerly Canadian Forces aircraft base, in Yellowknife, NWT, is approximately 650 km away from location six. This base has four CC-138 Twinotter aircraft which are fixed-wing and have a passenger capacity of 20. These aircraft have a cruising speed of 337 km/hr, a range of 1427 km and can drop off emergency kits to stranded personnel. Location number seven, positioned at 67.11o N, -78.41o W, is located within Foxe Basin, NU. This area has a relatively high level of shipping activity in comparison to the other locations considered in this evaluation. Marine traffic at this location has a high potential to increase with climate change since more vessels may be eligible to travel through the Northwest Passages. Location number seven has a number of ports within a 300 km range including the following airports: Igloolik, Hall Beach, Logstaff Bluff, West Baffin Island, Rowley, Bray Island and Sarca Lake. The closest airports are the Hall Beach airport and the Rowley airport which are both approximately 205 km from location seven. Hall Beach is a town with approximately 546 residents (Canadian Census, 2011). The airport at this location is commercial grade and can accommodate large aircraft. Rowley Island in uninhibited however it houses an automated Surface Observing System and an unmanned Distant Early Warning Line base. Limited information regarding the airport on Rowley Island could be found.
Location number eight is positioned at approximately 68.77o N, -65.08o W and lies within Davis Strait. There is a relatively high frequency of marine traffic at this location in relation to the other locations considered. There are three airports in relatively close proximity to location number eight including: Cape Hooper, Kivitoo and Broughton Island. The Cape Hooper airport is the closest at a distance of approximately 80 km. Cape Hooper airport has a gravel airstrip of approximately 920 m in length. The airstrip at Kivitoo is relatively short and the level of upkeep is uncertain. The airport at Broughton Island (also known as Qikiqtarjuaq) has a gravel runway of approximately 11,500 m in length. This airport is a common stopover for small planes that fly to and from Europe. This airport has refuel services as well as deicing services.
All locations selected for consideration in this study fall within the jurisdiction of JRCC Halifax and JRCC Trenton. JRCC Halifax governs eastern Canada and only the most easterly locations, location number 7 and location 8, falls within its jurisdiction. All other selected locations are governed by JRCC Trenton. The Canadian JRCC coverage areas are outlined in Figure 7.
Figure 7. JRCC coverage areas
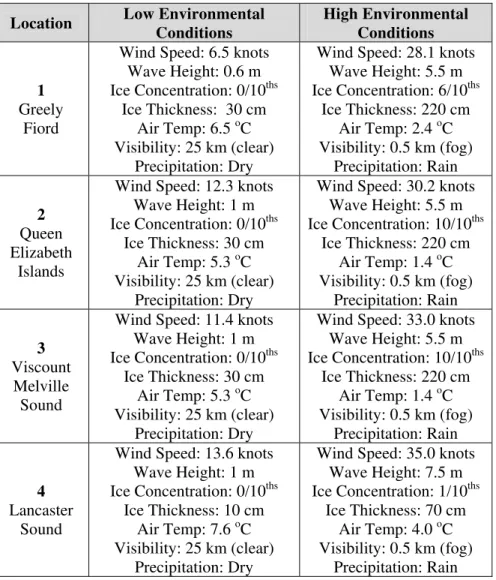
6.3 Environmental Conditions
The environmental conditions relating to each location are a key consideration in the scenario-based assessment of exposure time. Detailed evaluation of historic environmental conditions relevant to each selected location was not in the scope of work for this project. Therefore, general environmental conditions relevant to each location were selected based primarily on archived Environment Canada data. For each location, information pertaining to the wind speed, wave height, ice concentration, ice thickness and air temperature is provided. The visibility and level of precipitation are also considered however these conditions are generalized and assumed the same for each location. All information used to define the environmental conditions is available publically online.
The environmental values are given in terms of a low and high condition for each location. This provides a representative view of the range in conditions at each location. The low condition relates to the value of the condition that would cause the least detrimental effect on expected exposure time. The high condition on the other hand represents the value of the condition that would cause the most detrimental effect on exposure time. For example, in the case of wind speed, the highest winds typical of an area would represent the severe condition while the low wind speed typical of an area would represent the mild condition.
The wind data relevant to each location is determined using data from the Canadian Wind Energy Atlas (CWEA), a set of data made available by Environment Canada (see CWEA, 2013). This database contains 43 years of modeled wind data for most Canadian locations. The data can be sorted to obtain seasonal values of the mean wind speed at 30 m above sea level. Histograms depicting the annual variability in seasonal wind speed are also provided. The mean wind speed was used as the “mild” condition for wind speed and the “severe” condition was taken from the upper extremity of the relevant histogram. The CWEA data did not cover areas in the extreme
high Canadian North and thus location one and location two were not included in the database. To find representative wind speed values for these locations archived Environment Canada weather station data was used. The closest weather station to location one was Eureka and the closest weather station to location two was Resolute and thus these weather stations were used to obtain wind speed values for the corresponding locations. The mild and severe wind speed values were derived from mean, hourly wind gust speed for August 2012 between the dates of August 15th and 31st. The mild value was taken as the mean of these values and the severe case was taken as the value of the data point at which 90% of the data was below.
When representative values for the mean and severe wind speed relevant to each of the eight locations were defined, these values were used to correlate with the Beaufort scale. The Beaufort scale is a well-known and commonly used empirical measure that relates the wind speed to wave height (Transport Canada, 2003). The Beaufort scale is represented by the Beaufort number which ranges from 0 to 12. Each number relates to a range in wind speeds and corresponding wave heights. The mild and severe wind speed values obtained from CWEA and Environment Canada weather stations were matched with a corresponding Beaufort number by identifying which range of wind speeds the value fell within. Then the Beaufort range in wind speeds and corresponding wave heights were used for the mild and severe wind and wave conditions.
The ice concentration, thickness and air temperature mild and severe values were determined from data provided in reports written by the Canadian Ice Services (CIS), a branch of Environment Canada. The CIS produces annual seasonal summary reports of Canadian Arctic waters (CIS, 2013). These reports contain maps of different northern Canadian regions with colored contours to represent the ice concentration and corresponding egg code that indicates the thickness. In consideration of recent environmental changes due to climate change, only the most recent five years of data was considered. The most recent five years of data available of CIS website was between 2007 and 2011. The seasonal reports provided monthly data values and the data for August was used for this analysis. The mild value for ice concentration was taken as the lowest ice concentration observed during the month of August during the years considered. The severe value for ice concentration was taken as the highest ice concentration observed during the month of August during the years considered. Similarly, the mild value of ice thickness was taken as the lowest ice thickness observed during the years considered while the severe ice thickness was taken as the maximum thickness observed. In instances where the ice thickness was indicated as a constant minimum value for all years considered generalized values from the International Organization for Standardization (ISO, 2010) were obtained for the mild and severe values of the Canadian Archipelago. The CIS summary report provided air temperature in terms of mean monthly values as well as a value indicating the departure from the mean during the month. These values were provided based on weather stations located at distinct locations. Therefore, the locations were matched to the nearest weather station to obtain air temperature data. The mild air temperature was taken as the average of all of the monthly mean values for a given location and the severe air temperature was taken as the minimum of all of the mean monthly values minus the departure value. The locations and corresponding weather stations are summarized in Table 2.
Table 2. Weather station and corresponding location Location Number Weather Station
Location
Location Number Weather Station Location
1 Eureka 5 Tuktoyaktuk
2 Resolute 6 Kugluktuk
3 Resolute 7 Hall’s Beach