Publisher’s version / Version de l'éditeur:
Proceedings of the 27th Session of the CIE Sun City, South Africa, 9 - 16 July
2011, pp. 323-330, 2011-07-31
READ THESE TERMS AND CONDITIONS CAREFULLY BEFORE USING THIS WEBSITE. https://nrc-publications.canada.ca/eng/copyright
Vous avez des questions? Nous pouvons vous aider. Pour communiquer directement avec un auteur, consultez la
première page de la revue dans laquelle son article a été publié afin de trouver ses coordonnées. Si vous n’arrivez pas à les repérer, communiquez avec nous à [email protected].
Questions? Contact the NRC Publications Archive team at
[email protected]. If you wish to email the authors directly, please see the first page of the publication for their contact information.
NRC Publications Archive
Archives des publications du CNRC
This publication could be one of several versions: author’s original, accepted manuscript or the publisher’s version. / La version de cette publication peut être l’une des suivantes : la version prépublication de l’auteur, la version acceptée du manuscrit ou la version de l’éditeur.
Access and use of this website and the material on it are subject to the Terms and Conditions set forth at
CIE whiteness assessment of papers : impact of LED illumination
Zwinkels, J. C.; Noël, M.
https://publications-cnrc.canada.ca/fra/droits
L’accès à ce site Web et l’utilisation de son contenu sont assujettis aux conditions présentées dans le site
LISEZ CES CONDITIONS ATTENTIVEMENT AVANT D’UTILISER CE SITE WEB.
NRC Publications Record / Notice d'Archives des publications de CNRC:
https://nrc-publications.canada.ca/eng/view/object/?id=618b823f-7f8d-4c9e-b9cb-2d810ae8886f https://publications-cnrc.canada.ca/fra/voir/objet/?id=618b823f-7f8d-4c9e-b9cb-2d810ae8886fCIE WHITENESS ASSESSMENT OF PAPERS: IMPACT OF LED ILLUMINATION Zwinkels, J. C.1, Noël, M.1
1National Research Council of Canada, Ottawa, Canada
Abstract
White LED sources have been developed as replacements for various indoor lighting systems. The impact of this LED illumination for various colorimetric applications has been generally considered in terms of its colour rendering index (CRI). However, for certain applications, such as the whiteness assessment of papers, this performance metric is insufficient since it only considers the spectral power distribution (SPD) in the visible range. To improve the appearance and commercial value of white paper, papermakers often use fluorescent whitening agents (FWAs) which absorb in the near-UV and emit in the blue region. The shape and intensity of this added fluorescent light depend critically on the SPD of the irradiating source in both the UV and visible wavelength regions. This paper discusses the impact of these white LED sources for whiteness assessment of a representative fluorescent white paper sample by comparing the calculated total radiance factors and CIE whiteness with results provided under CIE and ISO reference illumination conditions.
Keywords: CIE Whiteness, Fluorescence, White LED, Total Radiance Factor, Fluorescent Whitening Agent (FWA), Colour Rendering Index (CRI)
1 Introduction
The attribute of whiteness is a commercially important specification of paper products, such as fine white papers, coated board and recycled newsprint. Papermakers typically enhance the whiteness of these products by the use of fluorescent whitening agents (FWAs) which are excited in the near-UV and emit in the visible blue, to give a preferred bluish-white appearance. The objective whiteness assessment of these paper products is carried out using ISO standardized procedures, ISO11475 (ISO, 2007) and ISO 11476 (ISO, 2010) based upon CIE colorimetry, notably the CIE Whiteness equation (CIE, 2004). With the use of new and improved FWAs, papermakers have recently produced commercial white papers that are above the CIE whiteness limits (Coppel et. al., 2007). This fact, and other limitations of the CIE Whiteness and Tint equations has motivated the creation of a new CIE technical committee within Division 1 (TC 1-77) to recommend improvements to these equations. One of their most serious limitations is that they have only been developed and tested for CIE standard Illuminant D65 conditions. However, in practice, whiteness assessment methods have been developed by various Standardizing Organizations (ISO, AATCC, ASTM) that assume these CIE Whiteness equations are applicable to other CIE illuminants (C and D50), and are considering their use for the new “indoor daylight” illuminants recently defined by the CIE (CIE, 2009). In the development of the ISO Standards on the determination of CIE whiteness using other illuminants, it was rationalized that they have a correlated colour temperature (CCT) close to D65, so their whiteness assessments should also be well correlated.
Another key assumption of these Standards is that the samples are in fact viewed under conditions that correspond to the CIE standard illuminant conditions specified for the instrumental measurements and colorimetric calculations. In the case of paper products which are typically bought, sold and used indoors, it has been experimentally demonstrated that colorimetric measurements using CIE Illuminant C conditions correlated extremely well with visual ranking under average indoor office lighting (Jordan et.al., 1991). Thus, whiteness assessment has been standardized by ISO TC6 (Paper, pulp and board) for CIE C/2 conditions to correspond with indoor illumination conditions (ISO, 2010) and for CIE D65/10 to correspond with outdoor illumination conditions (ISO, 2007). Although the former is more relevant to actual use, the latter is often reported on technical specifications of paper products, because it gives a more sensitive indicator of the amount of added FWA.
Recent energy savings initiatives, as well as significant technological progress in the production of white LEDs have promoted their use as possible replacements for several general lighting applications. It appears that in the near future, these LEDs will replace the incandescent light bulb for home and office use. The question then, is what impact this LED illumination will have on various colour and appearance assessment applications that are based on traditional indoor illumination
conditions. In this paper, we address the specific commercial issue of whiteness assessment of fluorescently-whitened papers under this white LED illumination.
For this evaluation, we consider several white LED sources on the market that are being used for various general illumination conditions to replace incandescent, fluorescent and display lighting. The performance of light sources compared to a reference source for various visual tasks is generally specified in terms of its colour rendering index (CRI) which compares how well it renders the colour of a set of objects. The visual task of interest for this application is the whiteness assessment of paper; in particular, fine white paper.
Strictly speaking, the CRI may be only compared for light sources of nearly equal CCT. However, it has been reported (Jordan and O’Neill, 1991) that the whiteness measured with a quartz-halogen lamp gives a good match to the whiteness ranking in an average office. They also found that the subjective rankings were well correlated with the CIE Whiteness calculated for CIE D65/10 and C/2 conditions. This fit was even better with an F2/10 illuminant condition. Since the CRI of a quartz halogen lamp is about 3000K and of a fluorescent lamp is about 4200K, this suggests that if a light source has a CCT close to these average office lighting conditions and has an associated high CRI, it should also give a whiteness assessment that is closely correlated with values calculated using the CIE whiteness equation.
The CCT of the white LED sources being investigated in this study agree well with their respective replacement lamps and have high CRIs. This data is summarized in Table 1. The question is whether this condition is sufficient for these white LED sources to provide whiteness assessment of papers that is in good agreement with CIE whiteness calculated in accordance with ISO Standards for indoor illumination conditions.
Table 1. Specifications of Test White LED Sources
Metric Pot light LED Incandescent LED Fluorescent LED Light engine LED
CRI 90.1 89 93.5 78
CCT (K) 3294 3000 3105 ~9800
2 Methodology
The illumination of a fine white fluorescent paper by various white LED sources and the resultant whiteness appearance has been simulated by considering the spectral power distribution (SPD) of the sources interacting with the spectral characteristics of the excitation and emission curves of a typical fluorescent paper sample, measured on the NRC Reference Spectrofluorimeter which is based on the two-monochromator method (CIE, 2007). Different CIE recommended extrapolation procedures have been used to estimate the impact of missing source data below 360 nm. This measured and assumed data is used to calculate the corresponding total spectral radiance factor data and CIE whiteness values for this paper sample. Since these white LED sources are all replacements for various traditional indoor illumination lamps, the whiteness has been calculated using the method recommended in ISO 11476 (indoor illumination conditions) where the reference illuminant is CIE C.
2.1 Test White LED sources
Four different white LED sources have been considered here for this whiteness assessment. These LEDs are currently available on the market as replacements for traditional indoor sources: pot light, incandescent, fluorescent and light-engine sources, respectively, and are referred to here by these replacement designations. The spectral data for these four LED sources is shown in Figure 1. These data were available over the wavelength range 360 (or 380) nm to 780 nm, so to compare their performance with respect to the CIE illuminants which are defined down to 300 nm, it was necessary to extrapolate the measured source data. The impact of using different CIE recommended extrapolation procedures for colorimetric calculation on the Whiteness assessment of paper is tested for one of the white LED sources (see Section 2.3.2).
Figure 1. Relative spectral power distribution (SPD) of the four test white LED sources. 2.2 Test fluorescent paper sample
The test fluorescent paper sample used in this study is representative of the fluorescent paper standards used by the ISO TC6 authorized laboratories to calibrate their instruments for whiteness in accordance with ISO Standards (ISO 11475 and ISO 11476). The impact of the illuminant on the luminescent radiance factor spectrum of this particular reference fluorescent paper standard has been previously investigated in a study to improve ISO Standards for paper colorimetry (Jordan et. al., 2002). These Standards require adjusting the ratio of UV light to visible light in the illumination to match the desired CIE illuminant condition. This procedure assumes that there is a single fluorescent moiety that is excited that produces an emission band of fixed spectral shape. However, it has been shown that this is not the case and that the shape of the emission spectrum depends upon the excitation wavelength (Jordan et al., 2002). For the CIE illuminants D65, D50, C and A, the peak of this emission spectrum occurs at 450 nm with shoulders at about 410 and 470 nm. The relative heights of these shoulders are very sensitive to the SPD of the CIE illuminant.
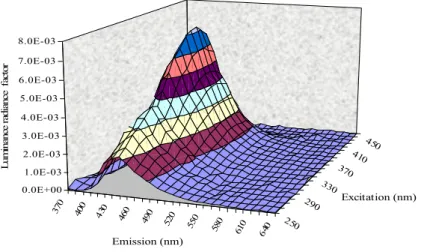
This fluorescent paper standard was measured on the NRC Reference Spectrofluorimeter, which is based on the two-monochromator method (Zwinkels et. al., 1997). This well-characterized instrument (Zwinkels et. al 1999) provides reflected, bispectral luminescent, and total radiance factors of fluorescent reflecting materials that are traceable to the international system of units (SI) through radiometric (source, detector) and material (reflectance) transfer standards. The normalized bispectral luminescent radiance factor spectra are shown in Figure 2. It can be seen that for an equi-energy source, the peak excitation occurs at a wavelength of 370 nm and the peak emission occurs at a wavelength of 450 nm. The overlap region for both excitation and emission extends from 400 nm to 450 nm.
Figure 2. Normalized bispectral luminescent radiance factor of the test fluorescent paper sample.
370 400 430 460 490 520 550 580 610 640 250 290 330 370 410450 0.0E+00 1.0E-03 2.0E-03 3.0E-03 4.0E-03 5.0E-03 6.0E-03 7.0E-03 8.0E-03 L um in an ce r ad ia nc e f ac to r Emission (nm) Excitation (nm)
2.3 Assessment of Whiteness
The assessment of the whiteness of fluorescent paper standards is carried out in accordance with one of two ISO Standards: ISO 11475 or ISO 11476. These international standards determine the CIE whiteness of papers and boards, with or without fluorescent whitening agents, when they are viewed outdoors or indoors, respectively. For outdoor illumination conditions, the CIE Whiteness is calculated for CIE standard illuminant D65 and the 10° standard colorimetric observer (D65/10). For indoor illumination conditions, the CIE Whiteness is calculated for CIE illuminant C and the 2° standard colorimetric observer. In both cases, the CIE Whiteness is calculated from measured spectral radiance factor data over the full visible range. Since the CIE Whiteness equation has only been strictly defined for CIE standard illuminant D65 conditions, it has been assumed that the use of the analogous whiteness equations for CIE illuminant C is valid for this whiteness assessment since its correlated colour temperature (Tc= 6770 K) is close to that of CIE standard illuminant D65 (Tc= 6504
K). Thus, it is implicit in this justification that the CCT is considered to be a valid metric for whiteness assessment. While the CCT is commonly used as a performance metric for colour rendering, it has been shown to be an unreliable indicator for white LED sources (Ohno, 2005). One aspect of our study was to determine if the CCT would be a good metric for whiteness assessment of paper using white LED sources intended for general illumination purposes compared with CIE and ISO reference illumination conditions.
The CIE Whiteness equation for the 2° (W) and 10° (W10) standard colorimetric observer is given in
Equations (1).
(1) where Y is the Y-tristimulus value of the sample, x and y are the x, y chromaticity coordinates of the sample, and xn, yn are the chromaticity coordinates of the perfect diffuser, all for the CIE 1931 standard colorimetric observer. Y10, x10, y10, xn,10and yn,10are similar values for the CIE 1964 standard colorimetric observer.
These linear whiteness equations are applicable only within a restricted volume of the colour solid so that they are only used for samples that are near-white.
The whiteness value can be considered to be a linear combination of a component due to lightness (Y) and a component due to blue-bias (reduced chromaticity differences from the reference illuminant). The difference between the whiteness and the Y tristimulus value then gives a measure of the whiteness due to this blue-bias Wb, which is very sensitive to the SPD of the illumination spectrum in exciting emission for fluorescent papers in the blue portion of the spectrum and producing a preferred bluish-white. This can be expressed as:
(2) For a fluorescent material, the relevant measurement quantity for appearance evaluation is the total radiance (reflectance) factor which is the sum of the reflected and fluorescent components. This is given by Equation (3):
(3) Whereas, the reflected component is independent of the source SPD, the fluorescent component depends critically upon the source SPD in the excitation range of the sample compared to its emission range. This can be seen from the following Equation (4), which is used to determine the spectrum of the luminescent component, L(from the measured bispectral luminescent radiance factor data,
L( weighted by the source SPD, Estover the excitation range, and normalized to the source SPD
at each emission wavelength, .
(4) Thus, the whiteness can also be considered as a linear combination of the whiteness due to the reflected component, WRand a component due to the fluorescent component, WL, where:
)
(
1700
)
(
800
,10 ,10 10 10Y
x
x
y
y
W
n
n
)
(
1700
)
(
800
x
x
y
y
Y
W
n
n
)
(
)
(
)
(
T
R
L)
(
1700
)
(
800
x
x
y
y
Y
W
W
b
n
n
LE
st(
)
L(
)
d
/
E
st(
)
or re-writing (5)
Thus, equations (2) and (5) give two different metrics for evaluating the impact of the source SPD on the whiteness assessment of fluorescent papers.
2.3.1 Impact of SPD
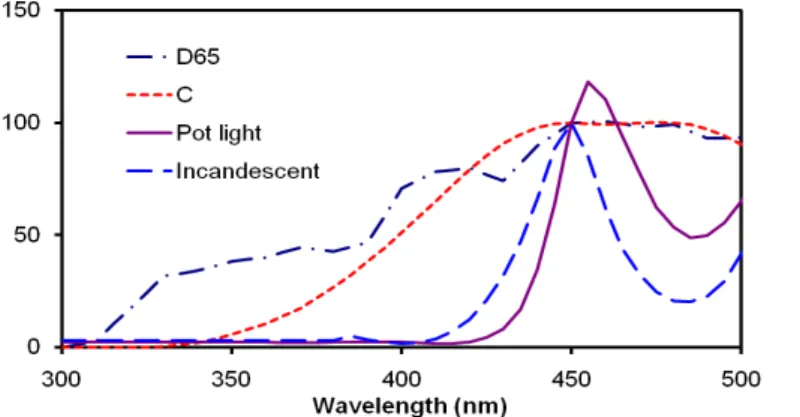
It can be seen that the SPD of the four white LED sources being investigated here are very different from the CIE illuminants typically used for whiteness assessment. This is highlighted in Figure 3, which compares the SPD of the Incandescent and Pot light replacement LEDs in relation to CIE illuminants C and D65 over the wavelength range of excitation and emission of a typical FWA, normalized to a wavelength of 450 nm which is the wavelength of peak emission of most FWAs when illuminated under CIE illuminant conditions. In the UV excitation range, it is apparent that the white LED sources are relatively deficient in energy. It is important to note that the CIE illuminants are defined only to a lower wavelength of 300 nm and this is the lowest wavelength that is used for evaluating luminescent samples (CIE, 2004). On the other hand, real sources have measurable and sometimes significant output at shorter wavelengths in the UV that needs to be considered in whiteness assessment of white luminescent materials. Thus, for calculating the total radiance factor of the fluorescent paper standard according to Equations (3) and (4) the measured LED source data needs to be extended down to at least 250 nm to match the measured bispectral luminescent radiance factor data shown in Figure 2.
Figure 3. Comparison of SPD of CIE illuminants (D65, C) and LED sources (Pot light, Incandescent)
in excitation and emission range of test fluorescent paper sample, normalized at 450 nm. For many years the CIE recommended that when the measured data was not available over the needed range for colorimetric calculation, in the absence of other information, the unmeasured values be set equal to the nearest measured value (CIE, 2004). Since the LED source SPD data was only available to about 360 nm, in this preliminary evaluation, we have constantly extrapolated the measured source radiance data down to a wavelength of 250 nm.
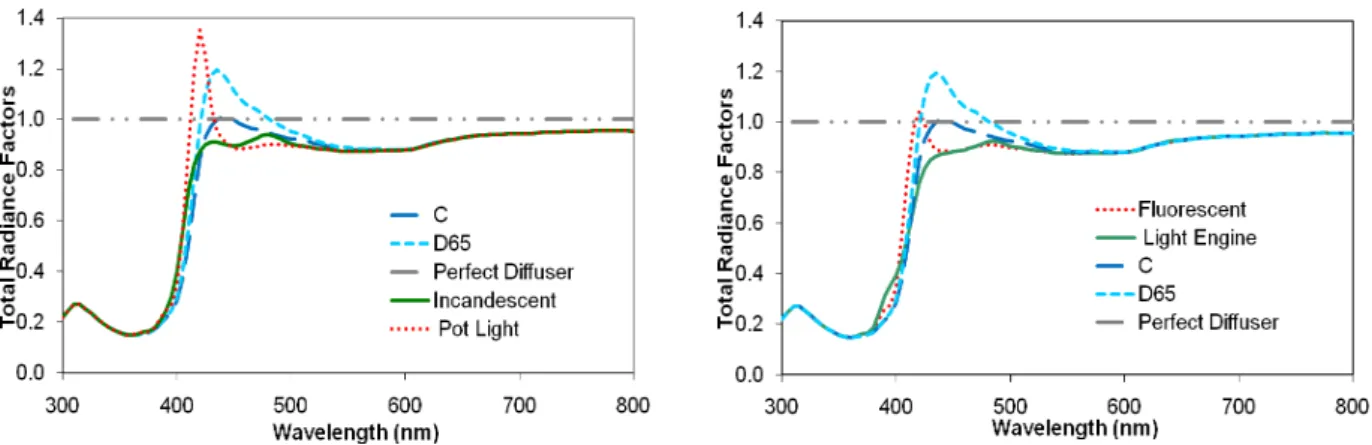
The results of these total radiance factor calculations for the four white LED sources are presented in Figure 4 and compared with the results calculated for CIE illuminants C and D65. It can be seen that the spectral shape of the fluorescent band is quite similar for CIE C and D65, peaking at 450 nm with shoulders at 410 and 470 nm; although the peak intensity is much greater under D65. However, both the spectral shape and intensity of the fluorescent band is very different for the various LED sources. For the Pot Light replacement LED, the peak of the fluorescence is at 410 nm, whereas for the Incandescent replacement LED, the peak is at 470 nm. For the Fluorescent replacement LED, the peak is also at 410 nm although much diminished compared with the Pot Light LED; whereas the Light Engine replacement LED is similar to the incandescent LED in having a peak at 470 nm but with a less pronounced feature at 410 nm.
)
(
)
(
)
(
R
L
TW
W
W
)
(
)
(
)
(
T
R
LW
W
W
Figure 4. Comparison of Total Radiance Factors of Fluorescent Paper Sample for CIE Illuminants
(D65,C), the Perfect Reflecting Diffuser, and the White LED sources: (a) Incandescent and Pot light; (b) Fluorescent and Light engine. A constant extrapolation of missing LED source data is assumed. If we compare these shapes of the fluorescent band with the corresponding SPD of the illuminating source/illuminant, it can be seen that they are intimately related. For both CIE illuminants D65 and C, their SPDs are in good agreement for wavelengths above 400 nm, i.e. in the emission range of the FWA but quite different below 400 nm, i.e. in the excitation range of the FWA. For the pot light and incandescent LED, the opposite is true with the SPDs being in good agreement in the excitation range but very different in the emission range. In the associated total radiance factor spectra, the peak occurs close to the wavelength of the minima of the SPD in the emission range of the FWA. Thus, qualitatively we can rationalize the observed differences in the total radiance factor spectra for the white LED sources compared with those obtained for the CIE illuminant conditions.
To quantify the impact of the source SPD on the whiteness assessment, we have calculated the CIE whiteness in accordance with ISO 11476 using CIE C/2 as the reference illuminant conditions. From Equations (2) and (5) above, we have seen that the whiteness can be expressed as a linear combination of different components, and we can isolate the component that is expected to be most sensitive to the influence of the SPD. These metrics have been used to compare the whiteness results for the test white LEDs with those calculated for CIE illuminant conditions. For both of these metrics, it can be seen that the Pot Light replacement LED shows the best agreement with the whiteness values under indoor illumination conditions (CIE C, CIE A). As expected, the magnitude of the fluorescent component shows the largest sensitivity to the illuminating source. However, the blue bias component is useful for comparing the tints in this whiteness assessment. From this metric, it can be clearly seen that the Light Engine replacement LED produces a significant yellowish tint that reduces the overall whiteness value.
reduces the overall whiteness value.
Figure 5. Two different metrics for evaluating the impact of the SPD on the whiteness assessment of
papers: (a) W – Y; (b) WT- WR*; the reflected component is calculated for C/2 conditions 2.3.2 Impact of Extrapolation Procedure
As we have seen, the fluorescent component of the Whiteness value is very dependent upon the SPD of the source. Since we have extrapolated the measured source data from 360 nm down to 250 nm, it
-20 0 20 40 60 80 100 120 140 160 W-Y Y 0 20 40 60 80 100 120 140 160 W-W*T R WR
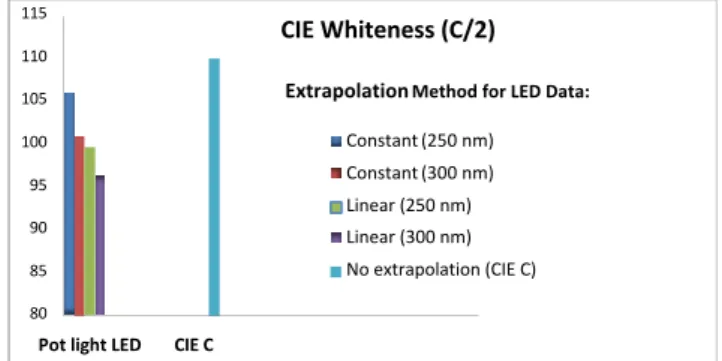
is expected that the assumptions about the nature of this unmeasured data will have an impact on the calculated colorimetric quantities. To evaluate the significance of this effect, we have considered the current CIE recommendations that permit a choice in the extrapolation procedure to be applied to measured data for use in colour computations (CIE, 2005). This supplementary assessment has been carried out on only one of the white LED sources, the replacement pot light which was shown above to give the best agreement for whiteness assessment compared with the CIE illuminants representative of indoor illumination conditions. The first of these extrapolation procedures is a simple linear extrapolation where we have considered a linear extrapolation from the lowest measured wavelength (360 nm) down to zero at either: (1) 300 nm; or (2) 250 nm. The second of these extrapolation procedures is a constant extrapolation, where we have considered a constant extrapolation from 360 nm to either (3) 300 nm; or (4) 250 nm, with the values set to zero below these lower limits.
The results of this evaluation of extrapolation procedure are summarized in Figure 6. It can be seen that the choice of extrapolation procedure has a very significant impact on the calculated CIE whiteness.
Figure 6. Impact of Extrapolation Method on Calculated CIE Whiteness (C/2)
For Pot Light LED compared with CIE Illuminant C.
2.4 Discussion and Results
It is somewhat surprising that the pot light replacement white LED can elicit a whiteness value that is close to that determined for CIE illuminant C conditions when it appears to have significantly lower UV output available for excitation. However, the degree of this agreement depends critically upon what extrapolation procedure is used for the missing data in the near-UV region. This demonstrates that the key requirement for this added fluorescent component to the whiteness assessment is not dependent upon the absolute UV content available but rather the relative UV content in the excitation range compared to the spectral distribution in the visible emission range. This also highlights the need for reliable measurement of the source output for an extended wavelength range in the near-UV. Comparison of these results with the whiteness assessment using CIE standard illuminant conditions also shows significant differences. It has been generally believed that the major impact of using white LED illumination for whiteness assessment of papers would be a decrease in the fluorescence component because very little UV output is available for exciting the fluorescence compared with traditional indoor office light. However, it is shown that the major impact comes from the spectral quality (SPD) of the illumination in the excitation range compared with the emission range of the fluorescent paper. Thus, if the LED source has a minimum in the emission range, this can produce a significant fluorescence component even if the output is low in the UV. This causes a significant change in the assessed hue of the fluorescent paper with a peak wavelength shift to either longer or shorter wavelengths, depending on the spectral details of the LED illumination.
3 Conclusion
Four different white LED sources for replacement indoor illumination have been evaluated for whiteness assessment of paper with respect to current ISO Standards and CIE recommendations. As expected, the lower UV content of the LED light sources reduces the contribution of the fluorescent component to the overall whiteness assessment. Although the CRI of three of the evaluated LED sources (Incandescent, Pot Light and Fluorescent) were in good agreement with the CRI of average office lighting conditions, this was not a good indicator of their performance in whiteness assessment of a fluorescent paper standard. The good news is that one of the evaluated LED sources – the
80 85 90 95 100 105 110 115
Pot light LED CIE C
CIE Whiteness (C/2) Constant (250 nm) Constant (300 nm) Linear (250 nm) Linear (300 nm) No extrapolation (CIE C)
replacement Pot Light – did provide a whiteness assessment that is in good agreement with that determined in accordance with the ISO Standard (ISO 11476) for indoor illumination conditions (ISO, 2010). However, the level of agreement depended critically upon the extrapolation method used for the missing source data below 360 nm. This underlines the importance of measuring the SPD of the LED source over the full excitation range of the FWA to reliably determine the magnitude of the fluorescent component of whiteness.
This simulation analysis of whiteness assessment of papers using white LEDs for general illumination purposes has a significant impact on both the papermaker and the LED lighting industry. For the papermaker, it puts into question the optimal use of FWAs for enhancing whiteness under indoor LED illumination. For the LED lighting industry, it shows the importance of having appropriate spectral quality as well as quantity of UV illumination to cause excitation of the fluorescent component of whiteness in many commercially important white products, such as fine white papers.
4 Acknowledgement
The authors gratefully acknowledge Dr. Venkat Venkatarananan of the University of Toronto who kindly provided the spectral and CRI data for the white LED sources.
References
CIE 2004. CIE 15:2004 Colorimetry. Vienna: CIE.
CIE 2005. CIE167:2005 Recommended practice for tabulating spectral data for use in colour
calculations, Vienna: CIE..
CIE 2007. CIE 182:2007 Calibration methods and photoluminescent standards for total radiance factor
measurements, Vienna: CIE.
CIE: 2009. CIE 184:2009 Indoor Daylight Illuminants, Vienna: CIE
COPPEL, L, LINDBERG, S, RYDEFALK, S 2007. Whiteness Assessment of Paper Samples at the Vicinity of the Upper CIE Whiteness Limit. CIE Publication 178:2007 Proceedings of the 26thSession
of the CIE in Beijing, China, 4-11 July 2007.. D1-10 to D1-13.
ISO 2007. ISO 11475: 2007. Paper and Board – Determination of CIE Whiteness, D65/10° (outdoor
illumination conditions). Geneva: ISO
ISO 2010. ISO 11476: 2010. Paper and Board – Determination of CIE Whiteness, C/2° (indoor
illumination conditions). Geneva: ISO
JORDAN, B.D., O’’NEILL, M.A. 1991. The Whiteness of Paper – Colorimetry and Visual Ranking.
TAPPI, 74, 93-101.
JORDAN, B.D., ZWINKELS, J. MCQUARRY, R. 2002 (personal communication).
OHNO, Y. 2005. Spectral Design Considerations for White LED Color Rendering Optical Engineering 44, 111302-1 to 111302-20.
ZWINKELS, J. GIGNAC, D.S., NEVINS., M., POWELL, I., BEWSHER, A. 1997 Design and Testing of a Two-Monochromator Reference Spectrofluorimeter for High-Accuracy Total Radiance Factor Measurements. Applied Optics, 36, 892-902.
ZWINKELS, J.C., GAUTHIER, F. 1999. Instrumentation, standards and procedures used at the NRCC for High Accuracy Fluorescence Measurements, Analytica Chimica Acta, 380, 193-209.