HAL Id: hal-03023054
https://hal.archives-ouvertes.fr/hal-03023054
Submitted on 25 Nov 2020
HAL is a multi-disciplinary open access
archive for the deposit and dissemination of
sci-entific research documents, whether they are
pub-lished or not. The documents may come from
teaching and research institutions in France or
abroad, or from public or private research centers.
L’archive ouverte pluridisciplinaire HAL, est
destinée au dépôt et à la diffusion de documents
scientifiques de niveau recherche, publiés ou non,
émanant des établissements d’enseignement et de
recherche français ou étrangers, des laboratoires
publics ou privés.
Aurélien Ducat, Betty Couderc, Anthony Bouter, Louise Biquard, Rajaa
Aouache, Bruno Passet, Ludivine Doridot, Marie-Benoîte Cohen, Pascale
Ribaux, Clara Apicella, et al.
To cite this version:
Aurélien Ducat, Betty Couderc, Anthony Bouter, Louise Biquard, Rajaa Aouache, et al.. Molecular
Mechanisms of Trophoblast Dysfunction Mediated by Imbalance between STOX1 Isoforms. iScience,
Elsevier, 2020, 23 (5), �10.1016/j.isci.2020.101086�. �hal-03023054�
iScience
Article
Molecular Mechanisms of Trophoblast Dysfunction
Mediated by Imbalance between STOX1 Isoforms
Aure´lien Ducat,
Betty Couderc,
Anthony
Bouter, ...,
Jean-Luc Vilotte,
Francisco Miralles,
Daniel Vaiman
daniel.vaiman@inserm.fr HIGHLIGHTS STOX1, involved in preeclampsia, recognizes specific DNA sequencesDownregulation of STOX1 isoforms has limited effect on trophoblast gene expression
Overexpression of STOX1A and B leads to downregulation of some genes
Overexpression of STOX1A or STOX1B leads to opposite effects on other genes
DATA AND CODE AVAILABILITY
GSE148088
Ducat et al., iScience 23, 101086 May 22, 2020ª 2020 The Author(s). https://doi.org/10.1016/ j.isci.2020.101086
ll
OPEN ACCESS
Article
Molecular Mechanisms of Trophoblast
Dysfunction Mediated by Imbalance
between STOX1 Isoforms
Aure´lien Ducat,
1Betty Couderc,
1Anthony Bouter,
2Louise Biquard,
1Rajaa Aouache,
1Bruno Passet,
3Ludivine Doridot,
1Marie-Benoıˆte Cohen,
4Pascale Ribaux,
4Clara Apicella,
1Ire`ne Gaillard,
1Sophia Palfray,
1Yulian Chen,
1Alexandra Vargas,
1Ame´lie Jule´,
1Le´o Frelin,
2Julie Cocquet,
1Camino Ruano San Martin,
1Se´bastien Jacques,
1Florence Busato,
5Jorg Tost,
5Ce´line Me´hats,
1Paul Laissue,
6Jean-Luc Vilotte,
3Francisco Miralles,
1and Daniel Vaiman
1,7,*
SUMMARY
STOX1 is a transcription factor involved in preeclampsia and Alzheimer disease.
We show that the knock-down of the gene induces rather mild effect on gene
expression in trophoblast cell lines (BeWo). We identified binding sites of
STOX1 shared by the two major isoforms, STOX1A and STOX1B. Profiling gene
expression of cells overexpressing either STOX1A or STOX1B, we identified
genes downregulated by both isoforms, with a STOX1 binding site in their
pro-moters. Among those, STOX1-induced Annexin A1 downregulation led to
abol-ished membrane repair in BeWo cells. By contrast, overexpression of STOX1A
or B has opposite effects on trophoblast fusion (acceleration and inhibition,
respectively) accompanied by syncytin genes deregulation. Also, STOX1A
over-expression led to abnormal regulation of oxidative and nitrosative stress. In
sum, our work shows that STOX1 isoform imbalance is a cause of gene expression
deregulation in the trophoblast, possibly leading to placental dysfunction and
preeclampsia.
INTRODUCTION
STOX1, storkheadbox 1, a transcription factor belonging to the enlarged FOX family, was discovered in 2005 by the association of genetic polymorphisms located inside the open reading frame of the gene with familial forms of preeclampsia (PE) (van Dijk et al., 2005), a placental disease inducing systemic endo-thelial dysfunction, leading to hypertension and proteinuria in pregnant women. From then on, STOX1 was found to play important roles in cell proliferation (Abel et al., 2012; Nie et al., 2015; van Abel et al., 2011), migration/invasion mechanisms (Tyberghein et al., 2012; van Dijk et al., 2010), and oxidative/nitrosative stress balance (Doridot et al., 2014). Several reports also connected STOX1 with Alzheimer disease (van Abel et al., 2012a, 2012b; van Dijk et al., 2010), perhaps through a specific role in neurogenesis via transcrip-tional repression of the MATH1 helix-loop-helix transcription factor (Joubert et al., 2016). STOX1 exists un-der two major isoforms, STOX1A (the most complete, encompassing in particular a DNA-binding domain and a transactivator domain) and STOX1B, which does not encompass the transactivator domain (van Dijk et al., 2005). To note, among the striking specificities of this gene, its sequence appears to encompass a highly conserved Piwi-interacting RNA cluster (Chirn et al., 2015) that may be involved in STOX1-induced gene regulation. However, the precise mechanisms by which STOX1 controls gene expression are still not well known. We recently hypothesized that the two isoforms could compete for the same DNA binding site(s), thereby inducing opposite physiological responses (Vaiman and Miralles, 2016). This question of the balance between STOX1A and STOX1B is at the center of the present study.
The cytotrophoblast is a placental-specific cell type. The trophectoderm, the cell layer surrounding the mammalian embryo at the blastocyst stage, consists of cytotrophoblasts. As soon as implantation occurs, around 8 to 9 days post-fertilization in humans, cytotrophoblasts fuse and generate a syncytium called the syncytiotrophoblast (Orendi et al., 2010; Pidoux et al., 2012). This is accompanied by wide modifications of cell physiology, with increased concentration of cAMP levels, triggering a cascade starting from the
1Institut Cochin, U1016,
INSERM, UMR 8504 CNRS, Universite´ Paris Descartes, Paris 75014, France
2Institute of Chemistry and
Biology of Membranes and Nano-objects, UMR 5248, CNRS, University of Bordeaux, IPB, 33600 Pessac, France 3Universite´ Paris-Saclay, INRAE, AgroParisTech, UMR1313-GABI, 78350, Jouy-en-Josas, France 4Department of Gynecology Obstetrics, Faculty of Medicine, University of Geneva, 1205 Geneva, Switzerland
5Laboratory for Epigenetics
and Environment, Institut de Biologie Franc¸ois Jacob, Commissariat a`l’Energie Atomique, Evry 91057, France
6Biopas Laboratoires,
BIOPAS GROUP, Bogota´, Colombia 7Lead Contact *Correspondence: daniel.vaiman@inserm.fr https://doi.org/10.1016/j.isci. 2020.101086
activation of protein kinase A and eventually activating the trophoblast-specific transcription factor glial cell missing homolog 1 (GCM1). Among GCM1 targets is ERVW1, which is a gene of endoretroviral origin encoding syncytin 1 that plays a pivotal role in placental cell syncytialization (Mallet et al., 2004). Cytotro-phoblast fusion is accompanied by a complete modification of the expression profile of numerous genes, notably chorionic gonadotrophin chain beta (CGB), encoding the b chain of the human CG (hCG) (Shankar et al., 2015). Hence, the detection of hCG is used to diagnose early pregnancy in pregnancy tests. After implantation, the villous tree develops via ramification, mesenchyme increase, and angiogenesis in-side each villus. The developing placenta is bounded by a syncytiotrophoblast layer, under which villous trophoblasts reside. These cells serve as a reserve for regenerating the syncytiotrophoblast during human pregnancy. In humans, some trophoblasts become extravillous: some constitute plugs obstructing the maternal arteries during the first trimester of pregnancy (Carbillon et al., 2001), whereas some others invade the maternal spiraled arteries by exchanging their place with endothelial cells and modifying the arterial phenotype and contractility (Chen et al., 2012). Cell models of the two major types of trophoblasts, i.e. close to extravillous trophoblasts (EVTs) and close to villous cytotrophoblasts (VCTs), are available. Among those, BeWo cells are particularly interesting tools to analyze VCT physiology because BeWo cells can fuse into syncytiotrophoblasts when the cAMP cascade is induced by forskolin. This model has been extensively used to characterize the mechanisms of trophoblast fusion (Azar et al., 2018).
In this study, we aimed at elucidating the importance of the STOX1A/STOX1B imbalance in the function of this transcription factor. We first carried out a knock-down experiment in BeWo cells with and without for-skolin-induced fusion, showing a very mild effect of this downregulation on genes relevant for trophoblast biology. To progress further, we identified the DNA sequences recognized by STOX1 and present evi-dence indicating that STOX1 is a major regulator of bona fide trophoblast function through the STOX1A/STOX1B imbalance that induces trophoblast dysfunction by various molecular mechanisms, affecting major pathways required by the placenta to work normally, such as syncytialization, membrane repair, or redox equilibrium. Deregulation of gene expression induced by STOX1 occurred via its conven-tional action as a transcription factor, binding to a promoter at specific sequences, and thereby regulating gene expression, but possibly also via epigenome alterations leading to modifications of the methylation profile for certain genes. In sum, we show here that STOX1 is a transcription factor acting originally through the balance between two isoforms, probably regulated by alternative splicing and competing for the same binding site.
RESULTS
Mild Effects of STOX1 Downregulation on the Expression of Pivotal Placental Genes
Knock-down of STOX1 (all isoforms,Figure S1) was carried out by siRNA treatment and the effect studied in con-trol BeWo cells treated or not with forskolin, an activator of the cAMP cascade known to induce syncytialization in this trophoblastic cell model. The expression of seventeen genes relevant for trophoblast function (including STOX1) was then assessed, using RT-qPCR (Figure 1,Table S1). These genes included genes involved in tropho-blast fusion (Syncytin1, Syncytin2, CGA, TGM2 (Robinson et al., 2007)), membrane repair (ANXA1, ANXA2), oxidative stress (NOS3, CAV1, CAPN6), protein dynamics (GPR146, PSMG1, WRB, ITIH5), apoptosis regulation (SEMA6A (Pantham et al., 2012)), cell cycle (BRWD1), and chromatin activity (HMGN1).
STOX1 mRNA level was downregulated by forskolin treatment (by 65%), as well as by the siRNA by 61% (Figure 1). The downregulation of STOX1, along with cell differentiation induced by forskolin, is consistent with reports mentioning STOX1 as a proliferation/differentiation regulator in several tissues (Nie et al., 2015; Zhang et al., 2016). Among the putative target genes, 14 genes were strongly affected at the expres-sion level by forskolin treatment (Syncytin2, CGA, ANXA1, ANXA2, GPR146, CAPN6, NOS3, CAV1, ITIH5, TGM2, SEMA6, PSMG1). The STOX1 knockdown affected more mildly only three genes (CAPN6, BRWD1, and ITIH5). The interaction effect between the two factors was not significant, in any gene system. This mild effect of STOX1 inhibition led us to analyze in more detail the mechanism of action of this transcription fac-tor, by identifying its DNA-binding sequence and evaluating the effect of a STOX1A versus STOX1B imbalance.
Identification of the STOX1 Binding Site
We used the PCR-selection procedure (Pollock, 2001) based on five rounds of PCR enrichment of oligonu-cleotides presenting a random sequence of 26 bp in their middle, after immunoprecipitation of the
ll
cognate transcription factor. With lack of excellent validated antibodies for STOX1, we cloned a flagged STOX1B gene and overexpressed the chimeric protein in COS-7 cells, a cell model that is very easily and efficiently transfected by classical lipofectamin procedures (more than 90% efficiency). Fifty-eight se-quences were obtained, and MEME (Bailey et al., 2009) revealed two significantly enriched conserved DNA elements, further called STOX responsive element 1 (STRE1; CATYTCACGG) and STOX-responsive element 2 (STRE2; GGTGYGGAMA), with E-values of 4.1 10 9and 1.5 10 11, respectively. In the control experiment, 44 sequences were obtained, with no significant enrichment in a specific sequence (best E-value = 1.8 102). In ~80% of the sequences, STRE1 and 2 were present together in the 26-bp-enriched frag-ment (Figure 2A).
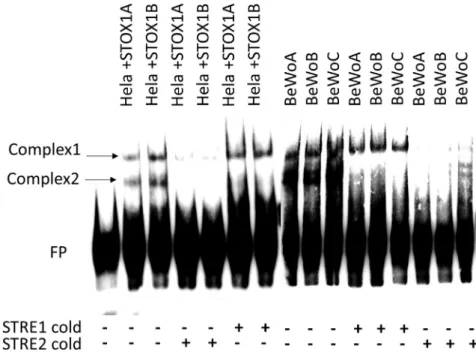
To validate the identified sequences, we used gel-shift assays (Figure 2B). We designed biotinylated oligo-nucleotides presenting three copies of STRE1 or three copies of STRE2 and used them in the assays, incubating these probes with COS-7 and JEG-3 protein extracts after transfection by a STOX1A- or B-ex-pressing vector (as a model of cytotrophoblast cells that are unable to fuse) and with extracts from BeWo cells stably transfected with STOX1A or STOX1B expression vectors (see below). We did not observe spe-cific retarded bands corresponding to STOX1A or B binding to STRE2 (data not shown). By contrast, STRE1 revealed clear specific bindings to a band of apparent high molecular weight when STOX1A was overex-pressed and to a band of lower molecular weight when STOX1B was overexoverex-pressed, and this was true in the three cell models analyzed. The co-occurrence of STRE1 and STRE2 in most of the enriched fragments suggest that STRE2 enhances the binding of STOX proteins to STRE1, without being directly bound. To evaluate the ability of these sequences to drive transcription, we cloned STRE2 and 1 alone or together in front of the luciferase reporter gene and analyzed their ability to confer expression modifications in two cell models (COS-7 and JEG-3, that are commonly used in transient transfections), with similar results (as shown for JEG-3 cells inFigure 2C). STRE1 alone could be induced with STOX1A overexpression (1.2-Figure 1. Impact of STOX1 Knock-Down on Genes Involved in Trophoblast Function in BeWo Cells, with or without Forskolin-Induced Fusion (FSK and CTL, Respectively)
For each gene the two first bars are mock-transfected and the two next siRNA-transfected. * relates to significance for the forskolin effect, and # the siRNA effect (ANOVA 2-factors—STOX KD and forskolin treatment—for each gene, * and #: p < 0.05, ** and ###: p < 0.01, and *** and ###: p < 0.001).
ll
fold, p < 0.01), but this induction was enhanced with a construction containing both STRE1 and 2 to 1.59-fold (p < 0.001); STOX1B overexpression appeared unable to mediate this increased expression. We car-ried the same type of experiments using STRE1 and STRE2 mutants cloned in front of the luciferase reporter. In this case, STOX1A overexpression was unable to increase luciferase activity (Figure S2). Despite the observed effect of STOX1A on STRE1+2 constructs, the observed induction levels cannot solely account for what was observed in the cell transcriptome experiments previously published, with maximal induction levels reaching >15- to 20-fold in JEG-3 cells overexpressing STOX1A (Rigourd et al., 2008).
Implications of the Discovery of the STOX1 Binding Site in the Context of a Villous Trophoblast Cell Model
Three different stable cell lines derived from the BeWo choriocarcinoma (homologous to villous tropho-blasts, VCTs) were created for the present study. These three BeWo-derived stable cell lines overexpress either STOX1A or STOX1B or have only the empty expression vector conferring Geneticin resistance. These cell lines were called BeWoA, B, and C, respectively. The relative expression of STOX1A and STOX1B was analyzed with specific qPCR primers, revealing an overexpression of ~25-fold for STOX1A in BeWoA compared with BeWoC, and of ~6-fold for STOX1B in BeWoB cells compared with BeWoC cells. Although the degree of overexpression differs for the two isoforms, the increase is clearly enough to perturb dras-tically the balance between the two isoforms in a given cell line.
We performed transcriptome analysis of the three cell lines before and after forskolin-induced cell fusion. PCA analysis separated clearly the different conditions (Figure 3A). The data were submitted to GEO Pro-files under the accession number GSE148088 and analyzed using the Transcriptome Analysis Console from Affymetrix (Thermofisher). Genes that are studied in this paper are presented as a list inTable S2. The first axis of the PCA (38.6% of the variance) encapsulates the variation induced by forskolin treatment leading to cell fusion, with different trajectories dependent on the enhanced expression of STOX1A or STOX1B. The number of modified genes according to the conditions (Figure 3B) ranged from 858 (comparison between BeWoB and BeWoC) to 4,198 (comparison between BeWoA+ FSK and BeWoA). The left part of the figure (three groups of histograms) shows that following forskolin treatment, there was a systematic bias toward downregulated genes. The right part of the figure (four groups of histograms) presents the changes induced by STOX1A or STOX1B overexpression, with or without forskolin. In these cases, there was a sys-tematic excess of downregulated genes, as well.
Next, we wished to study whether the presence of STRE1 and/or STRE2 in a gene promoter was associated with deregulation when STOX isoforms were overexpressed. Bioinformatics analysis of promoters using EPD (Eukaryotic Promoter Database, https://epd.vital-it.ch/index.php) was performed to search for Figure 2. Identification of STOX1A Binding Site
(A) Target sequences identified by MEME after PCR selection experiments (see text). The 2 sequences were analyzed by gel-shift experiments. Each experiment was reproduced three times.
(B) In the left panel, STOX1A or B was overexpressed transiently in COS-7 cells. A small complex was retarded when STOX1B was transfected (black arrow), and a larger complex was retarded when STOX1A was overexpressed (red arrow). The anti-flag antibody abolished the binding, which suggests that the antibody tends to compete on the DNA binding domain. In the center panel, STOX1A or B with six flags (6F-STOX1A) was transiently transfected in JEG-3 cells. In these cases, a specific complex was detected (red arrow), together with a smaller complex corresponding to STOX1B, spontaneously present in JEG-3 trophoblast cells (black arrows, absent in COS-7 cells with low basal expression level of STOX1). The competition with homologous (STRE1 cold) or mutant sequences (mSTRE1 cold) revealed that the band corresponding to the highest molecular weight was not specific, whereas the second (corresponding to STOX1A) and the third (corresponding to STOX1B) appear specific. The right panel presents a gel-shift experiment with protein extracts from BeWoA and BeWoB cells. As expected from the known expression of STOX1 at a basal level in these trophoblast cells, STOX1A and B bands appear in both cell lines, but their ratio is reversed, as shown after quantification above the gel shift. The retarded band corresponding to STOX1A is 2.15-fold more intense than the STOX1B band in BeWoA cells. By contrast in BeWoB, the STOX1B band is 1.34-fold more intense than the STOX1A band in BeWoB.
(C) STRE1 and 2 were cloned in both orientations, isolated or together in front of a CMV-luciferase reporter plasmid, and transfected in JEG-3 cells. The clones are called 3R, 4R, 7F, and 7R and correspond to various constructions harboring STRE1, STRE2, or both, in forward or reverse orientations, compared with the sequences firstly identified. Data are mean G SEM from four experiments and normalized against an empty CMV vector (n = 4, 4-plicates to 6-plicates, for each construction ANOVA 1 factor, followed by Dunnett post-hoc test, ***p < 0.001).
ll
STRE1 and STRE2 motifs in the 1,000 bp to +200 bp region of genes around the ATG codon; this resulted in 1,688 genes with a STRE1 sequence, 3,797 with a STRE2 and 444 encompassing both sequences ( Fig-ure 4A). By a contingency c2 analysis, we compared the gene deregulation induced either by STOX1A or STOX1B, in these gene subsets, with the alterations counted at the transcriptome level (21,448 genes). The log of the p value was plotted for each comparison and showed that there was a significant enrichment in deregulated genes in almost every situation (Figure 4B), except for STRE2-containing promoters when STOX1A was overexpressed under forskolin treatment. In sum, these results suggest that the increased concentration of STOX1A or STOX1B in the cells tend to trigger their binding sites with concomitant gene expression alterations.
We performed a Gene Set Enrichment Analysis (GSEA) using the String online tool (https://string-db.org/ cgi) (Szklarczyk et al., 2019) on the subset of genes encompassing either STRE1 or STRE2 in the different comparisons toward the BeWo control cells (BeWoC), with or without forskolin. Although no significant ontology clustering was obtained for STRE1-encompassing gene promoters, genes encompassing STRE2 in their promoters and modulated by STOX1A were significantly enriched in ‘‘metallothionein’’ and ‘‘RNA metabolism’’ genes. To note, MT1L, MT2A, MT1E, MT1A, MT1B, MT1G, MT1H, MT1X, MT1M, MT1F, and MT1IP were all downregulated by STOX1A 17.86-, 17.35-, 15.88-, 14.87-, 12.62-, 9.77-, 9.48-, 6.24-, 6.15-, 4.3-, and 2.91-fold, respectively. Most of these genes are located at 16q13, strongly suggesting that STOX1A regulates the expression of this genomic region. The possible consequences of this dereg-ulation on the management of oxidative stress will be described below. When STOX1B is overexpressed the enriched ontology is ‘‘Cellular response to DNA damage/DNA repair.’’ In the presence of forskolin, we found an enrichment in the terms ‘‘Mitotic cell processes,’’ ‘‘DNA repair,’’ and ‘‘rRNA processing’’ when STOX1A is overexpressed. Finally, when STOX1B is overexpressed in the presence of forskolin, the ontology enrichment identifies the terms ‘‘DNA repair’’ and ‘‘RNA metabolism.’’ The downregulation of metallothionein genes specifically by STOX1A without induction of fusion by forskolin suggests that these BeWoA cells will be more prone to oxidative stress, because metallothioneins are major antioxidant molecules (Ruttkay-Nedecky et al., 2013).
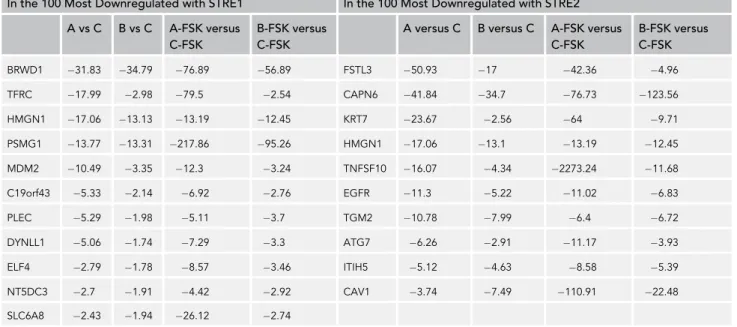
In a next step of the analysis, we identified among the 100 most deregulated genes in each of the four com-parisons, transcripts that were deregulated in all the experimental conditions (overexpression of STOX1A or STOX1B G forskolin treatment), as summarized inTable1.
All these genes were systematically downregulated. We noticed that some were characterized by a decreased expression triggered indifferently by the overexpression of STOX1A or STOX1B, generally without much influence of forskolin treatment. This was the case for BRWD1, HMGN1, PSMG1, CAPN6, TGM2, and ITIH5. Systematic filtering genes harboring the same type of profile allowed us to aggregate to this list four additional genes that were not extracted by the promoter database screening—ANXA1, GPR146, SEMA6, and WRB. The expression profile of these genes is presented inFigure 5A.
Analysis of the promoters of these genes by MEME revealed an enrichment of specific sequences that were present in almost all the promoters; the two most conserved were associated in close vicinity in six out of ten promoters (Figure 5B). This prompted us to synthesize a probe including both motifs (Figure 5C). In gel-shift experiments (Figure 6), carried out either in HeLa cells transiently transfected with either STOX1A or STOX1B or in the BeWo cell lines stably transfected (BeWoA and BeWoB, or control BeWoC), we could observe two complexes, independent of the overexpression of STOX1A or B. Non-biotinylated STRE1 (‘‘cold’’) was able to compete out only complex 2, whereas STRE2 could suppress complex 1 (and complex 2 as well, showing that this complex is not specific, being removed by any cold competitor). One interpretation is that Complex 1 contains a STRE2 binding site. Sequence reanalysis of the probe re-vealed the presence of a GGCRYGG sequence (in purple inFigure 5C), which, although not strictly identical Figure 3. Transcriptome Analysis of BeWo Cells (BeWoC: Controls, BeWoA: with STOX1A Overexpression, BeWoB: with STOX1B Overexpression)
(A) PCA analysis successfully clusters the cells according to their expression and the forskolin treatment effects. (B) Differential analysis of gene expression following forskolin treatment (three categories at the left part of the figure) and comparing overexpressing versus control cells (four categories on the right side). In gray histograms are the total number of modified genes, in red the upregulated genes, and in green the downregulated genes (threshold >1.5 or <1.5, p < 0.05).
to STRE2 (GGTGYGGAMA), is very similar. In addition, the STRE2 consensus percentages defined by the MEME software following the PCR-selection experiment were 100, 100%, 74%, 78%, 52%, 100%, and 100% at each of the seven first-base position, respectively. This indicates that the motif GGNNNGG is the main sequence recognized by a putative STRE2-binding factor.
As a paradigm of this group of genes downregulated indifferently by the two STOX1 isoforms, we studied in more detail the HMGN1promoter. HMGN1 encodes a protein associated to active chromatin and to transcription activation, which justifies our focus on this gene. We first evaluated by RT-qPCR the impact Figure 4. The Occurrences of STRE1/STRE2 in Gene Promoters and Gene Expression Deregulation in the BeWo Cells Overexpressing STOX1 Isoforms
(A) Bioinformatics analyses of promoters of human genes for the presence of STRE1 and/or STRE2 from the EPD database. The Venn diagram allows to identify 444 promoters encompassing both sequences.
(B) Deregulations of genes encompassing STRE1, STRE2, or both sequences in their promoters. The dashed line represents the significance threshold (p < 0.05). The gene deregulations at the genome level were calculated from the ~21,000 genes present in the microarray.
ll
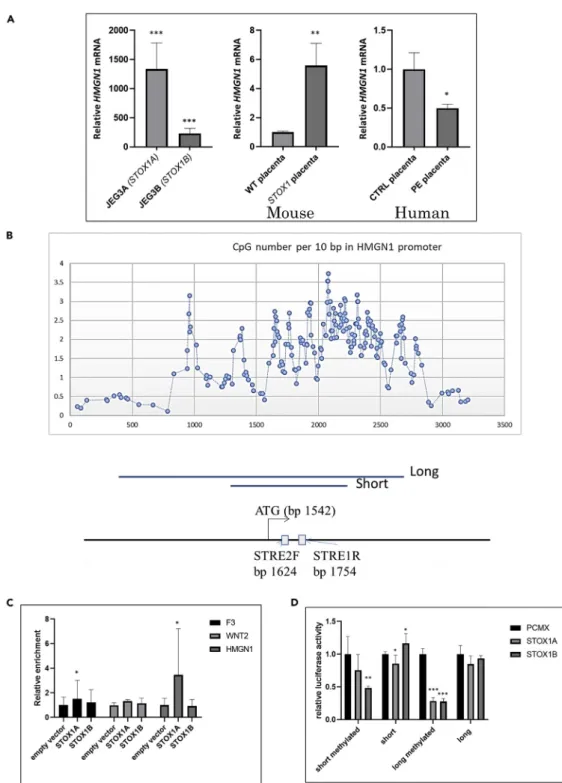
of STOX1A and STOX1B overexpression on HMGN1 expression levels in extravillous trophoblast models (JEG3 overexpressing STOX isoforms) that were previously described (Rigourd et al., 2008). Surprisingly, in this cell model HMGN1 was strongly induced by STOX1A and STOX1B overexpression (1300-fold and 200-fold, respectively), whereas in the villous trophoblast model BeWo, it was downregulated (Figure 7A, left). The expression of HMGN1 was also enhanced in mouse placentas overexpressing STOX1A, the base for a previously published preeclampsia model (Figure 7A, center). By contrast, in human placentas, HMGN1 was significantly downregulated in preeclamptic samples (Figure 7A, right). This observation is consistent with the fact that human placentas samples are collected from villous material and hence do not contain extra-villous trophoblasts, which could explain why the human placenta responds in preeclampsia similarly to BeWo cells (as a proxy to villous trophoblast).
Another dimension of the regulation of HMGN1 could be of epigenetic nature, because the first exon of the gene encompasses a CpG island as shown inFigure 7B. We performed a ChIP-qPCR experiment after immunoprecipitation of Flag-STOX1A or Flag-STOX1B transfected in JEG-3 cells (four replicates), leading to a significant enrichment of 3-fold over the empty plasmid for STOX1A (Figure 7C). This binding was consistent with the presence of a STRE1 binding site in this promoter. We also cloned two fragments of the HMGN1 promoter in front of the luciferase reporter gene (831 and 2,192 bp,Figure 7B). We did not observe strong HMGN1 mRNA level modification fostered by STOX1 overexpression, either using the short or the long version of the promoter that has been cloned. However, once the promoter was methylated in vitro, STOX1B as well as STOX1A were able to downregulate the long promoter to one-fourth of the basal expression level (Figure 7D). This shows that transcription regulation by STOX1 is modulated by the epige-netic context at least for some genes.
Physiological Consequences of Gene Deregulations in Cells Overexpressing STOX1A or STOX1B
After this genomic search for STOX1 binding sites and evaluation of their direct impact on gene expression, we explored the physiological consequences of the imbalance of the two isoforms, STOX1A and STOX1B. The three fields that were explored are (1) cell membrane repair in trophoblasts, (2) regulation of tropho-blast fusion into syncytiotrophotropho-blast, and (3) deregulation of oxidative/nitrosative stress.
Membrane Repair and STOX1 Expression
Annexins are pivotal to mechanisms of membrane repair (Boye and Nylandsted, 2016). Annexin A1 was one of the most downregulated genes by both STOX isoforms in the microarray experiment (Figure 5A). This downregulation was confirmed at the protein level (Figure 8A). Previously it was shown that classical In the 100 Most Downregulated with STRE1 In the 100 Most Downregulated with STRE2
A vs C B vs C A-FSK versus C-FSK
B-FSK versus C-FSK
A versus C B versus C A-FSK versus C-FSK B-FSK versus C-FSK BRWD1 31.83 34.79 76.89 56.89 FSTL3 50.93 17 42.36 4.96 TFRC 17.99 2.98 79.5 2.54 CAPN6 41.84 34.7 76.73 123.56 HMGN1 17.06 13.13 13.19 12.45 KRT7 23.67 2.56 64 9.71 PSMG1 13.77 13.31 217.86 95.26 HMGN1 17.06 13.1 13.19 12.45 MDM2 10.49 3.35 12.3 3.24 TNFSF10 16.07 4.34 2273.24 11.68 C19orf43 5.33 2.14 6.92 2.76 EGFR 11.3 5.22 11.02 6.83 PLEC 5.29 1.98 5.11 3.7 TGM2 10.78 7.99 6.4 6.72 DYNLL1 5.06 1.74 7.29 3.3 ATG7 6.26 2.91 11.17 3.93 ELF4 2.79 1.78 8.57 3.46 ITIH5 5.12 4.63 8.58 5.39 NT5DC3 2.7 1.91 4.42 2.92 CAV1 3.74 7.49 110.91 22.48 SLC6A8 2.43 1.94 26.12 2.74
ll
BeWo cells were perfectly able to repair their plasmic membrane following a laser-induced lesion and that annexins and especially Annexin A5 is requested for this fundamental process (Carmeille et al., 2015). We first explored the capabilities of membrane repair in JEG-3 cells. The monitoring of the rupture and membrane repair was carried out by recording FM1-43 fluorescence images, as previously described (Bouter et al., 2011; Carmeille et al., 2017). When the cell repairs its membrane, the fluorescence stagnates, as represented for BeWo cells in curves ofFigure 8F. Unexpectedly, we discovered that JEG-3 cells were totally unable to repair their membranes and showed a continuous and large increase of the intracellular fluorescence intensity (Figures 8B and 8F; JEG3A and JEG3C). This deficiency in membrane repair was in-dependent from STOX1A overexpression, which was about 20-fold the basal level in JEG3A cells, while JEG3C cells are controls (Figure 8F).
BeWoC cells present membrane repair ability as native BeWo cells, as shown inFigures 8C, 8F, and 8G. However, when STOX1A or STOX1B are overexpressed, the repair does not occur anymore (Figures 8D, 8E, and 8G). A closer look shows that intracellular vesicles do appear nearby the damaged membrane but are not able to patch it, leading to the leak of intracellular material (Figure 8H). This result is in agreement with the role proposed for Annexin A1, which may aggregate intracellular vesicles to form the lipid patch (Lennon et al., 2003).
Regulation of Trophoblast Fusion by STOX1 Isoforms
Syncytialization is a major developmental pathway for villous trophoblasts. Placental-specific fusogen genes (syncytins) were identified in all the species presenting a placenta and are crucial for trophoblast
Figure 5. Identification of Common Binding Sites in the 10 Genes Most Strongly Downregulated by Both STOX1A and B in BeWo Cells, with or without Induction of Fusion by Forskolin
(A) The 10 genes were identified from the microarray analysis by screening for profiles similar to ANXA1.
(B) MEME analysis of the 10 promoter regions (~5,000 bp) revealed common motifs in nine of them. The two most significantly enriched motifs were generally found in common (light blue and red).
(C) A biotinylated probe was synthetized for gel-shift experiments. A STRE2 element was found in the red part of the motif and is underlined in purple.
Figure 6. DNA-Protein Interactions at the Promoters of Genes Down-regulated by either form of STOX1
Gel shift experiments using the probe described inFigure 7in two models: HeLa cells transiently transfected with STOX1A or B and BeWo cell models used in the present study. In both cases, two complexes of similar molecular weight appeared. The first complex was removed exclusively by competition with excess STRE2, but STRE1 was unable to remove it. The second complex was removed nonspecifically whatever the competitor used. Thus, complex 1 is bound by a protein binding to STRE2. The absence of difference visible between the BeWoA, B, and C shows that this protein is not related to STOX1 (see text).
Figure 7. Analysis of HMGN1 Expression in Cells and Placentas
(A) The induction ratio was calculated from qRT-PCR: left panel, for JEG-3 cell lines overexpressing STOX1A (JEG-3A) or STOX1B (JEG-3B) relative to control cells (JEG-3C); middle panel, the same analysis for mouse placentas; right panel, the same analysis for human placentas, showing a significant decrease of HMGN1 expression in human preeclamptic placentas (see text).
(B) A CpG island is located in the promoter and first exon of HMGN1, as shown by the CpG density presented in the graph; below are the structure of the part of the HMGN1 promoter that was partially cloned in a Dual-Glo luciferase reporter vector. Two versions of the promoter (short = 831 bp and long = 2,192 bp) were amplified encompassing one STRE2 and one STRE1 binding element separated by 70 bp. The density in CG dinucleotide was evaluated by counting windows of
ll
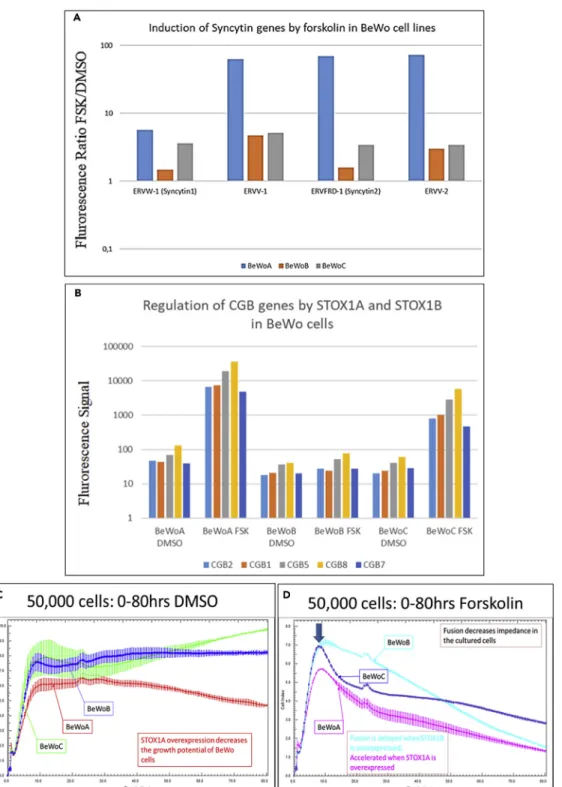
fusion (Cornelis et al., 2015, 2017). Besides, one of the major functions of the fused trophoblast is the pro-duction of pregnancy-specific hormones, in particular hCG, a dipeptide obtained from the transcription of the CGA and CGB genes. There may exist links between membrane repair and cell fusion mechanisms (Omata et al., 2013). All these elements prompted us to study the relevant fusogen gene expression in the context of the cell trophoblast model. In control BeWoC cells, we observed that, as expected, forskolin treatment massively increases the expression of Syncytin 1 and 2 (ERVW-1- x 3.59-fold and ERVFRD1– x 3.19-fold) (Figure 9A). Besides, ERVV1 and ERVV2 were induced as well (x 5.15- and x 3.61-fold). Strikingly, the induction level was much higher in BeWoA cells (5.7-, 62.9-, 69.5-, and 72.7-fold, for ERVW1-Syncytin1, ERVV1, ERVFRD1-Syncytin2, and ERVV2, respectively) than in control BeWoC cells. By contrast, the induc-tion in BeWoB cells amounted only to 1.5, 4.7, 1.6, and 3.0, for the four genes, respectively.
Trophoblast fusion is associated to induction of the CGB gene family located as a cluster on chromosome 19, encompassing in this order—CGB3, CGB2, CGB1, CGB5, CGB8, and CGB7 (Morrish et al., 1998; Pidoux et al., 2012). The expression levels of five of these genes are summarized inFigure 9B, in the three BeWo cell lines that were generated. Strikingly, although the basal level of expression was similar in the three cell lines, their induction following forskolin treatment was ~100-fold in BeWoA cells and around 50-fold in BeWoC cells but did not change significantly in BeWoB cells.
The cell fusion was evaluated by immunofluorescence of beta-catenin after forskolin treatment. Classical count-ing analyzcount-ing 10–20 fields in three independent experiments is summarized inFigure S3. Compared with control cells, the fusion index was significantly increased in BeWoA (p = 6.2 10 3) but not statistically decreased in
Be-WoB cells despite a systematic trend in all the experiments (p = 0.071). To automatize the quantification of the fusion we used the xCELLIGENCE system, which measures in real time the impedance in each well of a 96-well e-plate. The results indicate that BeWoA cells have a retarded growth when they are in culture (Figure 9C). We observed that forskolin treatment induces a reduction of the impedance (from which a cell index is calculated, seeFigure 9D), associated with the increase in cell fusion observed by conventional methods. When fusion is induced by forskolin, BeWoC cells start to fuse after 9 h in culture; the decrease of impedance is accelerated in BeWoA and delayed in BeWoB cells, consistently with a decreased fusion efficiency in BeWoB cells. Our re-sults suggest that STOX1A and STOX1B have opposite effects on cell fusion and differentiation (CGB gene expression). STOX1A accelerates and amplifies the fusion of the villous trophoblast into syncytiotrophoblast, whereas STOX1B limits or slows down this process.
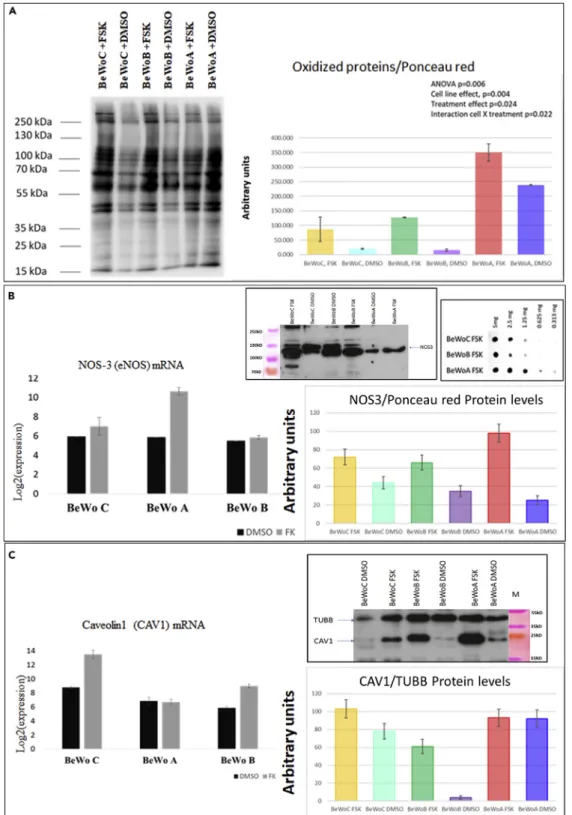
Deregulation of Oxidative/Nitrosative Stress
Oxidative stress is a major component of placental diseases (for a recent review, see for instance (Aouache et al., 2018)). Along with the observation reported above that STOX1 induces massive alterations of hypoxia sensing (Doridot et al., 2014), which is a major issue in the generation of oxidative stress, this prompted us to analyze the regulation of oxidative/nitrosative stress features in the BeWo cell models, under forskolin treatment or control treatment (DMSO vehicle).
In a first analysis, we evaluated the level of carbonylated proteins, which measures protein oxidation (a clas-sical proxy of oxidative stress,Figure 10A). In basal conditions, the level of protein carbonylation (normal-ized relatively to b-tubulin) was similar between control BeWoC and BeWoB, whereas the basal level of carbonylation was about 3-fold higher when STOX1A was overexpressed. In BeWoC and BeWoB, forskolin treatment induced an increase in carbonylation of about 5- to 8-fold, whereas carbonylation increased ~1.5-fold in forskolin-treated BeWoA cells.
Because oxidative stress is the basis of nitrosative stress when NO is present (from arginine being changed to citrulline + NO by nitric oxide synthase), we analyzed the expression of the inducible nitric oxide Figure 7. Continued
10 bp and the representation is smoothed on five consecutive densities. The positions of the ATG initiation codon and the two STRE binding sites are relative to the figure.
(C) ChIP qPCR analysis of STOX1A able to bind directly to the HMGN1 promoter and to the F3 promoter.
(D) Two versions (long and short, of 2,192 and 831 bp, respectively) of the HMGN1 promoter were cloned in a luciferase reporter plasmid, and luciferase activity was measured after co-transfection with an expression plasmid (empty [pCMX] or overexpressing STOX1B or A). Data are mean G SEM from three experiments. Tested by student t tests compared with control conditions in A, or ANOVA 1-factor followed by Dunnett post-hoc test for C and D. *p < 0.05, **p < 0.01, ***p < 0.001.
ll
synthase, NOS3. In DMSO-treated cells, BeWoA cells presented a ~45% reduced level of the NOS3 protein compared with control BeWoC cells, whereas the mRNA level was unchanged (Figure 10B). When the cells were induced to fuse, the increase in NOS3 mRNA was around 30-fold in BeWoA cells exclusively, and this translated into a 4-fold induction of the protein in forskolin-treated cells. In BeWoB and BeWoC cells, the NOS3 level was also increased following treatment with forskolin but only by ~2-fold. Therefore, in BeWoA cells, forskolin treatment tended to alleviate the oxidative stress increase but to increase NOS3 level. We evaluated the level of nitrosylated proteins in the forskolin-stimulated cells by dot-blot with serial dilutions (Figure 10B, box right), and consistently, the level of nitrosylation was 2- to 3-fold more elevated in BeWoA than in the two other cell lines.
Overall, these results are different to what we previously described in JEG-3 cells overexpressing STOX1A, where we found a decrease in nitrosative stress at atmospheric O2pressure, 20% (Doridot et al., 2014).
However, at 2% O2, the nitrosative stress was increased. This suggests that when STOX1A is overexpressed,
BeWo cells at atmospheric oxygen pressure resemble JEG-3 cells in hypoxia in terms of nitrosative stress. In addition, we studied the level of caveolin 1 in the BeWo cell lines, because this protein is known to pro-tect against oxidative stress, hypoxia, and inflammation (Pavlides et al., 2010; Shiroto et al., 2014). In base-line conditions, overexpression of STOX1B led to a very low protein level, whereas this level was similar in BeWoA and BeWoC cells (Figure 10C). When cells were treated with forskolin, the CAV1 mRNA level was increased in BeWoC and BeWoB but not in BeWoA, whereas the protein level appeared similar in the three cell lines (Figure 10C). This suggests that before fusion, BeWoB cells lack caveolin. Caveolin1 has also been reported to play an important role in cytotrophoblast fusion (Rashid-Doubell et al., 2007). The very low level of this factor in BeWoB cells may suggest an impairment of their capability to fuse, consistently with the observation of altered cell fusion in BeWoB cells.
In sum, our results indicate (1) that STOX1A overexpression leads to different effects on oxidative and nitro-sative stresses and (2) that the balance between STOX1A and STOX1B is major for understanding the mode of action of STOX1 in terms of oxidative stress.
DISCUSSION
We previously showed that STOX1A overexpression in the JEG-3 extravillous trophoblast cell model, leads to an expression profile that mimics that of preeclampsia and induces preeclampsia and intrauterine growth restric-tion in mouse transgenic models (Collinot et al., 2018; Doridot et al., 2013;Ducat et al., 2016). Trophoblast cell lines overexpressing STOX1 isoforms could therefore be a useful scientific resource to understand some of the cellular and molecular grounds of placental diseases. STOX1 was first described as a transcription factor, of which specific variants predispose to preeclampsia (van Dijk et al., 2005). The gene is encountered under two major isoforms, STOX1A (989 amino acids) and STOX1B (227 amino acids), which share the same DNA binding site(s). The two isoforms differ by the existence of a transactivating domain exclusive to STOX1A, and shuttling nucleus-cytoplasm signals (NLS and NES), whereas STOX1B encompasses only an NLS together with the DNA-binding domain. The DNA-binding site of STOX1 was not described before the present study. Herein, we identified by PCR-selection two putative regulatory DNA elements (STRE1 and STRE2), one of which (STRE1) is specifically Figure 8. Analysis of Membrane Repair in Trophoblast Cells Overexpressing either Isoform of STOX1
(A) Western blot analysis of six annexins and quantification (left). Data are mean G SEM from three experiments. Video microscopy analysis of FM1-43 kinetics entering the cell from the point of laser-generated injury.
(B) Fluorophore entry kinetics in JEG-3 EVTs. Quantification is presented inFigure 7F where JEG-3C cells are JEG-3 cells stably transfected with a geneticin resistance plasmid and JEG-3A cells stably overexpress STOX1A. In these cells, the membrane repair does not occur whatever the level of STOX1A.
(C) BeWoC cells kinetic of membrane repair (BeWo cells stably expressing the geneticin resistance gene), quantified in
Figures 8F and 8G.
(D and E) (D) BeWoA cells (with overexpression of STOX1A) kinetic of membrane repair and (E) BeWo cells
(overexpressing STOX1B). (F and G) quantification of the intracellular fluorescence in trophoblast cells; JEG3C are control JEG-3 trophoblast cells, JEG3A are JEG-3 cells overexpressing STOX1A. BeWo and BeWoC are control BeWo cells, while BeWoA and BeWoB overexpress STOX1A and STOX1B, respectively.
(H) Video microscopy of the fluorescence entry in BeWoA cells, as an example (similar images were obtained with BeWoB cells). At 6.5 and 7.8 s post-injury, the blue arrows show the extrusion of cytoplasmic material. At 52 s, intracellular vesicles are formed but are not able to fuse and not able to patch the cell membrane. Scale bar: 20 mm for figures B–E, 5 mm for Figure (H). In all the figures, the lesion point is indicated by the white arrow.
Figure 9. Altered Fusion Consequences and Molecular Mechanisms with Overexpression of STOX1 Isoforms
(A) Syncytin gene deregulations. In BeWoA, B, and C cells (blue, orange, and gray boxes, respectively), the ratio between the mRNA levels of these genes under forskolin treatment relative to control treatment (DMSO) is shown (results presented following a logarithmic scale).
(B–D) (B) Expression of the genes encoding the beta chain of the hCG under fusion induced by forskolin treatment in BeWoA, BeWoB, and BeWoC cells. xCELLigence analysis of the impedance of the different BeWo cell lines without (C) and with (D) forskolin treatment. Error bars at each measure (every 15 min) are from the analysis of triplicates. Under forskolin treatment the fusion starts after 9 h of culture (blue arrow). Data (C and D) are mean G SEM from three experiments.
ll
Figure 10. Analysis of the Modulation of Oxidative/Nitrosative Stress Markers in BeWo Cells Overexpressing STOX1 Isoforms
(A) Western blot analysis of the impact of oxidative stress (carbonylated proteins) in BeWo cells stably transfected to overexpress STOX1A (BeWoA) or STOX1B (BeWoB) and control cells (BeWoC), with or without syncytialization induction by forskolin (FSK) treatment. Quantification relative to tubulin B level, as described in (Doridot et al., 2014).
bound by STOX1. We surmise that STRE2 can bind a cofactor of STOX1, thus allowing STOX1 to perform its ac-tion; identifying this factor is the subject of ongoing studies. We also generated complementary cell models sta-bly overexpressing either of STOX1 variants in the BeWo villous cytotrophoblast. These tools allowed us to attempt elucidating how STOX1 intervenes to modulate gene expression. The core STRE1+STRE2 was signifi-cantly induced by STOX1A but not by STOX1B in cell transfection experiments. The level of induction was rela-tively low, suggesting that in actual cellular conditions, the environment of the sites is crucial to enhance the ef-fect of STOX isoforms on promoters. This could possibly be linked to local DNA methylation levels, as seen for STOX1-mediated regulation of the HMGN1 promoter.
Besides, we found that in cells, some genes such as ANXA1 or HMGN1, are downregulated by both isoforms of STOX1 in BeWo cells, whereas others such as those involved in sycncytialisation (Syncytins, CGB) were upregu-lated by STOX1A and downreguupregu-lated by STOX1B, when the fusion was activated by forskolin treatment. Some other genes, such as those involved in oxidative/nitrosative stress regulations, were generally modified essen-tially following STOX1A overexpression, toward the overproduction of ROS and RNS. The downregulation of ANXA1 is a logical culprit for interpreting the failure of membrane repair observed in BeWoA and BeWoB cells. It is known from the analysis of muscle cells that AnnexinA1 is a crucial component of the membrane repair ma-chinery (Lennon et al., 2003). Our results strongly suggest that STOX1A or STOX1B overexpression leads to a virtual invalidation of the ANXA1 gene and completely prevents membrane repair in BeWo cells. In terms of trophoblast physiology, the fact that only the villous cell line was able to repair their membranes is consistent with the fact that villous cells differentiate into syncytiotrophoblast that are exposed directly to the blood flow and need presumably to be reparable for an optimal placental function. To this respect, JEG-3 cells behave probably more like extravillous trophoblasts that proliferate, suggesting that the absence of membrane repair that could lead to cell death is less important in this type of cells.
In sum, although downregulation of STOX1 does not affect strongly gene expression in the placental cells, imbalance between the two isoforms of STOX1 (generated by selective overexpression of each) leads to hindrances of pathways that are vital for not only trophoblast/placental function, such as membrane repair, cell-cell fusion, a major issue in placental physiology in mammalian and even non-mammalian viviparous placental species (Cornelis et al., 2015, 2017; Dupressoir et al., 2005), but also the management of mole-cules involved in oxidative/nitrosative stress. This oxidative-nitrosative stress balance is a major issue in the pathogenesis of preeclampsia (Amaral et al., 2013; Aouache et al., 2018; Saenen et al., 2017; Taysi et al., 2019). This observation could suggest that if an invalidation experiment of STOX1 in mice was carried out, no strong placental phenotype would be expected. However, introducing either STOX1A or STOX1B in this genetic background could have devastating effects on placental function, consistently with the over-expression of STOX1A in mice that induced preeclamptic symptoms (Doridot et al., 2013).
Overall, our present observations substantiate a previous hypothesis that we proposed (Vaiman and Mir-alles, 2016), envisaging that the imbalance between the two STOX1 major isoforms is a driving force toward abnormal placental function.
In 2011, van Abel and coworkers performed a ChIP-seq experiment using a human neuroblastoma cell line (SK-N-SH) overexpressing STOX1A, which made it possible to identifying STOX1 targets (van Abel et al., 2011). Among those, 76 were in the vicinity of genes that could be compared with the BeWo and JEG microarrays that we performed herein and in previous experiments. Analyzing by c2 the proportion of deregulated genes from our own microarray data, we did not find significant expression biases in the genes nearby the sequences enriched during the ChIP-seq experiment (data not shown). Therefore, either the binding had no statistically detectable influence on the gene expression (concerning a too limited number of direct targets of STOX pro-teins) or the binding/gene expression regulation is quite different according to the cell model that was used. Our results also demonstrate that STOX1 acts pleiotropically on the trophoblast wellbeing, through a harmonious balance between its two DNA-binding isoforms. Recently, we showed that alternative splicing Figure 10. Continued
(B) Quantification by qRT-PCR (left) and Western blot analysis (right) of eNOS normalized by protein content (evaluated at 20 mg per lane before the loading by Bradford test, n = 3). In the more extreme frame is represented the global level of nitrosylated proteins evaluated by dot-blot serial dilution analysis for BeWo cells treated with Forskolin.
(C) Caveolin content analyzed as eNOS content. Data on WB quantification and on qRT-PCR graphs are mean G SEM from three experiments.
ll
of STOX1 occurs differently in preeclamptic versus control placentas samples (Figure S1), suggesting that the balance between the two STOX1 isoform could indeed be a relevant mechanism of placental patho-genesis. Intuitively, when two isoforms of the same transcription factor share the same DNA-binding domain, the existence of a competition between them can be expected. Such regulation has rarely been described but has been previously documented for FOXJ2 (Perez-Sanchez et al., 2000). Similarly, the chromodomain helicase CHD7 presents a transcript variant that has opposite regulatory effects through binding SOX2 in the nucleoplasm, the long isoform (CHD7L) promoting SOX2-mediated transcriptional regulation while the short isoform (CHD7S) suppressing it (Kita et al., 2012).
One of the limits of our models is the use of choriocarcinoma, which may differ from primary cells. However, these cells are widely used to modelize placental cells, and this is supported by a very abundant literature, with results generally very relevant for understanding actual placental function. Another putative limit is the fact that we tilt the balance between STOX1A and STOX1B through overexpression of each isoform, rather than selective suppression of one of them. This solution is nevertheless handier and closer to the actual in vivo situation, than to eliminate selectively each isoform; the overexpression that we detect is ~5–~20 times above the basal level, a concentration that will improbably lead to non-specific binding to promoter elements. Indeed, compared with a ubiquitous factor such as RNAPol2, the basal expression level of STOX1 is ~58-fold inferior (microarray data).
Recently, the idea of reproducing the feto-maternal interface was envisaged with cell models of co-culture of JEG-3, BeWo, and syncytialized BeWo cells together with the adrenal H295R cell line (Drwal et al., 2018). Mimicking the normal interface is interesting, but in the future, using our cell models we could be able to model this interface in a disease state, such as preeclampsia. By STOX1 overexpression, we mimic the status of VCT and EVT cells in preeclampsia. Future effort, fostering on our results on STOX1-induced modification of trophoblast function, could therefore be endeavored to provide a cell-based model of the preeclamptic placenta. Also, recent studies mentioned the possibility of generating organoı¨ds from trophoblasts (Turco et al., 2018). In this model, transfection of STOX1A or STOX1B using a lentivirus could help to better understand the action of this factor in the context of the preeclamptic disease, in a model closer to actual placental tissue.
Limitations of the Study
This study is based upon cell models, essentially on BeWo cells, which are a good model of villous tropho-blast, but still only a model. Although they are very useful to explore mechanistical questions, the behavior of primary trophoblast cells they represent is not completely accurate and even less that of the whole placenta, which includes a high proportion of mesenchymal end endothelial, as well as immunologic cells. Another limit is the luciferase assays that could be carried out on additional cell lines to see the generality of the behavior that we observed. Thirdly, the results on HMGN1 indicate that genome methylation could play an important role in modulating STOX1 response. This could be studied thoroughly at the genome level using methylation arrays such as EPIC (Illumina) to obtain a more comprehensive vision of gene regulation by STOX1. The same remarks could be done for the study of the chromatin status that could be approached thoroughly by ChiP-seq, an issue that was beyond the scope of the present study.
METHODS
All methods can be found in the accompanyingTransparent Methods supplemental file.
DATA AND CODE AVAILABILITY
The BeWo array was deposited at GEO profiles under the accession number GSE148088. If readers wish to have access to the modified cells presented here, they can contact the authors that will share their material.
SUPPLEMENTAL INFORMATION
Supplemental Information can be found online athttps://doi.org/10.1016/j.isci.2020.101086.
ACKNOWLEDGMENTS
The authors thank the team of the Genom’IC platform of the Cochin Institute, especially Ange´line Duche, and Franck Letourneur for the quality or their services. This work was funded by the recurrent dotation of Inserm/CNRS/University attributed to the teams. Funding of AD PhD was through the Paris-Descartes
doctoral school. The PhD projects of CRSM and CA is funded by the European Union’s Horizon 2020 research and innovation programme under Marie Skłodowska-Curie Actions Innovative Training Network (H2020-MSCA-ITN 2017), Grant No. 765274, acronym iPLACENTA (http://www.iplacenta.eu). PL had his salary paid by BIOPAS Laboratories for working in projects different to that described in the present manu-script. Christel Poujol and Se´bastien Marais are acknowledged for the help in membrane repair assays that were done in the Bordeaux Imaging Center, a service unit of the CNRS-INSERM and Bordeaux University, member of the national infrastructure France BioImaging supported by the French National Research Agency (ANR-10-INBS-04).
AUTHOR CONTRIBUTIONS
AD, BC, LD, IG, AJ, and DV were the main actors of the identification of the STOX1 binding site and of the generation of the BeWoA, B, and C cell lines. RNA extractions and RT-qPCR were performed by RA, LB, and DV. Knock-down of STOX1 was carried out by DV. Luciferase assays were performed by SP, YC, and AV. Western blot analysis was carried out by LB and RA. Gel-shift assays were the work of AD, IG, AJ, and DV. The membrane repair analysis was carried out by AB and LF. The fusion analysis of the BeWo cells was performed by MBC and PR. The mouse placentas, transgenic or not, were provided from BP and JLV. Methylation analyses were performed by JT and FB. Transcriptome assays were carried out by SJ. Monitoring of proliferation by xCELLigence was carried out by CA. Bioinformatics analysis was supervised by DV and carried out by FM, with the help of JC and CRSM. The drafting of the paper was carried out by DV, CM, PL, JC, and DV. The project was managed by DV.
DECLARATION OF INTERESTS
None. Received: November 5, 2019 Revised: March 16, 2020 Accepted: April 15, 2020 Published: May 22, 2020 REFERENCESAbel, D., Abdul-Hamid, O., Dijk, M., and Oudejans, C.B. (2012). Transcription factor STOX1A promotes mitotic entry by binding to the CCNB1 promotor. PLoS One 7, e29769.
Amaral, L.M., Pinheiro, L.C., Guimaraes, D.A., Palei, A.C., Sertorio, J.T., Portella, R.L., and Tanus-Santos, J.E. (2013). Antihypertensive effects of inducible nitric oxide synthase inhibition in experimental pre-eclampsia. J.Cell. Mol. Med. 17, 1300–1307.
Aouache, R., Biquard, L., Vaiman, D., and Miralles, F. (2018). Oxidative stress in
preeclampsia and placental diseases. Int. J. Mol. Sci. 19, 1496.
Azar, C., Valentine, M., Trausch-Azar, J., Druley, T., Nelson, D.M., and Schwartz, A.L. (2018). RNA-Seq identifies genes whose proteins are transformative in the differentiation of cytotrophoblast to syncytiotrophoblast, in human primary villous and BeWo trophoblasts. Sci. Rep. 8, 5142.
Bailey, T.L., Boden, M., Buske, F.A., Frith, M., Grant, C.E., Clementi, L., Ren, J., Li, W.W., and Noble, W.S. (2009). MEME SUITE: tools for motif discovery and searching. Nucleic Acids Res. 37, W202–W208.
Bouter, A., Gounou, C., Berat, R., Tan, S., Gallois, B., Granier, T., d’Estaintot, B.L., Poschl, E., Brachvogel, B., and Brisson, A.R. (2011). Annexin-A5 assembled into two-dimensional arrays
promotes cell membrane repair. Nat. Commun. 2, 270.
Boye, T.L., and Nylandsted, J. (2016). Annexins in plasma membrane repair. Biol. Chem. 397, 961–969.
Carbillon, L., Challier, J.C., Alouini, S., Uzan, M., and Uzan, S. (2001). Uteroplacental circulation development: Doppler assessment and clinical importance. Placenta 22, 795–799.
Carmeille, R., Degrelle, S.A., Plawinski, L., Bouvet, F., Gounou, C., Evain-Brion, D., Brisson, A.R., and Bouter, A. (2015). Annexin-A5 promotes membrane resealing in human trophoblasts. Biochim.Biophys. Acta 1853, 2033–2044.
Carmeille, R., Croissant, C., Bouvet, F., and Bouter, A. (2017). Membrane repair assay for human skeletal muscle cells. Methods Mol. Biol. 1668, 195–207.
Chen, J.Z., Sheehan, P.M., Brennecke, S.P., and Keogh, R.J. (2012). Vessel remodelling, pregnancy hormones and extravillous trophoblast function. Mol.Cell.Endocrinol. 349, 138–144.
Chirn, G.W., Rahman, R., Sytnikova, Y.A., Matts, J.A., Zeng, M., Gerlach, D., Yu, M., Berger, B., Naramura, M., Kile, B.T., et al. (2015). Conserved piRNA expression from a distinct Set of piRNA cluster Loci in eutherian mammals. PLoS Genet. 11, e1005652.
Collinot, H., Marchiol, C., Lagoutte, I., Lager, F., Siauve, N., Autret, G., Balvay, D., Renault, G., Salomon, L.J., and Vaiman, D. (2018).
Preeclampsia induced by STOX1 overexpression in mice induces intrauterine growth restriction, abnormal ultrasonography and BOLD MRI signatures. J. Hypertens. 36, 1399–1406.
Cornelis, G., Vernochet, C., Carradec, Q., Souquere, S., Mulot, B., Catzeflis, F., Nilsson, M.A., Menzies, B.R., Renfree, M.B., Pierron, G., et al. (2015). Retroviral envelope gene captures and syncytin exaptation for placentation in marsupials. Proc. Natl. Acad. Sci. U S A 112, E487– E496.
Cornelis, G., Funk, M., Vernochet, C., Leal, F., Tarazona, O.A., Meurice, G., Heidmann, O., Dupressoir, A., Miralles, A., Ramirez-Pinilla, M.P., et al. (2017). An endogenous retroviral envelope syncytin and its cognate receptor identified in the viviparous placental Mabuya lizard. Proc. Natl. Acad. Sci. U S A 114, E10991–E11000.
Doridot, L., Passet, B., Mehats, C., Rigourd, V., Barbaux, S., Ducat, A., Mondon, F., Vilotte, M., Castille, J., Breuiller-Fouche, M., et al. (2013). Preeclampsia-like symptoms induced in mice by fetoplacental expression of STOX1 are reversed by aspirin treatment. Hypertension 61, 662–668.
Doridot, L., Chatre, L., Ducat, A., Vilotte, J.L., Lombes, A., Mehats, C., Barbaux, S., Calicchio, R., Ricchetti, M., and Vaiman, D. (2014). Nitroso-redox balance and mitochondrial homeostasis
ll
are regulated by STOX1, a pre-eclampsia-associated gene. Antioxid.Redox Signal. 21, 819–834.
Drwal, E., Rak, A., and Gregoraszczuk, E. (2018). Co-culture of JEG-3, BeWo and syncBeWo cell lines with adrenal H295R cell line: an alternative model for examining endocrine and metabolic properties of the fetoplacental unit. Cytotechnology 70, 285–297.
Ducat, A., Doridot, L., Calicchio, R., Mehats, C., Vilotte, J.L., Castille, J., Barbaux, S., Couderc, B., Jacques, S., Letourneur, F., et al. (2016). Endothelial cell dysfunction and cardiac hypertrophy in the STOX1 model of preeclampsia. Sci. Rep. 6, 19196.
Dupressoir, A., Marceau, G., Vernochet, C., Benit, L., Kanellopoulos, C., Sapin, V., and Heidmann, T. (2005). Syncytin-A and syncytin-B, two fusogenic placenta-specific murine envelope genes of retroviral origin conserved in Muridae. Proc. Natl. Acad. Sci. U S A 102, 725–730.
Joubert, B.R., Felix, J.F., Yousefi, P., Bakulski, K.M., Just, A.C., Breton, C., Reese, S.E., Markunas, C.A., Richmond, R.C., Xu, C.J., et al. (2016). DNA methylation in newborns and maternal smoking in pregnancy: genome-wide consortium meta-analysis. Am. J. Hum.Genet. 98, 680–696.
Kita, Y., Nishiyama, M., and Nakayama, K.I. (2012). Identification of CHD7S as a novel splicing variant of CHD7 with functions similar and antagonistic to those of the full-length CHD7L. Genes Cells 17, 536–547.
Lennon, N.J., Kho, A., Bacskai, B.J., Perlmutter, S.L., Hyman, B.T., and Brown, R.H., Jr. (2003). Dysferlin interacts with annexins A1 and A2 and mediates sarcolemmal wound-healing. J. Biol. Chem. 278, 50466–50473.
Mallet, F., Bouton, O., Prudhomme, S., Cheynet, V., Oriol, G., Bonnaud, B., Lucotte, G., Duret, L., and Mandrand, B. (2004). The endogenous retroviral locus ERVWE1 is a bona fide gene involved in hominoid placental physiology. Proc. Natl. Acad. Sci. U S A 101, 1731–1736.
Morrish, D.W., Dakour, J., and Li, H. (1998). Functional regulation of human trophoblast differentiation. J. Reprod.Immunol. 39, 179–195.
Nie, X., Zhang, K., Wang, L., Ou, G., Zhu, H., and Gao, W.Q. (2015). Transcription factor STOX1 regulates proliferation of inner ear epithelial cells via the AKT pathway. Cell Prolif. 48, 209–220.
Omata, W., Ackerman, W.E.t., Vandre, D.D., and Robinson, J.M. (2013). Trophoblast cell fusion and differentiation are mediated by both the protein kinase C and a pathways. PLoS One 8, e81003.
Orendi, K., Gauster, M., Moser, G., Meiri, H., and Huppertz, B. (2010). Effects of vitamins C and E, acetylsalicylic acid and heparin on fusion, beta-hCG and PP13 expression in BeWo cells. Placenta 31, 431–438.
Pantham, P., Rosario, R., Chen, Q., Print, C.G., and Chamley, L.W. (2012). Transcriptomic analysis of placenta affected by antiphospholipid
antibodies: following the TRAIL of trophoblast death. J. Reprod.Immunol. 94, 151–154.
Pavlides, S., Tsirigos, A., Vera, I., Flomenberg, N., Frank, P.G., Casimiro, M.C., Wang, C., Fortina, P., Addya, S., Pestell, R.G., et al. (2010). Loss of stromal caveolin-1 leads to oxidative stress, mimics hypoxia and drives inflammation in the tumor microenvironment, conferring the "reverse Warburg effect": a transcriptional informatics analysis with validation. Cell Cycle 9, 2201–2219.
Perez-Sanchez, C., Gomez-Ferreria, M.A., de La Fuente, C.A., Granadino, B., Velasco, G., Esteban-Gamboa, A., and Rey-Campos, J. (2000). FHX, a novel fork head factor with a dual DNA binding specificity. J. Biol. Chem. 275, 12909– 12916.
Pidoux, G., Gerbaud, P., Cocquebert, M., Segond, N., Badet, J., Fournier, T.,
Guibourdenche, J., and Evain-Brion, D. (2012). Review: human trophoblast fusion and differentiation: lessons from trisomy 21 placenta. Placenta 33 (Suppl ), S81–S86.
Pollock, R.M. (20). Determination of protein-DNA sequence specificity by PCR-assisted binding-site selection. Curr. Protoc. Mol. Biol., Chapter 12, Unit 12 11.
Rashid-Doubell, F., Tannetta, D., Redman, C.W., Sargent, I.L., Boyd, C.A., and Linton, E.A. (2007). Caveolin-1 and lipid rafts in confluent BeWo trophoblasts: evidence for Rock-1 association with caveolin-1. Placenta 28, 139–151.
Rigourd, V., Chauvet, C., Chelbi, S.T., Rebourcet, R., Mondon, F., Letourneur, F., Mignot, T.M., Barbaux, S., and Vaiman, D. (2008). STOX1 overexpression in choriocarcinoma cells mimics transcriptional alterations observed in preeclamptic placentas. PLoS One 3, e3905.
Robinson, N.J., Baker, P.N., Jones, C.J., and Aplin, J.D. (2007). A role for tissue
transglutaminase in stabilization of membrane-cytoskeletal particles shed from the human placenta. Biol. Reprod. 77, 648–657.
Ruttkay-Nedecky, B., Nejdl, L., Gumulec, J., Zitka, O., Masarik, M., Eckschlager, T., Stiborova, M., Adam, V., and Kizek, R. (2013). The role of metallothionein in oxidative stress. Int. J. Mol. Sci. 14, 6044–6066.
Saenen, N.D., Vrijens, K., Janssen, B.G., Roels, H.A., Neven, K.Y., Vanden Berghe, W., Gyselaers, W., Vanpoucke, C., Lefebvre, W., De Boever, P., et al. (2017). Lower placental leptin promoter methylation in association with fine particulate matter air pollution during pregnancy and placental nitrosative stress at birth in the ENVIRONAGEcohort. Environ.Health Perspect. 125, 262–268.
Shankar, K., Kang, P., Zhong, Y., Borengasser, S.J., Wingfield, C., Saben, J., Gomez-Acevedo, H., and Thakali, K.M. (2015). Transcriptomic and epigenomic landscapes during cell fusion in BeWo trophoblast cells. Placenta 36, 1342–1351.
Shiroto, T., Romero, N., Sugiyama, T., Sartoretto, J.L., Kalwa, H., Yan, Z., Shimokawa, H., and Michel, T. (2014). Caveolin-1 is a critical
determinant of autophagy, metabolic switching, and oxidative stress in vascular endothelium. PLoS One 9, e87871.
Szklarczyk, D., Gable, A.L., Lyon, D., Junge, A., Wyder, S., Huerta-Cepas, J., Simonovic, M., Doncheva, N.T., Morris, J.H., Bork, P., et al. (2019). STRING v11: protein-protein association networks with increased coverage, supporting functional discovery in genome-wide experimental datasets. Nucleic Acids Res. 47, D607–D613.
Taysi, S., Tascan, A.S., Uuro, M.G., and Demir, M. (2019). Radicals, oxidative/nitrosative stress and preeclampsia. Mini Rev. Med. Chem. 19, 178–193.
Turco, M.Y., Gardner, L., Kay, R.G., Hamilton, R.S., Prater, M., Hollinshead, M.S., McWhinnie, A., Esposito, L., Fernando, R., Skelton, H., et al. (2018). Trophoblast organoids as a model for maternal-fetal interactions during human placentation. Nature 564, 263–267.
Tyberghein, K., Goossens, S., Haigh, J.J., van Roy, F., and van Hengel, J. (2012). Tissue-wide overexpression of alpha-T-catenin results in aberrant trophoblast invasion but does not cause embryonic mortality in mice. Placenta 33, 554–560.
Vaiman, D., and Miralles, F. (2016). Targeting STOX1 in the therapy of preeclampsia. Expert Opin.Ther. Targets 20, 1433–1443.
van Abel, D., Holzel, D.R., Jain, S., Lun, F.M., Zheng, Y.W., Chen, E.Z., Sun, H., Chiu, R.W., Lo, Y.M., van Dijk, M., et al. (2011). SFRS7-mediated splicing of tau exon 10 is directly regulated by STOX1A in glial cells. PLoS One 6, e21994.
van Abel, D., Abdulhamid, O., Scheper, W., van Dijk, M., and Oudejans, C.B. (2012a). STOX1A induces phosphorylation of tau proteins at epitopes hyperphosphorylated in Alzheimer’s disease. Neurosci.Lett. 528, 104–109.
van Abel, D., Michel, O., Veerhuis, R., Jacobs, M., van Dijk, M., and Oudejans, C.B. (2012b). Direct downregulation of CNTNAP2 by STOX1A is associated with Alzheimer’s disease. J. Alzheimers Dis. 31, 793–800.
van Dijk, M., Mulders, J., Poutsma, A., Konst, A.A., Lachmeijer, A.M., Dekker, G.A., Blankenstein, M.A., and Oudejans, C.B. (2005). Maternal segregation of the Dutch preeclampsia locus at 10q22 with a new member of the winged helix gene family. Nat. Genet. 37, 514–519.
van Dijk, M., van Bezu, J., van Abel, D., Dunk, C., Blankenstein, M.A., Oudejans, C.B., and Lye, S.J. (2010). The STOX1 genotype associated with pre-eclampsia leads to a reduction of trophoblast invasion by alpha-T-catenin upregulation. Hum. Mol. Genet. 19, 2658–2667.
Zhang, C., Ji, Z., Wang, M., Zhang, W., Yang, R., An, H., Yang, R., van Abel, D., van Dijk, M., Yang, X., et al. (2016). Stox1 as a novel transcriptional suppressor of Math1 during cerebellar granule neurogenesis and medulloblastoma formation. Cell Death Differ. 23, 2042–2053.
iScience, Volume 23
Supplemental Information
Molecular Mechanisms of Trophoblast
Dysfunction Mediated by Imbalance
between STOX1 Isoforms
Aurélien Ducat, Betty Couderc, Anthony Bouter, Louise Biquard, Rajaa Aouache, Bruno
Passet, Ludivine Doridot, Marie-Benoîte Cohen, Pascale Ribaux, Clara Apicella, Irène
Gaillard, Sophia Palfray, Yulian Chen, Alexandra Vargas, Amélie Julé, Léo Frelin, Julie
Cocquet, Camino Ruano San Martin, Sébastien Jacques, Florence Busato, Jorg
Tost, Céline Méhats, Paul Laissue, Jean-Luc Vilotte, Francisco Miralles, and Daniel Vaiman
Supplementary Figure S1, Structure of STOX1 major isoforms STOX1A and STOX1Bn
and splicing index in preeclampsia (PE) versus controls and in Intra-Uterine Growth
Restriction (IUGR) versus controls, Related to Figure 2b and paragraph 6 of the Discussion
in the main text. The p values were provided following TAC® Affymetrix software analysis
from ClariomD microarrays (manuscript in preparation)
STOX1B STOX1A
STOX1B STOX1A
11 PE vs 9 controls: Splicing index 1.36, p=0.0123
13 IUGR vs 8 controls: Splicing index 1.11, p=0.3262
2
Supplementary Figure S2, Luciferase constructions with normal and mutant STRE
elements (Related to Figure 1): upper part, presentation of the constructions encompassing
WT and mutant variants of STRE1 and STRE2. Lower part, luciferase assays analyzing the
constructions by transfections in JEG3 cells (related to Figure 1). Tested by Student T-tests
compared to control conditions ** p<0.01.
Supplementary Figure S3, Visual evaluation of cell fusion in BeWo cells overexpressing
either STOX1A or STOX1B (Related to Figure 9). P values were calculated by Student
4
Supplementary Table S1: qPCR oligonucleotides used in the study. Related to Figure 1.
Oligo name Sequence Bases
ANXA1.f GCG-GTG-AGC-CCC-TAT-CCT-A 19 ANXA1.r TGA-TGG-TTG-CTT-CAT-CCA-CAC 21 ANXA2.f TCT-ACT-GTT-CAC-GAA-ATC-CTG-TG 23 ANXA2.r AGT-ATA-GGC-TTT-GAC-AGA-CCC-AT 23 BRWD1.f CCA-GCG-CAT-CGG-TCC-TAT-G 19 BRWD1.r CTT-CCT-GCA-CCA-AGT-AAA-GAA-GT 23 CAPN6.f CAG-CAG-ACT-TTT-CTG-TGA-TCC-A 22 CAPN6.r GGG-GAC-GTT-TCC-ACA-CCA-C 19 GPR146.f GCA-AGG-CCA-GCA-TGA-CCA-T 19 GPR146.r GGA-CAC-ATT-GAA-GGG-GAT-CTG 21 HMGN1.f GCG-AAG-CCG-AAA-AAG-GCA-G 19 HMGN1.r TCC-GCA-GGT-AAG-TCT-TCT-TTA-GT 23 ITIH5.f CCT-ACT-GTA-GTA-CAA-CAA-GCC-AG 23 ITIH5.r TCC-CCA-ATG-CTC-TGT-TCT-CTA-TT 23 PSMG1.f TCC-TTT-CCT-GAG-AGC-CCT-AAA-A 22 PSMG1.r TGT-TCT-AGC-AAT-GGA-CAA-CAC-G 22 SEMA6A.f AAT-CAG-TAT-TTC-GCA-TGG-CAA-CT 23 SEMA6A.r GCA-ATG-TAG-AGG-GTT-CCG-TTC-A 22 TGM2.f CGT-GAC-CAA-CTA-CAA-CTC-GG 20 TGM2.r CAT-CCA-CGA-CTC-CAC-CCA-G 19 WRB.f TCC-ACA-GTC-AAC-ATG-ATG-GAC-G 22 WRB.r CTG-TCC-GAG-CTT-TCA-CAT-GGG 21 ERVFRD-1_(Syncytin1.f) ATG-GAG-CCC-AAG-ATG-CAG 18 ERVFRD-1_(Syncytin1.r) AGA-TCG-TGG-GCT-AGC-AG 17 ERVW-1_(Syncytin2.f) CCT-TCA-CTA-GCA-GCC-TAC-CG 20 ERVW-1_(Syncytin2.r) GCT-GTC-CCT-GGT-GTT-TCA-GT 20 CGA.f TGC-CCA-GAA-TGC-ACG-CTA-C 19 CGA.r TTG-GAC-CTT-AGT-GGA-GTG-GGA 21 NOS3.f TGA-TGG-CGA-AGC-GAG-TGA-AG 20 NOS3.r ACT-CAT-CCA-TAC-ACA-GGA-CCC 21 CAV1.f GCG-ACC-CTA-AAC-ACC-TCA-AC 20 CAV1.r ATG-CCG-TCA-AAA-CTG-TGT-GTC 21