Publisher’s version / Version de l'éditeur:
Archives of Biochemistry and Biophysics, 493, 2, pp. 234-241, 2010-01-15
READ THESE TERMS AND CONDITIONS CAREFULLY BEFORE USING THIS WEBSITE.
https://nrc-publications.canada.ca/eng/copyright
Vous avez des questions? Nous pouvons vous aider. Pour communiquer directement avec un auteur, consultez la
première page de la revue dans laquelle son article a été publié afin de trouver ses coordonnées. Si vous n’arrivez pas à les repérer, communiquez avec nous à PublicationsArchive-ArchivesPublications@nrc-cnrc.gc.ca.
Questions? Contact the NRC Publications Archive team at
PublicationsArchive-ArchivesPublications@nrc-cnrc.gc.ca. If you wish to email the authors directly, please see the first page of the publication for their contact information.
NRC Publications Archive
Archives des publications du CNRC
This publication could be one of several versions: author’s original, accepted manuscript or the publisher’s version. / La version de cette publication peut être l’une des suivantes : la version prépublication de l’auteur, la version acceptée du manuscrit ou la version de l’éditeur.
For the publisher’s version, please access the DOI link below./ Pour consulter la version de l’éditeur, utilisez le lien DOI ci-dessous.
https://doi.org/10.1016/j.abb.2009.11.003
Access and use of this website and the material on it are subject to the Terms and Conditions set forth at
Application of 19F magnetic resonance to study the efficacy of fluorine labeled drugs in the three-dimensional cultured breast cancer cells Bartusik, Dorota; Tomanek, Boguslaw
https://publications-cnrc.canada.ca/fra/droits
L’accès à ce site Web et l’utilisation de son contenu sont assujettis aux conditions présentées dans le site LISEZ CES CONDITIONS ATTENTIVEMENT AVANT D’UTILISER CE SITE WEB.
NRC Publications Record / Notice d'Archives des publications de CNRC: https://nrc-publications.canada.ca/eng/view/object/?id=2e5f4b15-4561-4c1f-9b5c-8d122a68827f https://publications-cnrc.canada.ca/fra/voir/objet/?id=2e5f4b15-4561-4c1f-9b5c-8d122a68827f
Application of
19F magnetic resonance to study the efficacy of fluorine labeled
drugs in the three-dimensional cultured breast cancer cells
Bartusik, Dorota; Tomanek, Boguslaw
Abstract
The cellular monitoring of tumor response to treatments is important for drug discovery and drug development in cancer therapy. We studied efficacy of Herceptin, a common breast cancer drug conjugated with a fluorine organic compound, perfluoro-15-crown-5-ether (PFCE) which easily forms biocompatible emulsions. Three new pharmaceutical forms of Herceptin, Herceptin/PFCE, Herceptin/PFCE/Lipoplex and Herceptin/PFCE/HydraLink were synthesized for the ex vivo study of their efficacy in breast cancer treatment. The emulsions were administered to
109 cells mL−1 of HER-2 positive human adenocarcinoma (MCF-7) cells and the same amount of human mammary epithelial cells (HMEC) cultured in three-dimensional (3D) geometry using hollow fiber bioreactor (HFB) device. Following drugs administration ex vivo, fluorine-19 magnetic resonance imaging (19F MRI) was applied for cells imaging to measure their viability and to study drug efficacy over 72 h. To ensure optimum drug tracking, HydraLink was used to provide stable binding affinity of emulsified Herceptin to receptor while cationic lipid
(Lipofectamine) was used to enhance lipophilicity of the emulsions.
After 72 h of treatment with Herceptin, Herceptin/PFCE, Herceptin/PFCE/Lipoplex and
Herceptin/PFCE/HydraLink the viability of cells was 54 ± 2%, 49 ± 3%, 43 ± 5% and 42 ± 1%, respectively, as compared with control 93 ± 2%. The efficacy (EC50) of Herceptin conjugated
with emulsions was found to be 970 ± 13 μg mL−1 for Herceptin/PFCE, 645 ± 11 μg mL−1 for Herceptin/PFCE/Lipoplex, 678 ± 7 μg mL−1 for Herceptin/PFCE/HydraLink and
1000 ± 3 μg mL−1 for Herceptin. The results show that fluorine emulsions improved the efficacy of Herceptin and 19F signal intensity changes validated drug efficiency. The significant
correlations between duration of treatments and MCF-7 cells viability were observed. While we studied breast cancer cells, the fluorine emulsions could be applied for treatment of other cancer cells overexpressing HER-2.
Keywords: Fluorine magnetic resonance imaging; Breast cancer cells
Introduction
The HER-2 receptor is a frequent target for tumor therapy. It is overexpressed usually as a result of HER-2/neu gene amplification, in approximately 25% of human breast cancers, and correlates with poor prognosis associated with reduced patient survival [1]. The HER-2 receptor is also a target for immunotherapeutic agents such as Herceptin, a humanized monoclonal antibody (mAb), which shows its efficacy against HER-2 positive breast cancer [1]. Since its approval by US Food and Drug Administration granted in 1998, Herceptin (Genentech, San Francisco, CA), has significantly influenced the treatment of HER-2 positive breast cancer patients.
We focused on the detection of Herceptin using fluorine-19 (19F) emulsion of perfluoro-15-crown-5-ether (PFCE) that is visible with 19F magnetic resonance imaging (MRI).1 Furthermore, changes in 19F signal intensity (SI) can be used to study the cell viability thus monitor the
treatment [2]. We selected 19F due to its low natural abundance, thus lack background 19F signal. At the same time it was shown that 19F substitution effects drug efficacy changing the
lipophilicity and electronic character of the drug which effects delivery [3]. The presence of 19F in organic molecules may improve efficacy and decrease toxicity due to enhanced solubility and reduced hydrophilicity [3].
In our studies, we used PFCE emulsions to breast cancer cells which enabled high enough cellular concentrations of 19F and allowed MR imaging within a reasonable acquisition time. PFCE has high MR signal due to its 20 eq 19F nuclei producing a single spectral peak [4].
Furthermore, we coupled Herceptin emulsions with Lipoplex [5], containing plasmid DNA and a transfection agent Lipofectamine, to test simultaneous delivery of Herceptin to cell surface target and plasmid DNA to cell cytoplasm. It is known, that Lipoplex [5] and [6], disrupts anionic membranes of cells and facilitates the uptake of drugs. For the conjugation of 19F labeled Herceptin to target cancer cells, we used novel bioconjugated compound, HydraLink [7]. The study was performed in the three-dimensional (3D) ex vivo model of breast carcinoma derived from MCF-7 cell lines and human mammary epithelial cells (HMEC) cultured in the hollow fiber bioreactor (HFB) device. The normal (HMEC) cells were used in order to understand no toxicity of the selected drugs on HMEC. The use of the HFB allowed high-density 3D cell cultures in the reproducible experimental setup and provided controlled conditions [8].
Experimental
Cell culturesHuman adenocarcinoma MCF-7 cells
Human MCF-7, a cell line producing HER-2, was obtained from the American Type Culture Collection (Manassas, VA). HER-2 overexpression of these cell lines was confirmed with cytometric analysis [9]. CO2 independent medium (Gibco Invitrogen, Rockville, MD)
supplemented with 10% buffered fetal bovine serum (FBS), 1% l-Glutamate and 1% antibiotic (penicillin/streptomycin) was used. The cells were re-suspended in the CO2 independent medium
and plated on a 6-well tissue culture polystyrene (TCPS) plates. Each well was then filled with 2 mL of CO2 independent medium and cultured at 37 °C under atmospheric CO2 for 24 h. The
cells were maintained in tissue culture flasks and cultured as monolayer until reached a density of 0.5 × 10⁵ cells mL−1.
Human mammary epithelial cells (HMEC)
HMEC cells (Gibco Invitrogen, Rockville, MD) were isolated from mammoplastic tissue and cultured in tissue culture flask. The Medium 171 supplemented with 0.4% bovine extract,
5 mg L−1 bovine insulin, 0.5 mg L−1 hydrocortisone and 3 μg L−1 human epidermal growth factor was used.
MCF-7 cells and HMEC cells (0.5 × 10⁵ cells mL−1) were seeded in the HFB device (FiberCell Systems Inc., Frederick, MD). The HFB is a closed loop system, which comprises of porous hydrophilic hollow fibers with 0.1 μm size pores in polysulfone tube. For this ex vivo study, we used one fiber in each HFB cartridge. The polysulfone fiber was coated with 10 mL of collagen solution (1 mg collagen per 1 mL of phosphate-buffered saline (PBS) and 10 mL of fibronectin solution (10% in culture media). After the inoculation, the HFB was perfused using a peristaltic pump. The flow of medium started at the rate of 5 mL min−1 and was gradually increased to 14 mL min−1. The pH was maintained in the extracapillary space throughout the duration of experiments between 6.8 and 7.0. The perfusion medium was changed weekly when the glucose level reached 2 g L−1 as measured with glucometer. Cells reached density of 109 cells mL−1 after 4 weeks in culture and were used for treatment. At the same time, the control cells were grown in a emulsion-free medium.
Cell viability
The number of cells was determined using Trypan blue (Sigma–Aldrich, Oakville, ON)
exclusion method [10]. Briefly, MCF-7 cells and HMEC cells were harvested from HFB device, seeded in 6-well microplates and exposed to 0.4% (w/v) Trypan blue dye solution. Cell numbers in the HFB device were determined manually with a hemacytometer chamber (Hausser
Scientific, Horsham, PA).
Preparation of emulsions
Herceptin (Genentech Inc., South San Francisco, CA, USA) was used at concentrations of 0.05 μg mL−1 to produce of H1, H8, H15, H22 emulsions; 0.5 μg mL−1 to produce of H2, H9,
H16, H23 emulsions; 50 μg mL−1 to produce of H3, H10, H17, H24 emulsions; (4) 100 μg mL−1 to produce of H4, H11, H18, H25 emulsions; (5) 200 μg mL−1 to produce of H5, H12, H19,
H26 emulsions; (6) 500 μg mL−1 to produce of H6, H13, H20, H27 emulsions as well as (7) 1000 μg mL−1 to produce of H7, H14, H21, H28 emulsions. Three different types of fluorine emulsions based on Herceptin and PFCE (SynQest Laboratories Inc., Alaucha, FL) were prepared. The ratio of Herceptin and PFCE concentrations for this technique was 1 to 2 in each emulsion. The prepared emulsions were: (1) Herceptin/PFCE: H8, H9, H10, H11, H12, H13,
H14 called (H8–H14), (2) Herceptin/PFCE/Lipoplex: H15, H16, H17, H18, H19, H20, H21 called (H15–H21) and (3) Herceptin/PFCE/HydraLink: H22, H23, H24, H25, H26, H27, H28 called (H22–H28) and described in the below subsections.
Herceptin/PFCE (H8–H14)
Herceptin (0.05, 0.5, 50, 100, 200, 500 and 1000 μg mL−1) was conjugated with PFCE at the ratio of 1/2 using the Heath method [11] by applying N-succinimidyl-3-(2-pyridyldithio) propionate (SPDP) as the cross-linking agents. Each of 7 Herceptin concentrations was used to produce of (H8–H14) emulsions.
Herceptin/PFCE/Lipoplex (H15–H21)
Each emulsion (H8–H14) was conjugated with Lipoplex at the molar ratio 1/2 to form Herceptin/PFCE/Lipoplex (H15–H21). Lipoplex was used as a mixture of plasmid DNA and
Lipofectamine (LipA) at the ratio of 1/3 (Invitrogen Inc., Gaithersburg, MD). LipA was composed of the polycationic lipid 2,3-dioleoxy-N-[2(sperminecarboxymido)ethyl]-N,N-dimethyl-1-propanaminium trifluoroacetate (DOSPA) and neutral lipid dioleolyl
phosphatidylethanolamine (DOPE) [12]. Lipoplex was mixed with (H8–H14) to obtain the ratio of LipA/Herceptin 3/1 in (H15–H21).
Herceptin/PFCE/HydraLink (H22–H28)
Unlike original (H8–H14) emulsions preparation (as described in section Herceptin/PFCE (H8– H14)), the use of HydraLink (acetone-5-(succinimidyloxycarbonyl)-pyridine-2-yl-hydrazone (SANH), EMD Bioscience Inc., La Jolla, CA) does not need the use of cross-linking compound. Herceptin was mixed with PFCE at ratio of 1/2 and 10-fold excess of SANH was added. Briefly for HydraLink preparation, a 2.0 mg of SANH was diluted in 100 μL of dimethylformamide (DMF) at 0.2 mM. The mixture was diluted in 100 mM of PBS (pH 8.0) and incubated for 1 h at 37 °C. The incorporation of SANH to Herceptin/PFCE was quantified according to the
manufacturer’s recommendations. 19
F Magnetic resonance spectroscopy and signal quantification
To obtain a quantitative estimate of the (H8–H28) preparation, we used the 19F magnetic resonance spectroscopy (MRS). These studies of dynamic abundance of 19F in (H8–H28) were performed using 21 cm diameter horizontal bore 9.4 Tesla (T) magnet (Magnex, UK) equipped with a TMX MR console (NRC-IBD, Canada). Spectra were acquired using a custom-built solenoidal radio-frequency (rf) coil double-tuned to 376 MHz and 400 MHz corresponding to 19F and 1H Larmour frequency at 9.4 T, respectively. 19F MR spectra were acquired using a one-pulse sequence (flip angle 60°; repetition time (TR) = 800 ms; number of average 2; echo time (TE) = 6 ms).
The tubes with 10 mL of (H8–H14) were prepared and 19F MR spectra were acquired at 0, 1, 24, 48 and 72 h. For internal MR standard small capillary with 10 μL of 5% v/v trifluoroacetic acid (TFA) was used. The concentration of PFCE was estimated using 19F signal intensity (SI) based on the reference of TFA. The conjugation of Herceptin to PFCE was confirmed with: (1) the chemical shift of the single fluorine peak of PFCE and (2) 19F SI changes in (H8–H14), (H15–
H21) and (H22–H28). For post-processing of 19F MR spectra MAREVISI software (NRC-IBD, Canada) was used.
Cellular applications of emulsions
The characterization of the fluorine emulsion based on the Herceptin requires demonstration that the antibody binds to the protein that contained the immunogen peptide. Therefore, to maximize conformational flexibility of fluorine emulsion of Herceptin and to optimize interaction with cell surface HER-2 receptor, we used 45 °C and 96 h for treatment in HFB device with (H21) and (H28).
MCF-7 cells were treated in presence of (H1–H7) (n = 2 HFB for each Herceptin concentration), (H8–H28) (n = 2 HFB for each emulsion) and (H8–H28) without conjugated Herceptin for 24, 48 and 72 h. To establish PFCE effects on MCF-7 cells, cells were treated with emulsions
without Herceptin. In addition, to establish Herceptin effects, treatments without PFCE were used. The densities of 109 cells mL−1 of MCF-7 and HMEC were obtained over 4 weeks and 69 HFBs were used (n = 4 HFB for untreated (control) MCF-7 and n = 4 HFB for control HMEC;
n = 40 HFB for MCF-7 treated with (H8–H28); n = 20 for HMEC treated with (H8–H28).
Approximately 4 × 10⁴ cells mL−1 were harvested from one HFB and treatments with (H8–H28) without conjugated Herceptin for 72 h were performed.
The day before emulsions (H15–H21) were placed to the cells; the cells were maintained in serum-free media without antibiotics. After treatment, serum-free media was replaced with serum containing media. The use of (H22–H28) was based on the conjugation of the succinimidyl-4-formylbenzoate (SFB) to Herceptin/PFCE/HydraLink. To accomplish the appropriate delivery of (H22–H28), cells were flushed with 0.2 mM solution of SFB (4 mg) in 100 μL DMF, while 2-hydrazinopyridine was conjugated with Herceptin and SANH. Moreover, viability of MCF-7 cells was measured after 72 h treatment with HER-4 antibody [HFR1] (Abcam, Cambridge, MA). The concentrations of HER-4 antibody were (0.05 and
1000 μg mL−1). 19
F Magnetic resonance imaging and signal quantification
19
F MR imaging was performed to determine efficacy of drugs. The treatment effect on MR images is the increased 19F SI due to cellular uptake of fluorine emulsions. 19F MR images were acquired using a spin echo imaging sequence with repetition time (TR) = 500 ms, echo time (TE) = 18 ms, 0.5 mm slice thickness, 2 cm × 2 cm field of view, 256 × 256 matrix size and 10 signal averages. The images were collected 24, 48 and 72 h after treatment in the HFB.
Proton (1H) MRI was used for localization of the cells in HFB, and to detect changes in the size of the cell culture due to cell shrinking and degradations. 1H images of the cross-section of the HFB device were acquired using a spin echo imaging sequence with TR = 1000 ms, TE = 40 ms, 0.5 mm slice thickness, 2 cm × 2 cm field of view, 256 × 256 matrix size and 10 signal averages. The HFB connected to the reservoir bottle was placed within the MRI-compatible incubation chamber that was continuously flushed with the mixture of air and CO2. 1H and 19F MRI were
processed with MAREVISI post-processing software (NRC-IBD, Canada). The resolution was 78 μm × 78 μm.
The 30 mL of (H8–H28) were introduced into separate HFB device and MRI scans were performed. 19F SI was measured directly from axial slice of HFB device [12]. The calibration curves were prepared, as 19F SI is linearly related with the amount of 19F molecules [13]. The 19F SI of pure PFCE was considered as 100% of SI. Percentage change in 19F SI was normalized to the pure PFCE using the following equation: 19F SI (% change) = [(U − L)/U] × 100%, where
L = 19F SI of PFCE in (H8, H15, H22), (H9, H16, H23), (H10, H17, H24), (H11, H18, H25), (H12, H19, H26), (H13, H20, H27) and (H14, H21, H28). U was 19F SI of pure PFCE. The minimal measurable amount of cells was calculated based on the 19F SI using tubes filled with 100, 1000, 10,000, 100,000, 1,000,000, 10,000,000, 100,000,000 and 1,000,000,000 cells and treated in the presence of (H8–H28). 19F SI was measured directly from region of cells [12]
and [14]. The 19F SI dependence on cell numbers was then compared to cells viability measured with Trypan blue.
Statistical analysis
All results are expressed as a mean ± SD. Differences between groups at each time point were identified by one-way Anova. Statistical comparison between two independent variables was determined by two-way Anova with Dunnet’s correction. The differences with p-values < 0.05 were considered statistically significant. Data were analyzed using the Sigma Stat Soft (Chicago, IL) software.
Results
Cells culturesThe cell counting using hemacytometer showed an increase in cell numbers in the HFBs devices after 4 weeks of cell growth. There were higher densities of cells closer to the fiber possibly due to the influence of medium flow that allowed optimum metabolites and waste concentration. The characterizations of MCF-7 and HMEC cells growth are presented in Table 1.
Table 1. 3D cell cultures characterization. MCF-7
Time [week] 1 2 3 4
Cell number [cell mL−1] 4.4 × 10⁵ 5.4 × 10⁶ 6.7 × 10⁸ 109
Viability [%] 91 ± 2 90 ± 3 89 ± 2 87 ± 1
HMEC
Cell number [cell mL−1] 3.3 × 10⁵ 4.7 × 10⁶ 6.3 × 10⁸ 109
Viability [%] 90 ± 4 89 ± 9 88 ± 3 85 ± 2
Emulsion characterization using 19F magnetic resonance spectroscopy
The PFCE has a single peak at 90 ppm. A single 19F peak at 80 ppm was collected from each emulsion (H8–H14). The acquired spectra of the (H15–H21) showed a single peak at 73 ppm. The 19F chemical shift of (H22–H28) was 68 ppm.
The 19F SIs of (H8–H28) reached maximum after 1 h of treatment and did not change after 72 h. After 20 min, 19F SIs of (H8–H28) were at ratio 1/2 to pure PFCE. The level of unreacted PFCE was 3% for (H8–H14) and (H15–H21) and 5% for (H22–H28), as compared with SI of pure PFCE before formulation of (H8–H28).
Viability
The viability of cells treated with Herceptin and its emulsions is shown in Fig. 1A–C. Within 72 h of treatment we observed, that results of viability were grouped separately with respect to the same concentration of Herceptin and PFCE. The viability of MCF-7 cells treated with HER-4 antibody (0.05 and 1000 μg mL−1) was 88 ± 2% and 75 ± 4%, respectively, after 72 h.
Fig. 1.
Viability of cells after 24 (A), 48 (B) and 72 h (C) treatment with presence of Herceptin, H1, H2,
H3, H4, H5, H6 and H7 called (H1–H7); Herceptin/PFCE, H8, H9, H10, H11, H12, H13 and
H14 called (H8–H14); Herceptin/PFCE/Lipoplex, H15, H16, H17, H18, H19, H20 and H21 called (H15–H21); Herceptin/PFCE/HydraLink H22, H23, H24, H25, H26, H27 and H28 called (H22–H28). Statistically significant differences as compared to untreated are indicated with an asterisk (*).
MCF-7 cells
After 24 h of treatment with (H1–H7) the MCF-7 cells viability was 80 ± 1%, 77 ± 4%, 74 ± 2%, 70 ± 3%, 66 ± 4%, 63 ± 3% and 61 ± 1%, respectively, and the significant changes were with H4, H5, H6 and H7 when compared to control. (H8–H14) used for 24 h of cells’ treatment showed viability of cells equal to 75 ± 6%, 69 ± 4%, 66 ± 3%, 62 ± 2%, 65 ± 4%, 63 ± 4% and 53 ± 1%, respectively. The viability of cells treated with (H15–H21) was 74 ± 4%, 67 ± 3%, 65 ± 2%, 60 ± 4%, 59 ± 4%, 57 ± 3% and 49 ± 1%, after 24 h. Moreover, the use of (H22–H28) showed viability equal to 72 ± 3%, 63 ± 3%, 61 ± 2%, 59 ± 3%, 57 ± 3%, 55 ± 4% and 47 ± 3%. MCF-7 cells 24 h exposure to (H3–H7), (H10–H14), (H17–H21) and (H24–H28) showed significant decreases in growth.
After 48 h the cells’ viability was 79 ± 5%, 75 ± 5%, 72 ± 5%, 69 ± 9%, 65 ± 3%, 59 ± 2% and 58 ± 4%, for the use of (H1–H7), respectively. The MCF-7 cells treated for 48 h with (H8–H14) showed viability equal to 76 ± 3%, 73 ± 2%, 70 ± 2%, 67 ± 5%, 63 ± 5%, 57 ± 7% and 54 ± 2%, respectively. The significant changes in the growth of MCF-7 were for (H9–H14) treatments.
The cells’ viability decreased to 74 ± 6%, 63 ± 8%, 61 ± 2%, 58 ± 4%, 57 ± 4%, 54 ± 3% and 46 ± 1%, for (H15–H21), respectively. The percentage of viable cells was 72 ± 3%, 63 ± 3%, 59 ± 2%, 57 ± 4%, 55 ± 5%, 53 ± 6%, 45 ± 4%, for (H22–H28), respectively.
After 72 h the viability decreased to 76 ± 3%, 73 ± 2%, 70 ± 2%, 67 ± 5%, 63 ± 5%, 57 ± 7% and 54 ± 2%, respectively, for (H1–H7). 72 h treatment of MCF-7 cells with (H8–H14) showed viability equal to 73 ± 3%, 62 ± 2%, 59 ± 6%, 55 ± 8%, 56 ± 9%, 52 ± 1% and 48 ± 5%,
respectively. The observed changes in viability were significant for each (H8–H14) emulsions. Exposure to (H15–H21) also significantly decreased cell viability. Viability was 71 ± 4%, 60 ± 4%, 57 ± 2%, 55 ± 1%, 53 ± 2%, 50 ± 3% and 43 ± 5%, for (H15–H21), respectively. The application of (H15–H21) showed more than 15% cells’ growth-inhibitory effect as compared with (H1–H7), more than 10% as compared with (H8–H14) and about 5% for viability assays with (H22–H28). These results suggest that the effectiveness of (H8–H14) binding to HER-2 is similar (H22–H28). Moreover, we did not observe decreases in cell growth while cells were treated with (H8–H28) emulsions without Herceptin.
HMEC cells
After 24 h, the normal HMEC cells treated with (H8–H14), (H15–H21) and (H22–H28) showed 1 ± 0.3% decreases in cells’ growth. The mean values of decreases in viability were equal to decreases observed in non-treated cells. Normal HMEC cells treated with (H8, H15, H22), (H9,
H16, H23), (H10, H17, H24), (H11, H18, H25), (H12, H19, H26), (H13, H20, H27) and (H14,
H21, H28) after 48 h show the following mean values of decreases in cells growth: 2.9 ± 1.5%, 3.1 ± 1.3%, 3.4 ± 0.7%, 3.5 ± 1%, 4.3 ± 2%, 6.2 ± 3%, 7.2 ± 0.5% and 7.5 ± 0.9%, for each emulsion, respectively.
Our study showed that PFCE has a little influence on cells growth because decreased percent of MCF-7 cells was 5% after 72 h exposure to PFCE. This finding suppurated the study performed on Herceptin that also showed influence on MCF-7 cells growth after 72 h. The use of Herceptin alone decreased cells growth for 30%. As excepted, the Herceptin has ability to be a main growth inhibitory compound in studied fluorine emulsions. Moreover, cells incubated with (H21) and (H28) at 45 °C for 96 h and incubated at 37 °C for 72 h showed the same viability, respectively.
Efficacy
It was also observed that after 72 h the mean of EC50 values were reached at 970 ± 13 μg mL−1
for (H8–H14), 645 ± 11 μg mL−1 for (H15–H21), 678 ± 7 μg mL−1 for (H22–H28), while for (H1–H7) was 1000 ± 3 μg mL−1 of Herceptin (Fig. 2).
Fig. 2.
The efficacy of Herceptin (H1–H7), Herceptin/PFCE (H8–H14), Herceptin/PFCE/Lipoplex (H15–H21) and Herceptin/PFCE/HydraLink (H22–H28).
Quantification with 19F MRI
The 19F SI acquired at 9.4 T from emulsions formulated with PFCE was linear with respect to 19F content (Fig. 3). The calibration curve was described by the equation y = 12.321 × x + 10.286 with regression value 0.9965, where “y” is a unit in % and “x” is a unit in μg mL−1.
Fig. 3.
The calibration curve of PFCE. The signal intensity was measured at 9.4 T and normalized with respect to a standard composed PFCE reagent. 19F SI of standard composed PFCE reagent was considered as 100% of SI. Emulsion mixtures were grouped with respect to the same
concentration of Herceptin and PFCE. 19F SI was linear with respect to PFCE concentration for (H8–H28).
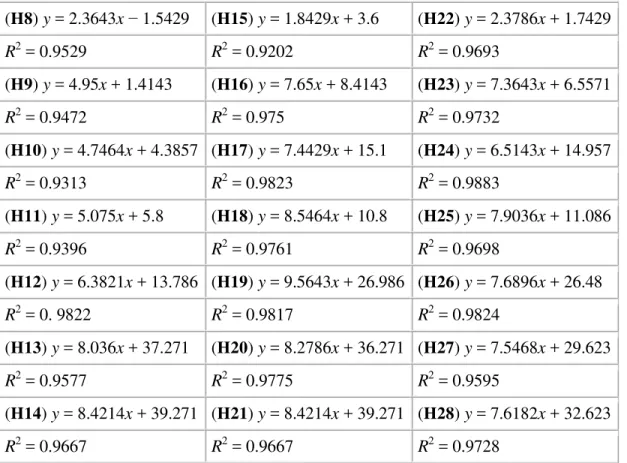
A potential key for ex vivo application of emulsions was the Herceptin concentration and localization of the 19F SI in the area of breast cancer cells. Fig. 4A–C illustrated that: (1) MR measurements enables cellular detection of the emulsions based on registration of the unique 19F SI of PFCE associated with Herceptin; (2) the concentration of emulsions can be quantified based on the 19F SI; (3) based on the 19F SI the number of targeted cells can be counted. The
linear functions and regressions describing the use of (H8–H28) to known numbers of cells are presented in Table 2.
Fig. 4.
19
F SI was acquired at 9.4 T after 72 h of treatment with: Herceptin/PFCE (H8) and (H14) (A); Herceptin/PFCE/Lipoplex (H15) and (H21) (B); and Herceptin/PFCE/HydraLink (H22) and (H28) (C).
Table 2. Uptake of emulsions in cell cultures – linearity and regression.
(H8) y = 2.3643x − 1.5429 (H15) y = 1.8429x + 3.6 (H22) y = 2.3786x + 1.7429 R2 = 0.9529 R2 = 0.9202 R2 = 0.9693 (H9) y = 4.95x + 1.4143 (H16) y = 7.65x + 8.4143 (H23) y = 7.3643x + 6.5571 R2 = 0.9472 R2 = 0.975 R2 = 0.9732 (H10) y = 4.7464x + 4.3857 (H17) y = 7.4429x + 15.1 (H24) y = 6.5143x + 14.957 R2 = 0.9313 R2 = 0.9823 R2 = 0.9883 (H11) y = 5.075x + 5.8 (H18) y = 8.5464x + 10.8 (H25) y = 7.9036x + 11.086 R2 = 0.9396 R2 = 0.9761 R2 = 0.9698 (H12) y = 6.3821x + 13.786 (H19) y = 9.5643x + 26.986 (H26) y = 7.6896x + 26.48 R2 = 0. 9822 R2 = 0.9817 R2 = 0.9824 (H13) y = 8.036x + 37.271 (H20) y = 8.2786x + 36.271 (H27) y = 7.5468x + 29.623 R2 = 0.9577 R2 = 0.9775 R2 = 0.9595 (H14) y = 8.4214x + 39.271 (H21) y = 8.4214x + 39.271 (H28) y = 7.6182x + 32.623 R2 = 0.9667 R2 = 0.9667 R2 = 0.9728
The concentration of 19F in (H8–H28) was high enough to be detected with 19F MRI while cells in HFB were treated. The images showed accumulations of (H8–H28) that corresponded to cells viability. The increase in 19F concentrations of (H8–H28) resulted in increased cellular uptake of (H8–H28) (Fig. 4).
The detection limit, due to insufficient 19F signal, of targeted cells in HFB device was 1000 cells while cells were treated using (H8–H28) emulsions. At the same time, there was no 19F signal from surrounding media because culture was flushed with fresh media after treatment. The advantage of the used 19F MRI is its selectivity as only fluorine emulsion labeled cells are visible (Fig. 5). High signal is observed at cell surface due to bound fluorinated emulsions. Therefore, the absolute number of treated cells was estimated from the 19F MR images using 19F SI of cells which internalize the emulsions.
Fig. 5.
19
F MR image of breast cancer tumor after 72 h treatment with Herceptin/PFCE/Lipoplex (H21). The red arrow indicated breast cancer cells and green arrow indicated cells with high uptake of emulsion.
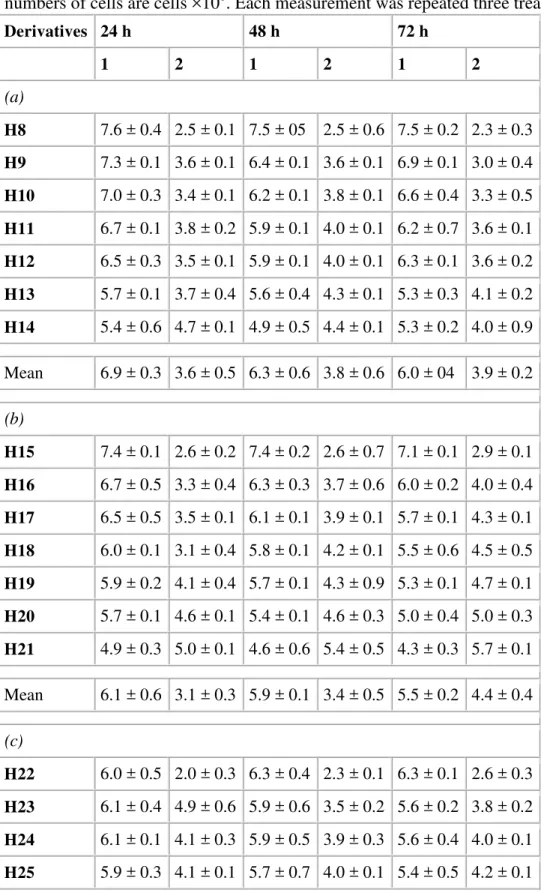
The detection of cells treated with (H8–H28) in HFBs showed significant changes in the treated number of cells. The entire viable number of cells, assayed by Trypan blue, was 109 cells mL−1 in HFBs devices. The decrease in the number of cells during 24, 48 and 72 h treatment durations is shown in Table 3A–C. At the same time the estimated values of unviable cells, correspond to numbers of cells calculated from 19F SI. As proved by viability assay, the cells visible with 19F MRI are non-viable cells while examined by Trypan blue. However, the cells visible with the use of 19F MRI were non-viable. Both 19F MRI and Trypan blue showed to be a complementary for the viability measurement. Fig. 6A–C showed pictures of treated cells taken at different time points. As shown in Fig. 6, the 19F signal of cell culture after 24 h of treatment was obtained mainly from the marginal region of the tumor, while the interior of the tumor showed no 19F signal. This most likely occurred because the emulsion was moving during this period through tumor. In each sample the increased 19F SI was presented in the cells regions, after 48 and 72 h. The use of (H15–H21) showed faster and higher uptake in cell cultures.
Table 3. The numbers of MCF-7 cells detected with Trypan blue (1) and 19F MRI (2). The values are mean for three types of fluorine emulsions: Herceptin/PFCE (H8–H14) (a),
Herceptin/PFCE/Lipoplex (H15–H21) (b) and Herceptin/PFCE/HydraLink (H22–H28) (c). All numbers of cells are cells ×108. Each measurement was repeated three treatments.
Derivatives 24 h 48 h 72 h 1 2 1 2 1 2 (a) H8 7.6 ± 0.4 2.5 ± 0.1 7.5 ± 05 2.5 ± 0.6 7.5 ± 0.2 2.3 ± 0.3 H9 7.3 ± 0.1 3.6 ± 0.1 6.4 ± 0.1 3.6 ± 0.1 6.9 ± 0.1 3.0 ± 0.4 H10 7.0 ± 0.3 3.4 ± 0.1 6.2 ± 0.1 3.8 ± 0.1 6.6 ± 0.4 3.3 ± 0.5 H11 6.7 ± 0.1 3.8 ± 0.2 5.9 ± 0.1 4.0 ± 0.1 6.2 ± 0.7 3.6 ± 0.1 H12 6.5 ± 0.3 3.5 ± 0.1 5.9 ± 0.1 4.0 ± 0.1 6.3 ± 0.1 3.6 ± 0.2 H13 5.7 ± 0.1 3.7 ± 0.4 5.6 ± 0.4 4.3 ± 0.1 5.3 ± 0.3 4.1 ± 0.2 H14 5.4 ± 0.6 4.7 ± 0.1 4.9 ± 0.5 4.4 ± 0.1 5.3 ± 0.2 4.0 ± 0.9 Mean 6.9 ± 0.3 3.6 ± 0.5 6.3 ± 0.6 3.8 ± 0.6 6.0 ± 04 3.9 ± 0.2 (b) H15 7.4 ± 0.1 2.6 ± 0.2 7.4 ± 0.2 2.6 ± 0.7 7.1 ± 0.1 2.9 ± 0.1 H16 6.7 ± 0.5 3.3 ± 0.4 6.3 ± 0.3 3.7 ± 0.6 6.0 ± 0.2 4.0 ± 0.4 H17 6.5 ± 0.5 3.5 ± 0.1 6.1 ± 0.1 3.9 ± 0.1 5.7 ± 0.1 4.3 ± 0.1 H18 6.0 ± 0.1 3.1 ± 0.4 5.8 ± 0.1 4.2 ± 0.1 5.5 ± 0.6 4.5 ± 0.5 H19 5.9 ± 0.2 4.1 ± 0.4 5.7 ± 0.1 4.3 ± 0.9 5.3 ± 0.1 4.7 ± 0.1 H20 5.7 ± 0.1 4.6 ± 0.1 5.4 ± 0.1 4.6 ± 0.3 5.0 ± 0.4 5.0 ± 0.3 H21 4.9 ± 0.3 5.0 ± 0.1 4.6 ± 0.6 5.4 ± 0.5 4.3 ± 0.3 5.7 ± 0.1 Mean 6.1 ± 0.6 3.1 ± 0.3 5.9 ± 0.1 3.4 ± 0.5 5.5 ± 0.2 4.4 ± 0.4 (c) H22 6.0 ± 0.5 2.0 ± 0.3 6.3 ± 0.4 2.3 ± 0.1 6.3 ± 0.1 2.6 ± 0.3 H23 6.1 ± 0.4 4.9 ± 0.6 5.9 ± 0.6 3.5 ± 0.2 5.6 ± 0.2 3.8 ± 0.2 H24 6.1 ± 0.1 4.1 ± 0.3 5.9 ± 0.5 3.9 ± 0.3 5.6 ± 0.4 4.0 ± 0.1 H25 5.9 ± 0.3 4.1 ± 0.1 5.7 ± 0.7 4.0 ± 0.1 5.4 ± 0.5 4.2 ± 0.1
Derivatives 24 h 48 h 72 h 1 2 1 2 1 2 H26 5.1 ± 0.2 4.3 ± 0.7 5.5 ± 0.1 4.1 ± 0.4 5.7 ± 0.1 4.3 ± 0.8 H27 5.5 ± 0.1 4.5 ± 0.5 5.3 ± 0.6 4.3 ± 0.1 4.9 ± 0.6 4.7 ± 0.1 H28 4.7 ± 0.2 5.3 ± 0.4 4.5 ± 0.1 4.8 ± 0.6 4.2 ± 0.3 5.2 ± 0.5 Mean 5.6 ± 0.6 4.8 ± 0.3 5.5 ± 0.4 3.8 ± 0.2 5.3 ± 0.1 4.1 ± 0.5 Fig. 6. 19
F MR images of MCF-7 cells treated with Herceptin/PFCE/HydraLink (H28) water–oil emulsion after 24 (A), 48 (B) and 72 h (C) of treatment. The red arrows indicated cells close to the fiber, green arrows indicate extracellular emulsion.
After 24 h, the quantitative comparison of treated cells showed that (H15–H21) were the most effective emulsions. The mean amount of cells treated with (H8–H14) and detected using 19F SI was 3.0 ± 0.3 × 10⁸ while there were 3.8 ± 3 × 10⁸ and 3.4 ± 0.2 × 10⁸ cells treated with (H15–
H21) and (H22–H28), respectively.
After 48 h, the treated number of cells increased and was 3.8 ± 0.6 × 10⁸ for (H8–H14),
4.4 ± 0.2 × 10⁸ for (H15–H21) and 4.1 ± 0.4 × 10⁸ for (H22–H28). However, the number of cells identified by 19F SI was 4.0 ± 0.2 × 10⁸ for (H8–H14), 4.8 ± 0.3 × 10⁸ for (H15–H21) and
4.3 ± 0.6 × 10⁸ for (H22–H28), after 72 h.
Discussion
Targeted therapy has become an important paradigm in oncology. Herceptin, a humanized mAb that targets HER-2 expressing cells, is used clinically to treat several malignancies. However, the mechanisms regulating the expression of HER-2 remain poorly understood. About 70% of patients with HER-2 overexpression do not respond to Herceptin, and the reasons for this have been still unclear [15].
Therefore the formulation of peptide-delivery agents, which are visible and measurable with an analytical method is needed. To this end Herceptin was conjugated to form 111In-Herceptin [16]
Cy5.5-Herceptin [18] for Infra Red (IR) imaging [19]. Herceptin has also been successfully coupled with nanoparticles synthesized in non-hydrolytic reaction between MnCl2 and iron
tris-2,4-pentadionate (MnMEIO) in the presence of oleic acid and oleylamine as surfactants to use 1H MRI of HER-2 in mice [20]. In this paper, we present water–oil emulsions of PFCE and Herceptin used as a contrast agent specific to HER-2 that allows the application of 19F MRI to monitor Herceptin action as well as study the effect of fluorination on the efficacy of Herceptin. It was already observed that there are detectable changes in behavior of a molecule after the introduction of a fluorine atom. Structural information is essential to know fluorine contributions to protein binding affinity and potential uptake of the fluorinated structure. Preferably, fluorine introduced into regions of high electron density can affect the binding affinity. The liquid perfluorocarbon as PFCE is a core material in oil–water emulsions and is surrounded by a lipid monolayer that can be functionalized to contain therapeutic action of Herceptin. Once the binding of oil–water emulsion to target takes place, high avidity needs to be conferred through multivalent interactions between the emulsion and cell surface. Fluorine as small atoms of high electro-negativity, introduced to protein environment, prefer to orient toward electropositive regions of receptor sites and enhance C F H N, C F C O, and C F H Ca interactions. Moreover, fluorine can interact with side-chain amide residues of Asn and Glu and the positively charged side chain of Arg. The perturbation of pKa can strongly modify the
binding affinity and the pharmacokinetic properties of a pharmaceutical agent. Modulation of pKa may have impact on bioavailability by affecting the drug uptake process [21]. The geometry
of the bound drug resembles the lowest-energy conformation of the free ligand and the stronger gain in binding free energy. This observation led to organo-fluorine based cancer research [22]. In breast cancer chemotherapy, Tamoxifen has been used since the 1970’s in the treatment of hormone-dependent breast cancer. It is an estrogen antagonist in breast tissue, but it also acts as an estrogen agonist in the bones and endometrium [23]. Recently, to address the drawbacks of Tamoxifen, Faslodex 1 (AstraZeneca) also known as Fulvestrant, was developed. This drug is a pentafluorinated 7α-alkylsulfinyl analog of 17β-estradiol. It is an estrogen receptor antagonist, but it has no agonist activity. Faslodex 1 acts by competitively binding with estradiol to the estrogen receptors in breast tissue, reducing proliferation of the tumor cells [24].
Exposure of cells to various compounds may interfere with their cellular homeostasis and membrane integrity and result in cytotoxicity effect. To date, the uptake ability and toxic potential of crown ethers have been tested and confirmed in some mammalian cell cultures [25]
and [26]. However, no studies have investigated on MCF-7 cells toxicity after treatment with PFCE alone. To study specific cytotoxic role of Herceptin incorporated in PFCE emulsions, we performed studies on MCF-7 treated with PFCE alone and Herceptin alone.
PFCE used for Herceptin emulsifications were easy dispersed and fast stabilized in an aqueous environment. The emulsion was effective, safe and biodegradable. Another point is that effective
ex vivo dose of treatments were reached rapidly after one injection to the cells. Of particular
importance in 19F MRI is PFCE that does not degrade in vivo and has no known intracellular biological reactivity [4]. Moreover, PFCE does not incorporate into the cell membranes due to its lipophilicity and is biodegradable [4]. The PFCE emulsions enhance Herceptin efficacy because the chain of Herceptin peptide itself is not subject to pH changes. Moreover, the PFCE cannot destroy Herceptin consisting of peptides. It is known that, fluorination decreases the basicity, therefore improves bioavailability of a conjugated drug [3]. The time of delivery is facilitated by
high fluidity of PFCE that allows rapid mixing of components. These properties significantly improve the efficacy of emulsions as therapeutic vehicles for contact-mediated transfer of such peptides and other selected therapeutic agents. Fluorinated compounds such as antibodies can monitor the results of therapy and characterize disease state. Moreover, fluorine can enhance binding efficacy and selectivity in anticancer drugs. It is known that each antibody performs differently depending on the fixative conditions and is associated with different parameters of specificity [27]. Moreover, the reason for relatively low specificity is that the antibodies used for diagnosis may recognize different epitopes from that one recognized by the drug. In this study, we utilized specificity of the compounds with fluorinated labeling in revealing that the uptake of drugs is through the Herceptin receptor.
While the fluorination is essential for Herceptin tracking and solubility, the introduction of Lipoplex into emulsions provides faster accumulation of Herceptin in cells due to sufficient intracellular uptake. Moreover, more cells were treated due to plasmid DNA fusion to nuclei and cell surface targeted by Herceptin. It is known that the surface charge of both drug and cells play an important role in determining drug efficacy. It was shown, that LipA transfers the transfected material into the cell through lipid membrane [5]. This process results in direct delivery of the protein to the target without interfering with the cell membrane and influences several cancer cells’ activities, including growth and adhesion. LipA is lipophilic and interacts electrostatically with negatively charged DNA or other proteins and enables passing through the hydrophobic cell membrane [6].
Moreover, it is known that HER-2 receptor family has four members (HER-1, HER-2, HER-3, HER-4) [28] and [29]. Current data suggest that HER-4 receptors have an impact on intracellular signaling and activation of genes involved in breast cancer tumor growth. Therefore, we also showed effect of HER-4 antibody used to treatment MCF-7 culture.
In the presented research, we focused on the development of new protocols for obtaining
information on Herceptin efficacy using 19F MRI ex vivo. For this purpose MCF-7 were cultured in 3D geometry in MR compatible HFB device. Only recently HFB device was used for 3D cancer growth [8]. Recent works have shown [8] that the reaction of 2D cancer cell line cultures to therapeutic is different than in 3D formation.
The ECM is composed of collagens, proteoglycans, glycoproteins and smaller amounts of other proteins [30]. Fibronectin and laminin are matrix glycoproteins that bind specifically to
collagens, proteoglycans and cell surface receptors. Both fibronectin and laminin influence the adhesion, morphology, growth, and differentiation of cells [31]. However, collagen is the most widely used ECM for cell culture applications, and it facilitates cell attachment, growth, differentiation, migration and tissue morphogenesis during development. The growth,
morphology and differentiation of a variety of cells [32] is affected by collagen, perhaps due to its adhesive activity. In the present article, we have described the ability of 3D culture using collagen solution to create an extracellular matrix between the cells and the fiber. However, to mimic the in vivo situation, the use of fibronectin, laminin including Type IV collagen as exists
in vivo is efficient. The 3D culture mimics better in vivo conditions, is structurally more accurate
than monolayers, and can be used as an efficient screening tool for the study of
recognized as a better in vitro model for drug screening and toxicity studies there has been no real transition from 2D to 3D cell culture, due to the lack of a simple and easy-to-use devices allowing 3D cell culture.
Conclusion
19
F labeled Herceptin combined with ex vivo 19F MRI provide a new technique to evaluate treatment of human MCF-7 cells with HER-2 overexpression. Here, we present the application of 19F MRI to monitor the response of adenocarcinoma breast cancer cells treated with fluorine emulsions. The results of the present study show that the labeling procedure allows the cellular delivery and uptake of Herceptin. The concentration of the investigated PFCE emulsions reached sufficient levels in cells to be detected using 19F MRI. The use of proposed Herceptin forms can improve the efficacy of Herceptin.
Acknowledgment
This study was supported by the Canadian Breast Cancer Research Alliance of Canada.
References
[1] S.C. Wang, L. Zhang, G.N. Hortobagyi and M.C. Hung, Semin. Oncol. 28 (2001), pp. 21–29.
[2] A.M. Morawski, P.M. Winter, X. Yu, R.W. Fuhrhop, M.J. Scott, F. Hockett, J.D. Robertson, P.J. Gaffney, G.M. Lanza and S.A. Wickline, Magn. Reson. Med. 52 (2004), pp. 1255–1262.
[3] S. Purser, P.R. Moore, S. Swallow and V. Gouverneur, Chem. Soc. Rev. 37 (2008), pp. 320– 330.
[4] B.J. Dardzinski and C.H. Sotak, Magn. Reson. Med. 32 (1994), pp. 88–97.
[5] E. Khazanov, D. Simberg and Y. Barenholz, J. Gene Med. 8 (8) (2006), pp. 998–1007.
[6] I.S. Zuhorn and D. Hoekstra, J. Membr. Biol. 189 (2002), pp. 167–179.
[7] G. Liu, S. Dou, J. He, X. Liu, M. Rusckowski and D.J. Hnatowich, Eur. J. Nuc. Med. Mol.
Imaging 34 (2) (2007), pp. 237–246.
[8] A. Abbott, Nature 424 (2003), pp. 870–872.
[9] K. Kono, Y. Rongcun and J. Charo, Int. J. Cancer 78 (1998), pp. 202–208.
[10] K. Takahashi and G. Loo, Biochem. Pharmacol. 67 (2004), pp. 315–324.
[11] T.D. Heath, J.A. Montgomery, J.R. Pipert and D. Paphadjopulos, Proc. Natl. Acad. Sci. USA
[12] J.H. Felgner, R. Kumar, C.N. Sridhar, C.J. Wheeler, Y.J. Tsai, R. Border, P. Ramsey, M. Martin and P.L. Felgner, J. Biol. Chem. 269 (1994), pp. 2550–2561.
[13] M. Srinivas, P.A. Morel, L.A. Ernst, D.H. Laidlaw and E.T. Ahrens, Magn. Reson. Med. 58 (2007), pp. 725–734.
[14] L. Li, D.V. Kodibagkar, Y. Jian-Xin and R.P. Mason, FASEB J. 21 (2007), pp. 2014–2019.
[15] L. Gianni, J. Clin. Oncol. 26 (2008), pp. 1789–1793.
[16] P.J. Perik, M.N. Lub-De Hooge, J.A. Gietema, W.T. van der Graaf, M.A. de Korte, S. Jonkman, J.G. Kosterink, D.J. van Veldhuisen, D.T. Sleijfer and P.L. Jager, J. Clin. Oncol. 24 (15) (2006), pp. 2276–2282.
[17] M.N. Lub-de Hooge, J.G. Kosterink, P.J. Perik, H. Nijnuis, L. Tran, J. Bart, A.J.
Suurmeijer, S. de Jong, P.L. Jager and E.G. de Vries, Br. J. Pharmacol. 143 (1) (2004), pp. 99– 106.
[18] K. Garmestani, D.E. Milenic, P.S. Plascjak and M.W. Brechbiel, Nucl. Med. Biol. 29 (5) (2002), pp. 599–606.
[19] P.M. Smith-Jones, D.B. Solit, F. Afroze, N. Rosen and S.M. Larson, J. Nucl. Med. 47 (5) (2006), pp. 793–796.
[20] P.M. Smith-Jones, D.B. Solit, T. Akhurst, F. Afroze, N. Rosen and S.M. Larson, Nat.
Biotechnol. 22 (6) (2004), pp. 701–706.
[21] D.A. Smith, H. Van de Waterbeemd and D.K. Walker, Methods and Principles in Medicinal Chemistry, vol. 31: Pharmacokinetics and Metabolism in Drug Design, Wiley-VCH, Weinheim (2006).
[22]D. O’Hagan, Chem. Soc. Rev. 37 (2008), pp. 308–319.
[23] J.F.R. Robertson, S.E. Come, S.E. Jones, F. Beex, M. Kaufmann, A. Makris, J.W.R. Nortier, K. Possinger and L.-E. Rutqvist, Eur. J. Cancer 41 (2005), pp. 345–346.
[24] M. Rowley, D.J. Hallett, S. Goodacre, C. Moyes, J. Crawforth, T.J. Sparey, S. Patel, R. Marwood, S. Patel, S. Thomas, L. Hitzel, D. O’Connor, N. Szeto, J.L. Castro, P.H. Hutson and A.M. MacLeod, J. Med. Chem. 44 (2001), pp. 1603–1614.
[25] M.M. McPhee and S.M. Kerwin, Bioorg. Med. Chem. 9 (2001), pp. 2809–2818.
[26] P. Arenaz, L. Bitticks, K. Pannell and S. Garcia, Mutat. Res. 280 (1992), pp. 109–115.
[27] D. Gancberg, L. Lespagnard, G. Rouas, M. Paesmans, M. Piccart, A. Di Leo, J.M. Nogaret, D. Hertens, A. Verhest and D. Larsimont, Am. J. Clin. Pathol. 113 (2000), pp. 675–682.
[28] C.J. Witton, J.R. Reeves, J.J. Going, T.G. Cooke and J.M. Bartlett, J. Pathol. 200 (2003), pp. 290–297.
[29] M. Sundvall, K. Iljin, S. Kilpinen, H. Sara, O.P. Kallioniemi and K. Elenius, J. Mammary
Gland Biol. Neoplasia 13 (2008), pp. 259–268.
[30] G.R. Martin and H.K. Kleinman, Hepatology 1 (3) (1981), pp. 264–266.
[31] H. Järveläinen, A. Sainio, M. Koulu, T.N. Wight and R. Penttinen, Pharmacol. Rev. 61 (2) (2009), pp. 198–223.
[32] H.K. Kleinman, R.J. Klebe and G.R. Martin, J. Cell. Biol. 88 (3) (1981), pp. 473–485.
1
Abbreviations used: 3D, three dimensional; HFB, hollow fiber bioreactor; MR, magnetic resonance; MRI, magnetic resonance imaging; ms, millisecond.