Publisher’s version / Version de l'éditeur:
Questions? Contact the NRC Publications Archive team at
[email protected]. If you wish to email the authors directly, please see the
https://publications-cnrc.canada.ca/fra/droits
L’accès à ce site Web et l’utilisation de son contenu sont assujettis aux conditions présentées dans le site
LISEZ CES CONDITIONS ATTENTIVEMENT AVANT D’UTILISER CE SITE WEB.
7th International Symposium on Utilization of High-Strength/High Performance
Concrete [Proceedings], pp. 1-20, 2005-06-01
READ THESE TERMS AND CONDITIONS CAREFULLY BEFORE USING THIS WEBSITE.
https://nrc-publications.canada.ca/eng/copyright
NRC Publications Archive Record / Notice des Archives des publications du CNRC : https://nrc-publications.canada.ca/eng/view/object/?id=0ce12e8f-1ba7-4dc0-831a-8396d2c7ffee https://publications-cnrc.canada.ca/fra/voir/objet/?id=0ce12e8f-1ba7-4dc0-831a-8396d2c7ffee
NRC Publications Archive
Archives des publications du CNRC
This publication could be one of several versions: author’s original, accepted manuscript or the publisher’s version. / La version de cette publication peut être l’une des suivantes : la version prépublication de l’auteur, la version acceptée du manuscrit ou la version de l’éditeur.
Access and use of this website and the material on it are subject to the Terms and Conditions set forth at
Restrained shrinkage testing of high-performance concrete modified
with structural lightweight aggregate
Restrained shrinkage testing of
high-performance concrete modified with
structural lightweight aggregate
Daniel Cusson, Ted Hoogeveen and Lyndon
Mitchell
A version of this document is published in / Une version de ce document se trouve dans:
7th International Symposium on Utilization of High-Strength/High Performance Concrete
(Washington, D.C. June 20, 2005), pp. 1-20, June 01, 2005
http://irc.nrc-cnrc.gc.ca/ircpubs
7th Int. Symposium on Utilization of High-Strength/ High-Performance Concrete, Washington D.C., 20-24 June 2005, SP 228-87, Vol. 2, 1353-1372.
RESTRAINED SHRINKAGE TESTING OF
HIGH-PERFORMANCE CONCRETE MODIFIED WITH
STRUCTURAL LIGHTWEIGHT AGGREGATE
Daniel Cusson, Ted Hoogeveen and Lyndon Mitchell
Synopsis: A comprehensive research program at the National Research Council Canada
is underway to develop low-shrinkage high-performance concrete for the design of cost-effective and sustainable concrete structures. This paper presents the structural
laboratory testing of large prismatic high-performance concrete (HPC) specimens under restrained shrinkage and tensile creep. A systematic testing approach is presented, including a description of the theoretical background and the experimental apparatus used. The structural behaviour of two different HPC mix designs are compared and documented. The control concrete had a water-cement ratio of 0.34 and a cement-sand-aggregate ratio of 1:2:2. A slight variation of this mix design included 6% sand replacement by pre-soaked porous expanded shale lightweight aggregate. One of the objectives of this study is to determine whether the addition of this type of aggregate could effectively reduce autogenous shrinkage due to internal drying in HPC. Test results show that 6% sand replacement by pre-soaked porous lightweight aggregate reduces autogenous shrinkage moderately. This moderate shrinkage reduction was accompanied by a moderate increase in tensile creep. The results also reveal that most internal drying and autogenous shrinkage developed shortly after setting in both concrete mixes. This observation suggests that solutions to preventing autogenous shrinkage cracking in HPC will involve techniques that should be effective shortly after setting.
Keywords: autogenous shrinkage; high-performance concrete; high-strength concrete; internal drying; restrained shrinkage; self-desiccation; tensile creep; thermal shrinkage
ACI member Dr. Daniel Cusson is a Research Officer at the National Research Council Canada (NRC), Ottawa, ON, K1A 0R6. He is a member of ACI 363 Committee on strength concrete. His research interests include early-age structural behaviour of high-performance concrete, and field high-performance and durability of repaired concrete bridges.
Mr. Ted Hoogeveen, is a Technical Officer at the NRC. His expertise includes
structural testing of reinforced concrete and remote monitoring of concrete bridges.
Dr. Lyndon Mitchell, is a Research Officer at the NRC with interests in cement
chemistry and concrete science. He is a member of the Canadian Action Plan 2000 Committee on climate change issues. These interests are coupled with responsibilities for maintaining the X-Ray and microscopy laboratories.
INTRODUCTION
The 1990’s saw a significant increase in the use of high-performance concrete (HPC) in structures. Although HPC can offer superior strength and low permeability, it has shown to be sensitive to early-age cracking, which can result in premature reinforcement corrosion, concrete deterioration, higher maintenance costs and reduced service life of concrete structures. A research program is underway at the NRC to develop low-shrinkage, high-performance concrete for the design and construction of cost-effective and sustainable concrete structures. This paper presents the structural laboratory testing results of large prismatic HPC specimens under restrained autogenous shrinkage and creep. A complete structural testing system and corresponding test procedures were developed to enable the testing of realistically sized concrete specimens at early age. HPC with low water to cement ratio (w/c) can exhibit early-age cracking due to self-desiccation. It can create significant stresses within the open pore structure of the concrete as the available water is removed through cement hydration. This study uses a pre-soaked porous lightweight aggregate to provide a reservoir of water that, over the early life of the concrete structure, relieves the build up of these stresses and thus reduces the potential for cracking of high-performance concrete. An optimum mix design using such aggregate would be one that uses the least amount of lightweight aggregate, while retaining good workability, good early-strength gain, reduction in shrinkage, and no loss of early, medium and long-term properties.
RESEARCH SIGNIFICANCE
The testing system and methods developed for studying the restrained shrinkage and creep of HPC present some new features over existing approaches (Kovler 1994; Bjontegaard et al. 1999; Sule et al. 2004). A specimen size of 200x200x1000mm was selected to allow the study of real-size concrete elements, which can include large-size coarse aggregate, fiber reinforcement and/or reinforcing bars. The system measures restrained shrinkage with a preset degree of restraint (partial or full), for which the restraining load is transferred to the concrete by four continuous embedded reinforcing
bars. This is considered to be more representative of the conditions under which reinforced concrete structures with restrained shrinkage are found in the field. Several challenges inherent to the specimen size and weight had to be overcome, such as the friction between the concrete and the form during testing, and the effects of temperature on the measurements and concrete maturity due to significant heat of hydration. The test method can therefore separate thermal strain from autogenous shrinkage strain, and provide accurate measurements of shrinkage and creep from the time of initial setting. In order to investigate new approaches that reduce cracking due to restrained shrinkage, the new testing apparatus was used to compare two high-performance concretes (w/c=0.34). Concretes with and without the addition of lightweight aggregate sand were assessed for their abilities to reduce self-desiccation in HPC. The promising results reported in this paper will benefit the construction industry by demonstrating new approaches for effectively reducing autogenous shrinkage, without compromising the important structural properties of HPC. The research shows that even minor amounts of lightweight sand added to the concrete mix design improve shrinkage somewhat.
THEORETICAL BACKGROUND
Strain Calculation Procedure
To determine the mechanical properties of concrete under restrained conditions, two large-size prismatic concrete specimens (200x200x1000mm) were tested simultaneously under identical curing conditions (external drying prevented): one under restrained shrinkage, the other under free shrinkage. Since most concrete structures are under different degrees of restraint, the testing procedure was developed to allow a preset degree of restraint during testing (0<K<1). A clear advantage of using a degree of restraint lower than unity is that restrained shrinkage testing can be conducted for a longer period of time without failing prematurely the concrete specimen.
In order to impose a preset degree of restraint in the restrained specimen, a defined amount of strain has to be controlled according to:
) ( ) 1 ( ) (t K sh t tot ε ε = − [1]
where εtot is the total strain measured in the restrained specimen, and εsh is the
autogenous shrinkage strain measured in the unrestrained specimen. Based on a preset degree of restraint selected for the experiment and estimated shrinkage values, a constant value of total strain can be applied during testing. The degree of restraint may be
lowered temporarily in order to prevent premature cracking if the tensile stress in the restrained specimen gets close to the estimated tensile strength. At regular time intervals, partial unload/reload cycles were performed for the determination of the concrete modulus of elasticity (Ec) in tension. From the Ec values obtained at different times, a
regression analysis was performed to determine the development of Ec with time. The
) ( ) ( ) ( t E t t c c el σ ε = [2]
where σc is the concrete stress applied in the restrained specimen. The creep strain (εcr)
in the restrained specimen, which is the remaining unknown, can be determined with the following equation, assuming compatibility of strains:
) ( ) ( ) ( ) (t tot t el t sh th t cr =ε −ε −ε + ε [3]
where εsh+th is the strain measured in the unrestrained specimen (incl. the shrinkage and thermal components).
In such a restrained test, the stress in concrete is not constant and may even go in compression due to an initial expansion at very early age due to the hydration heat and/or swelling. After the cooling period, the concrete stress will reverse to tension when the rate of autogenous shrinkage is more significant. It is proposed to calculate the instantaneous tensile creep coefficient from the time at which the elastic strain and the change in creep strain become positive, such as:
) ( ) ( ) ( t t t el cr ε ε φ = ∆ [4]
where ∆εcr is the change in creep strain from the time at which the elastic strain becomes
positive (i.e. after initial expansion). Finally, the effective modulus of elasticity (Eeff) can be calculated as follows: ) ( 1 ) ( ) ( t t E t Eeff c φ + = [5]
Temperature Effects on Sensor Readings and Concrete Properties
Strain readings – Large-size HPC specimens can generate significant temperature increases during cement hydration. This temperature variation can affect the readings of electrical strain gauges (SG) installed on the embedded steel bars. This variation must be corrected during the testing to allow precise control of the degree of restraint and precise measurement of the total strain. In order to determine the true strain, one has to subtract the thermal output of the strain gauge (εto) from the strain reading (εrdg), correct for the difference between the thermal expansion coefficients of concrete (αc) and steel
(αs), and add the thermal strain based on the temperature change (∆T) measured in the
concrete after setting, as follows: ) ( ) ( ) ( ) (t rdg t to T s T t tot =ε −ε +α ∆ ε [6]
The thermal output of the strain gauges was determined from laboratory experiments using an environmental chamber, in which strain gauges mounted on unrestrained reinforcing steel bars were subjected to a temperature (T) varying from -20°C to +40°C.
Relative humidity readings – Temperature influences the readings of relative humidity (RH) sensors. In order to remove this fluctuation (especially during the exothermic cement hydration reaction), the following equation proposed by Pruckner and Gjorv (2001) was used to normalize RH readings to a temperature of 25°C:
− − = ) ( ) ( 1 298 1 100 ) ( ln ) ( exp ) ( ) ( 298 t T B A t T t RH t T A t RH t RH K [7]
where the parameters A (0.11784 N/m) and B (0.000154 N/m/K) are constants that define the surface tension of the pore water as a function of concrete temperature. Coefficient of thermal expansion – In order to remove the effect of temperature (thermal strain, εth) from the strain measured in the unrestrained specimen and to calculate the precise amount of non-thermally induced shrinkage (autogenous), the accurate value of the coefficient of thermal expansion (CTE) of concrete at early-age must be known. The CTE of cement-based materials is made up of two movements: the true kinetic thermal expansion coefficient and swelling pressure due to the flow of water between the gel and capillary pores. The influence of moisture movement in concrete on the CTE is
considerable; especially at early-ages with rapid changes in the kinetics of the concrete constituents and internal temperature variations due to heat of hydration.
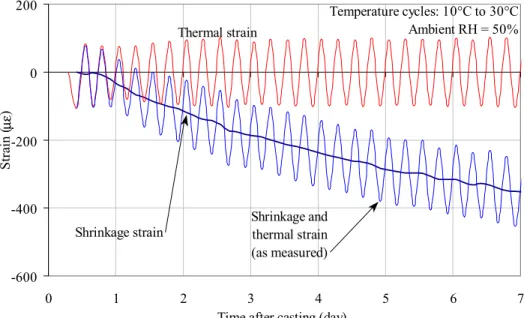
The concrete CTE was measured in the laboratory as a function of time. Three sealed concrete cubes (50x50x50mm) were tested in an environmental chamber with
temperature-calibrated LVDT’s. Temperature cycles, ranging from 10°C to 30°C, were performed for 7 days at the rate of 4 cycles per day. As illustrated in Figure 1, the measured shrinkage is the sum of 2 separable components, the shrinkage strain (found by averaging peak values of each temperature cycle) and the thermal strain. It is noted that the shrinkage values measured on these small cubes cannot be compared to
shrinkage values measured on concrete samples of different sizes and curing conditions. The temperature was monitored in each concrete cube during the experiment and was used to calculate the thermal expansion coefficient as a function of time:
) ( ) ( ) ( t T t t th c ∆ ∆ = ε α [8]
Figure 2 presents the CTE measured for the control concrete as a function of time after casting. An initial value of 7.3 µε/°C was found near setting time and increased linearly for 1.5 days until a more stable value of 10.3 µε/°C was reached. This increase in the CTE at the very early-age may be due to several factors including heat of hydration, and self-desiccation (hindering free exchange of moisture in the pores). These factors combined to create a rising apparent coefficient of thermal expansion at very early-age. It is clear that the use of a constant CTE of 10 µε/°C (as often done in practice) would result in underestimating the autogenous shrinkage during the first 36 hours.
Maturity – Temperature has a direct impact on the degree of hydration and the development of mechanical properties of concrete. Since significant heat is produced during the curing of large concrete specimens, mechanical properties develop at different rates, according to their different temperature sensitivities and the variation of
temperature during the test. In such tests, especially when measurements are made on specimens of different sizes (thus having different temperature histories during hydration), the time scale used for each measured property needs to be adjusted for comparison purposes by the use of the maturity concept. This concept assumes that two concrete specimens of identical formulations under different temperature histories will have the same values of a given mechanical property for a given maturity (Saul, 1949). The following equation was used to transform the time scale into a maturity scale, M(t). This is also known as the equivalent age calculated for a given reference temperature:
dt t T T R E t M t ref a ∫ + − + = 0 273 ( ) 1 273 1 exp ) ( [9]
where Ea is the activation energy for a given concrete formulation, R is the ideal gas
constant, Tref is the reference temperature (usually taken as 25°C). For the analysis presented in this paper, a Ea/R ratio of 4000 Kelvin was selected for this concrete
formulation, based on actual test results (Zhang et al. 2005) and recommendations from the current design codes for maturity calculations (CEB 1993, ACI 1997). This
procedure assumes that the temperature sensitivities of different properties of the same concrete are similar, which is an assumption accepted in most design codes.
Stress Calculation Procedure
The load was transmitted to the concrete of the restrained specimen by 4 continuous 10-mm reinforcing bars embedded in concrete. These bars were welded to stiff end plates connected to the rigid test frame (see Figure 3). This method of transmitting the tensile load to concrete is found to be representative of field structures and is a very precise load controlling technique. Other methods, such as pulling directly on the concrete with the use of enlarged ends encased in stiff steel caps, or pulling on steel anchors embedded in the ends of the concrete specimen were tried. These methods were found to be
unsatisfactory for the large specimen size used in this study.
When a restrained steel-reinforced concrete specimen is subjected to a tensile force (P), the strains in the reinforcing steel (εs) and concrete (εc) are:
) ( ) ( ) ( ) ( T t A E t P t R t s s s s = + +α ∆ ε [10] ) ( ) ( ) ( ) ( ) ( ) ( t T t t A t E t R t c sh c c c α ε ε = − + ∆ + [11]
where R is the internal reaction in the specimen; Es and As are the elastic modulus and
cross-sectional area of the steel reinforcement; and Ec and Ac are the elastic modulus
and cross-sectional area of the concrete. Assuming compatibility of strains between steel and concrete, the stress in concrete (σc) can be calculated as follows:
c s s tot s s s c A A E t t P A E t T t) ( ) () ( ) ( α ε σ = ∆ + − [12]
The reinforcing bars in the restrained specimen can create a small restraint in the ageing concrete. This partial restraint induced by the reinforcement is calculated as follows:
) (t E A E A E A k c c s s s s p + = [13]
With a total steel area of 400 mm2 and a concrete area of 39600 mm2 in the restrained specimen, it was found that kp stabilized at a value of 6% very shortly after setting of the
concrete. Since no reinforcement was used in the unrestrained companion specimen, the measured values of εsh+th in Eq. 3 was corrected by multiplying them by (1-kp),
otherwise the creep strain in the restrained specimen would be underestimated by 6%.
EXPERIMENTAL PROGRAM
Concrete Materials
The control concrete used Type 1 cement, had a cement-sand-aggregate ratio of 1:2:2 and a water-cement ratio of 0.34. A variation of this mix design was also tested, which included a 6% sand replacement by a pre-soaked structural lightweight aggregate (SLWA). Table 1 provides the concrete mix designs used in this study. The quantities indicated in Table 1 produced two large-size specimens for restrained and free shrinkage testing, and a number of small concrete samples for testing other mechanical properties. The concrete was prepared in a portable tumble concrete mixer with a 170-liter dry-batch capacity, and placed in wooden forms using a needle-type vibrator. The forms were not removed during testing to simulate field conditions, to avoid disturbing the sensors and their readings, and to prevent thermal shock. To prevent friction between the concrete and the forms, two layers of plastic sheets were used to line each side of the forms. Small concrete samples for secondary testing were placed in moulds and vibrated on a vibrating table. All specimens and samples were sealed with plastic sheets to prevent external drying shrinkage.
Table 1 also shows the slumps and air contents measured after mixing the concrete, and the compressive strengths measured on 100x200mm cylinders 7 days after casting. The 6% sand replacement by pre-soaked structural lightweight aggregate was not found to affect the slump, air content or compressive strength; the reason being that not enough pre-soaked lightweight aggregate was used to have an effect on these properties.
Experimental Apparatus and Procedures
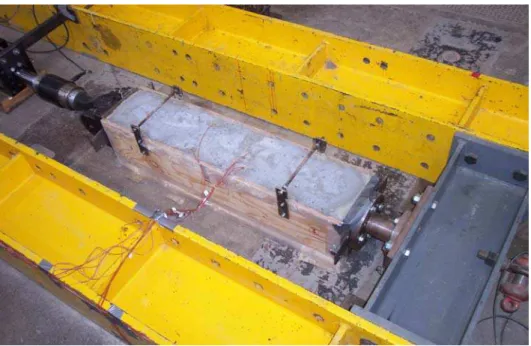
Figure 4 shows a photograph of the 200x200x1000mm restrained concrete specimen in the steel test frame. The specimen had a rigid connection at one end (right) and a pinned connection at the actuator end (left). Four 10-mm reinforcing bars were embedded in the restrained specimen with a concrete cover thickness of 50 mm (2.5 times the maximum aggregate size). The axial strain was measured with electrical strain gauges placed at the centre of the 4 reinforcing bars. The test apparatus included a closed loop servo
hydraulic system to control the actuator, using the rebar-mounted strain gauges as the feedback signal for the control loop. The force developing in the restrained specimen was measured by a load cell installed between the actuator and the specimen.
The unrestrained companion specimen, which was prepared in parallel to the restrained specimen, was of the same size and concrete formulation but did not include reinforcing bars (see Figure 3). Free shrinkage was measured axially with two LVDT’s, one placed at each end of the unrestrained specimen. Two relative humidity (RH) sensors were placed in the unrestrained specimen at mid-height for the determination of internal drying due self-desiccation. To avoid failure of the RH sensors due to excessive condensation on their heads, the sensors were inserted 8 hours after casting into plastic sleeves secured in fresh concrete at the time of placement. Embedded thermocouples (TC) were mounted in the forms of both specimens prior to casting, in the concrete and on the steel bars as shown in Figure 3.
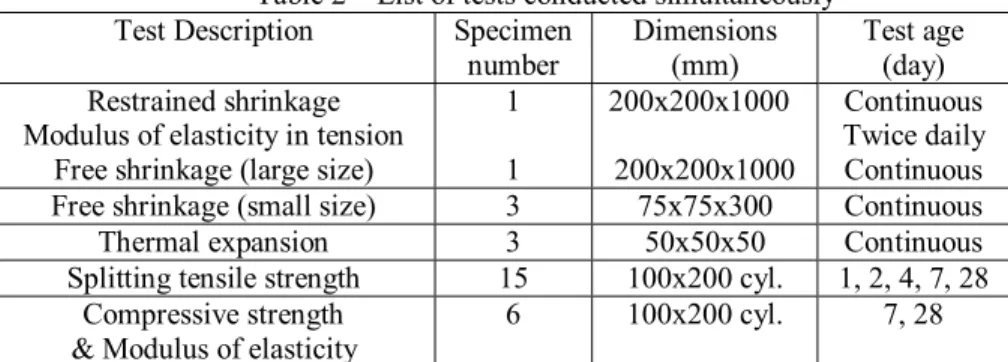
The readings from the sensors were recorded by a data logging system at 15-minute intervals for 7 days. When unload/reload cycles were performed, readings were taken at 15-second intervals. These cycles were performed periodically on the restrained specimen for determining the modulus of elasticity in tension. During such cycles, the load was reduced to 60% of its actual value at a rate of 1 kN/sec. The first cycle was performed 24 hours after casting and other cycles at a rate of 1 or 2 cycles per day. In this series of experiments, several tests were performed simultaneously in order to gather all the information needed for the calculations. As previously mentioned, the temperature history was measured for all concrete specimens and samples, maturity was calculated for each size of specimen involved in order to consistently use the different sets of results in the calculations. Table 2 gives a summary of the tests performed, and the size and number of specimens for each test.
RESULT ANALYSIS
Environmental Conditions
The free and restrained specimens were tested under realistic temperature regimes, i.e. no attempts were made to control the temperature of concrete during the experiment. Figure 5 presents the average temperature and average RH measured in the concrete specimens as a function of time after casting. The SLWA concrete reached a peak of 45°C compared to a peak temperature of 41°C for the control concrete. This small
difference is only due to the slightly different ambient temperatures during testing. The relative humidity curves for both concretes were found to decrease from 100% in fresh concrete to 93% within two days, and down to 91% at 7 days. This reduction in concrete RH is attributed to chemical reactions, including self-desiccation. It was found that most of the internal drying occurred in the first two days. No significant differences in internal drying were observed between the two concretes (less than 1% difference at any given time). With 6% sand replacement, there was not sufficient water from the lightweight aggregate to keep the concrete RH from being reduced.
Time of Initial Setting
The temperature data was used to define the time of initial setting, time at which strains and stresses were zeroed for the analysis. Figure 6 shows the rate of temperature measured in the specimen as a function of time after casting. It was assumed that initial setting occurred when the temperature rate began to increase sharply. Another
assumption was that initial setting marked the time the concrete began stiffening and, as a consequence, stresses started to develop in the concrete when restrained. Based on these assumptions, the measured setting times were 5 ½ hours for the control concrete and 10 hours for the SLWA concrete.
The above assumptions were confirmed by Figure 7, which presents the forces developing in the restrained specimen of the control concrete during the first 24 hours after casting. It is shown that the initial setting time, as defined above, corresponds exactly to the time at which the forces in concrete and the steel bars start to develop in opposite directions. It can also be observed that final setting occurred 6 hours later at the onset of a sharp increase in the tensile force.
Free Shrinkage Testing
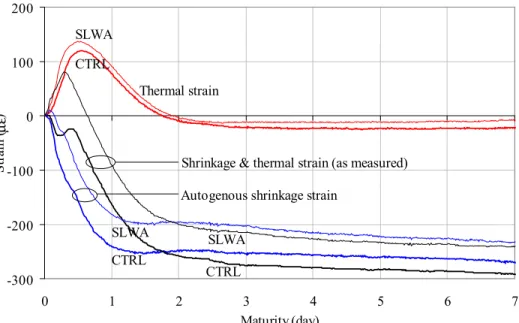
Figure 8 shows the measured strains (shrinkage and thermal together), the calculated thermal strains, and the resulting autogenous shrinkage strains as functions of time after initial setting for both concretes. It is interesting to observe how a small variation in the mix design can produce a significant difference in the measured strains. The SLWA concrete displayed a 75µε expansion 5 hours after setting, while the control concrete did not expand at all. It is believed that the beneficial expansion in the SLWA concrete was caused by the lower initial rate of autogenous shrinkage relative to the rate of thermal expansion. In the control concrete, however, the rate of autogenous shrinkage (which was higher than that of the SLWA concrete) was in fact high enough to offset the development of thermal expansion. After removal of thermal strain from the measured strain, the autogenous shrinkage curves showed a 30% higher strain after one day for the control concrete (260µε) than for the SLWA concrete (200µε). Marginal increases in autogenous strains were observed thereafter.
Figure 9 presents the same data seen in Figure 8 but as a function of maturity (or equivalent age for 25°C). This is equivalent to testing the specimens under isothermal conditions at a temperature of 25°C. In the remainder of this paper, all measured
properties of concrete will be presented using the maturity time scale, for comparison purposes with other tests conducted under different thermal conditions.
Restrained Shrinkage Testing
Figure 10 presents the degree of restraint used during testing of both concretes. The target degree of restraint selected for this experiment was 0.9. It will be shown later that a higher degree of restraint would have resulted in premature failure of the restrained specimens at very early age. The partial restraint provided by the reinforcing bars is also shown in Figure 10 and accounted for in the calculations.
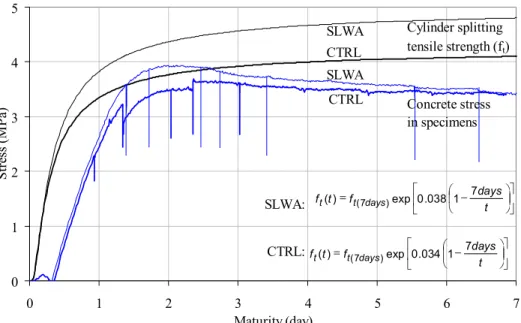
Figure 11 shows the direct tensile stresses developed in the restrained specimens due to restrained shrinkage and creep. The stress curves are compared to the strength curves, which were determined by regression analyses of splitting tensile strength test results obtained on 100x200mm cylinders. Reduction factors to account for the size difference between the specimens and cylinders and the difference in the mechanisms between direct and splitting tensile strengths were not used. It can be seen that both concretes came close to cracking at about 1.5 days of maturity.
Figure 12 presents the actual stress/strength ratio for both concretes. The SLWA concrete performed slightly better than the control concrete. A second pair of curves presents the risk of cracking normalized for a degree of restraint of 1.0, which is in fact the actual risk of cracking divided by actual degree of restraint. It is shown that both concretes would have cracked at the equivalent age of 1.5 days if the degree of restraint used during testing were 1.0 instead of 0.9.
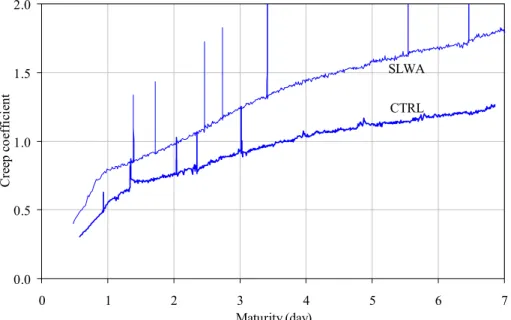
Figure 13, for the control concrete, and Figure 14, for the SLWA concrete, present different results measured and calculated for the restrained specimens (total strain, elastic strain, creep strain, and tensile strain capacity). One major difference worth noting between the two concretes is the tensile creep strain calculated with Equation 3. The large difference in creep strain at early-age was due to the difference in strains (εsh+th) measured in the unrestrained specimens (see Figure 9). Figure 15 illustrates the creep coefficient as a function of maturity for the 2 concretes. A higher creep coefficient was found for the SLWA concrete, with a 43% increase at 7 days.
Finally, the effective tensile modulus of elasticity is shown in Figure 16. Best-fit curves for the instantaneous tensile modulus of elasticity as a function of time are also shown. These curves were determined by regression analysis of the data collected during periodic unload/reload cycles on the large restrained specimens. The beneficial effect of tensile creep is clearly demonstrated, for instance, the effective modulus is half of the instantaneous modulus at 7 days. Due to creep, tensile stresses in the concrete were reduced by a factor of two at the equivalent age of 7 days.
SUMMARY AND CONCLUSIONS
In order to investigate different approaches for reducing restrained shrinkage stresses and cracking in HPC structures, a testing apparatus with new procedures was developed. It was used to compare the structural behaviour of two HPC mix designs, with and without the addition of SLWA – a formulation change designed to reduce shrinkage. The following conclusions can be drawn:
1. Restrained shrinkage and creep can be measured on large-size HPC specimens using embedded reinforcements to induce full or partial restraint.
2. A new approach is proposed for determining autogenous shrinkage and thermal strains. The approach includes measuring the concrete coefficient of thermal expansion as a function of time, while simultaneously accounting for temperature effects and maturity.
3. Autogenous shrinkage of the control HPC increased rapidly to a strain of 260 µε during the first 24 hours after setting, matched by significant internal drying. No major internal drying and autogenous shrinkage were found there after. Significant creep was developed; reducing the tensile stress by a factor of two.
4. A 6% sand replacement with pre-soaked porous expanded shale lightweight aggregate was found to reduce autogenous shrinkage by 33% at 1 day, increase the tensile creep coefficient by 43% at 7 days, and decrease the risk of cracking by 15% at 7 days, when compared to the control concrete. This small amount of lightweight sand was not found to have an effect on slump, air content, strength, or modulus of elasticity.
5. Further restrained shrinkage and creep tests will be conducted with higher amounts of this lightweight aggregate to find an optimum concrete mix design for improved shrinkage reduction and strength without compromising workability.
ACKNOWLEDGMENTS
The authors would like to acknowledge Mr. John Roberts of Northeast Solite
Corporation, for providing NRC with structural lightweight aggregate and funding. The authors would also like to thank Glendon Pye, Technical Officer at the NRC, for his technical assistance.
REFERENCES
ACI Committee 209 (1997): “Prediction of Creep, Shrinkage and Temperature Effects in Concrete Structures (209R-92, Re-approved 1997)”, ACI, Farmington Hills, USA, 47 p.
Bjontegaard, O., Kanstad, T., Sellevold, E.J., Hammer, T.A. (1999): “Stress Inducing
Deformations and Mechanical Properties of High-Performance Concrete at Very-Early-Ages”, 5th Int. Symposium On Utilization of High-Strength/High-Performance Concrete, Sandefjord, Norway, June 20-24, 1027-1040.
CEB (1993): “CEB-FIP Model Code 1990”, Information Bulletin No. 213/214, Euro-International Concrete Committee, Lausanne, Switzerland, 437 p.
Kovler, K. (1994): “Testing System for Determining the Mechanical Behaviour of Early-Age Concrete Under Restrained & Free Uniaxial Shrinkage”, Materials & Structures, 27, 324-330. Pruckner, F., Gjorv, O.E. (2001): “Measurements of Relative Humidity in Concrete”, 3rd Int.
Conference on Concrete Under Severe Conditions, Editors: N. Banthia, K. Sakai and O.E. Gjorv, Vancouver, Canada, 1489-1496.
Saul, A. G. A. (1949): “Principles underlying the steam curing of concrete at atmosphere pressure”, Magazine of Concrete Research, 1 (2), 79-88.
Sule, M., van Breugel, K. (2004): “The Effect of Reinforcement on Early-Age Cracking due to Autogenous Shrinkage & Thermal Effects”, Cement & Concrete Composites, 26, 581-587. Zhang, J., Cusson, D., Mitchell, L., Hoogeveen, T., Margeson, J. (2005): “Maturity Formulation
for the Microstructure and Mechanical Properties of High-Performance Concrete”, 7th International Symposium on Utilization of High-Strength/High-Performance Concrete, Washington, USA, June 20-24, 20 p.
TABLES AND FIGURES
Table 1 – Concrete mix designs (w/c=0.34)
Table 2 – List of tests conducted simultaneously Test Description Specimen
number Dimensions (mm) Test age (day) Restrained shrinkage
Modulus of elasticity in tension Free shrinkage (large size)
1 1 200x200x1000 200x200x1000 Continuous Twice daily Continuous Free shrinkage (small size) 3 75x75x300 Continuous
Thermal expansion 3 50x50x50 Continuous
Splitting tensile strength 15 100x200 cyl. 1, 2, 4, 7, 28 Compressive strength
& Modulus of elasticity
6 100x200 cyl. 7, 28
Note: Preliminary tests on instrumented bars included: (i) in environmental chamber for
temperature calibration, and (ii) in test frame for ensuring concentricity of axial loading.
Constituent Control Concrete SLWA Concrete Stone (20 mm) Normal-weight sand Light-weight sand Cement (ASTM type 1) Water
Superplasticizer (Disal, solid)
125.0 kg 125.0 kg -- 62.5 kg 21.25 kg 2.13 kg 125.0 kg 117.27 kg 7.73 kg 62.5 kg 21.25 kg 2.13 kg Slump Air content f’c at 7 days 215 mm 4 % 50 MPa 210 mm 5 % 50 MPa
Figure 1 – Temperature cycle testing on concrete cubes (Control Concrete) -600 -400 -200 0 200 0 1 2 3 4 5 6 7
Time after casting (day)
St ra in (µε ) Temperature cycles: 10°C to 30°C Ambient RH = 50% Shrinkage and thermal strain (as measured) Shrinkage strain Thermal strain
Figure 2 – Coefficient of thermal expansion (Control Concrete) 6 7 8 9 10 11 0 1 2 3 4 5 6 7
Time after casting (day)
CTE ( µε /° C) Average of three concrete samples
Figure 3 – Dimensions of test specimens
Figure 4 – Restrained concrete specimen in steel test frame
TC RH/T RH/T
LVDT TC
Elevation of unrestrained specimen (1000x200mm)
Elevation of restrained specimen (1000x200mm)
Cross-section (200x200mm) Cross-section (200x200mm) Pinned end connected to actuator Fixed end connected to stiff frame SG and TC at midlength of each rebar 10mm rebars 50mm cover
Figure 5 – Temperature and relative humidity in concrete specimens 20 25 30 35 40 45 50 0 1 2 3 4 5 6 7
Time after casting (day)
T em p er at u re ( °C ) 85 90 95 100 Re la tiv e h u m id ity ( % ) Average concrete temperature Concrete RH
Ambient lab temperature CTRL CTRL SLWA SLWA CTRL SLWA
Figure 6 – Definition of setting time (Control Concrete) -4 -2 0 2 4 6 0 4 8 12 16 20 24 28 32 36
Time after casting (hour)
T em pe ra tu re r at e ( °C /hour ) 20 25 30 35 40 45 T em p er at u re ( °C ) Time of initial setting Concrete temperature
Ambient lab temperature Temperature
Figure 7 – Forces in restrained specimen - 1st day (Control Concrete) -20 -10 0 10 20 30 0 4 8 12 16 20 24 28 32 36
Time after casting (hour)
F o rc e (k N) Force in rebars Total force in specimen (up to 145 kN) Force in concrete
Initial setting time
Final setting time
Figure 8 – Concrete strains in unrestrained specimen -300 -200 -100 0 100 200 0 1 2 3 4 5 6 7
Time after initial setting (day)
St ra in ( µε )
Shrinkage & thermal strain (as measured) Autogenous shrinkage strain
Thermal strain CTRL CTRL SLWA CTRL SLWA SLWA
Figure 9 – Concrete strains in unrestrained specimen -300 -200 -100 0 100 200 0 1 2 3 4 5 6 7 Maturity (day) St ra in (µε )
Shrinkage & thermal strain (as measured) Autogenous shrinkage strain
Thermal strain CTRL SLWA CTRL SLWA CTRL SLWA
Figure 10 – Degree of restraint in restrained specimen 0.0 0.2 0.4 0.6 0.8 1.0 0 1 2 3 4 5 6 7 Maturity (day) D egr ee of r es tr ai n t Total restraint (from actuator & rebars)
Partial restraint (from rebars only) Temporalily partial
unloading to prevent specimen failure
CTRL SLWA
Due to unload/reload cycles for the calculation of the tensile modulus of elasticity
Figure 11 – Tensile stress in restrained specimen 0 1 2 3 4 5 0 1 2 3 4 5 6 7 Maturity (day) S tre ss (M P a) Concrete stress in specimens Cylinder splitting tensile strength (ft) CTRL SLWA CTRL SLWA SLWA: CTRL: − = t days f t f t ( ) t ( 7 days) exp 0 .034 1 7 − = t days f t f t ( ) t ( 7 days) exp 0. 038 1 7
Figure 12 – Stress/strength ratio in restrained specimen 0.0 0.2 0.4 0.6 0.8 1.0 1.2 0 1 2 3 4 5 6 7 Maturity (day) S tr es s/s tre n g th ra tio Hypothetical failure (if K had been 1.0)
CTRL
Figure 13 – Concrete strains in restrained specimen (Control Concrete) -100 -50 0 50 100 150 0 1 2 3 4 5 6 7 Maturity (day) St ra in (µε ) Elastic strain Creep strain
Tensile strain capacity
Total strain
Figure 14 – Concrete strains in restrained specimen (SLWA Concrete) -100 -50 0 50 100 150 0 1 2 3 4 5 6 7 Maturity (day) St ra in (µε ) Elastic strain Creep strain
Tensile strain capacity
Figure 15 – Creep coefficient of concrete in restrained specimen 0.0 0.5 1.0 1.5 2.0 0 1 2 3 4 5 6 7 Maturity (day) C reep co ef fi ci en t CTRL SLWA
Figure 16 – Tensile modulus of elasticity of concrete in restrained specimen 0 10000 20000 30000 40000 0 1 2 3 4 5 6 7 Maturity (day) M odul us ( M P a) Secant modulus of elasticity Effective modulus of elasticity CTRL SLWA CTRL SLWA − = (7 )exp0.0391 7 0.50 ) ( t days E t Ec c days − = (7 ) 0.50 7 1 040 . 0 exp ) ( t days E t Ec c days