Aspects of the mechanics of metallic glasses
by
David Lee Henann
B.S., State University of New York at Binghamton (2006)
S.M., Massachusetts Institute of Technology (2008)
Submitted to the Department of Mechanical Engineering
in partial fulfillment of the requirements for the degree of
Doctor of Philosophy
at the
Massachusetts Institute of Technology
June 2011
ARCHNVES
MASSACHUSETS INSTMd)TE OF TECHNOLOGYJUL 2
9
2011
LIBRARIES
©
Massachusetts Institute of Technology 2011. All rights reserved.
A u th o r ... ... . ... . .... .. . a. 4 .. .. .. ...
Autharrtment
of Mechanical Engineering
May 23, 2011
Ai
Certified by ...
Lallit Anand
Rohsenow Professor of Mechanical Engineering
Thesis Supervisor
A ccepted by ... .... . . .. ...
David E. Hardt
Chairman, Department Committee on Graduate Students
Aspects of the mechanics of metallic glasses
by
David Lee Henann
Submitted to the Department of Mechanical Engineering on May 23, 2011, in partial fulfillment of the
requirements for the degree of Doctor of Philosophy
Abstract
Metallic glasses are amorphous materials that possess unique mechanical properties, such as high tensile strengths and good fracture toughnesses. Also, since they are amorphous, metallic glasses exhibit a glass transition, and at temperatures above this glass transition, they soften dramatically and are therefore amenable to net-shape thermoplastic forming processes. This combination of superior properties and the ability to precisely form complex geometries makes metallic glasses attractive materials for structural applications. This thesis addresses several issues related to the mechanics of these materials:
" Metallic glasses are near-"ideal" isotropic materials. We have conducted numerical experiments - using molecular dynamics simulations - to develop a continuum-level isotropic elastic free energy that accounts for volumetric-deviatoric coupling effects under circumstances involving large volumetric strains.
" We have developed a large-deformation, elastic-plastic constitutive theory for metal-lic glasses that incorporates a cavitation mechanism to describe the onset of "brit-tle" failure. Using this theory, we have conducted finite element simulations of frac-ture initiation at notch tips in a representative metallic glass under Mode-I, plane-strain, small-scale-yielding conditions. We show that our theory predicts important experimentally-observed, fracture-related phenomena in metallic glasses.
" We have developed a large-deformation, elastic-viscoplastic constitutive theory in a temperature range, which spans the glass transition of these materials. The numerical simulation capability based on the theory is used to determine appropriate processing parameters in order to carry out a successful micron-scale hot-embossing operation for the thermoplastic forming of a Zr-based metallic glass tool for the manufacture of polymeric microfluidic devices.
* The numerical simulation capability is also used to study surface tension-driven shape-recovery of a Pt-based metallic glass and quantitatively determine the surface tension of this material above the glass transition.
Thesis Supervisor: Lallit Anand
5
Acknowledgments
My graduate career has been completed with the support of many people. First and fore-most, I would like to express my gratitude to my advisor Professor Lallit Anand for his direction, guidance, and financial support. His dedication to the field of mechanics and ma-terials and the integrity of his research will be a standard for me throughout my career. My thesis committee, Professor David Parks, Professor Radl Radovitzky, and Professor Christo-pher Schuh, have provided important input and feedback to my research. Furthermore, the support of Ray Hardin and Leslie Regan has been invaluable to my graduate experience.
The Mechanics and Materials group at MIT is an engaging and fun community. I would like to thank my friends and colleagues Shawn Chester, Vikas Srivastava, Kaspar Loeffel, Claudio Di Leo, Mary Cookson, Suvrat Lele, Nicoli Ames, Meredith Silberstein, Timothy Johnson, Allison Beese, and Matteo Salvetti. In particular, I am indebted to Shawn and Vikas for their constructive criticism and collaboration.
Finally, I thank my parents for their constant encouragement and interest in my aca-demic pursuits, and last but not least, my fiance Stephanie for her constant support and companionship. I will be forever grateful to MIT for giving me the opportunity to meet her. Financial support for this research was generously provided by grants from the NSF (CMS-0555614) and the Singapore-MIT Alliance (MST).
Contents
List of Figures 11
List of Tables 15
1 Introduction 17
1.1 Background ... ... ... ... .. 17
1.2 Contributions of thesis and related publications . . . . 19
1.2.1 A finite elasticity theory for isotropic materials . . . . 19
1.2.2 Fracture of metallic glasses at notches . . . . 19
1.2.3 Mechanics of metallic glasses in a temperature range spanning the glass transition . . . . 20
1.2.4 Surface tension-driven shape-recovery of metallic glasses . . . . 21
1.3 Structure of thesis ... ... 21
2 A large strain isotropic elasticity model based on molecular dynamics sim-ulations of a metallic glass 23 2.1 Introduction . . . . 23
2.2 A simple free energy function that couples the deviatoric and volumetric re-sponse ... ... 27
2.3 Molecular dynamics simulations . . . . 28
2.3.1 Preparation of a metallic glass specimen . . . . 29
2.3.2 Numerical experiments on the metallic glass specimen . . . . 30
2.3.3 Volumetric dilatation/compaction . . . . 32
2.3.4 Pure shear . . . . 33
2.3.5 Volumetric deformation followed by pure shear . . . . 33
2.3.6 Pure shear followed by volumetric deformation . . . . 35
2.4 Specialization of the functions g(e) and p(e) . . . . 35
2.4.1 Determination of the function g(e) . . . . 36
2.4.2 Determination of the function p(e) . . . . 38
2.5 Pressure-dependence of the plastic flow strength . . . . 39
2.6 Concluding remarks . . . . 41
3 The Anand-Su large-deformation, elastic-viscoplastic constitutive theory for metallic glasses 43 3.1 Introduction . . . . 43
3.2 Constitutive theory . . . . 44
3.2.1 Elasticity relations: free energy, equation for the stress . . . . 44
3.2.2 Plasticity relations: flow rule, evolution equations for internal variables 45 3.3 Concluding remarks . . . . 49
4 Fracture of metallic glasses at notches: effects of notch-root radius and the ratio of the elastic shear modulus to the bulk modulus on toughness 51 4.1 Introduction . . . . 51
4.2 Constitutive theory . . . . 55
4.2.1 Modification of the elasticity relations . . . . 56
4.2.2 Specialization of the plasticity relations for low homologous temperatures 58 4.2.3 Fracture criterion . . . . 60
4.3 Material parameters used in numerical simulations . . . . 61
4.4 Simulations of fracture at notches under Mode-I, plane-strain, small-scale-yielding conditions . . . . 65
4.4.1 Effect of notch-root radius . . . . 69
4.4.2 Effect of elastic parameters . . . . 71
4.5 Concluding remarks . . . . 72
5 A constitutive theory for the mechanical response of amorphous metals at high temperatures spanning the glass transition 77 5.1 Introduction . . . . 77
5.2 Specialization of the constitutive equations . . . . 78
5.2.1 The Spaepen model . . . . 78
5.2.2 Modified Spaepen model . . . . 80
5.3 Stress-strain response of the metallic glass Zr41.2 Ti13.8Cu1 2.5NiioBe2 2.5 . . . . 83
5.4 Concluding remarks . . . . 88
5.4.1 A corresponding, simplified Mises-type theory . . . . 88
6 Metallic glasses: viable tool materials for the production of surface mi-crostructures in amorphous polymers by micro-hot-embossing 91 6.1 Introduction . . . . 91
6.2 Micro-hot-embossing of metallic glasses . . . . 93
6.2.1 Finite element simulation . . . . 95
6.2.2 Experimental procedures and results . . . . 97
6.4 Production of small-scale, high-aspect-ratio, high-density micropatterned
sur-faces . . . 105
6.5 Concluding rem arks . . . 105
7 Surface tension-driven shape-recovery of micro/nanometer-scale surface features in a Pt5 7.5Ni5.3Cu14.7P2 2.5 metallic glass in the supercooled liquid region 7.1 Introduction . . . . 7.2 Constitutive theory . . . . 7.3 Material parameters for the metallic glass Pt5 7.5 Ni5.3Cu1 4.7P22.s 7.4 Numerical simulations of surface tension-driven shape-recovery 7.4.1 Traction boundary condition for surface tension . . . . . 7.4.2 Estimate of the surface tension of Pt5 7.Cup. 7Ni5.3P2 2.5 . 7.4.3 Validation of the simulation capability . . . . 7.4.4 Scaling considerations for the shape-recovery process . . 7.5 Concluding remarks. . . . . 8 Conclusion 8.1 Sum m ary . . . . 8.2 O utlook . . . . 109 . . . 109 . . . . . 112 . . . . . 113 . . . . . 114 . . . . . 116 . . . 116 . . . 119 . . . 123 . . . 126 127 . . . . . 127 . . . . . 128 Bibliography A Molecular dynamics simulations of isochoric tension and isochoric com-pression B Molecular dynamics simulations of deformation of metallic glasses at low homologous temperatures C Convergence tests for Mode I, plane-strain, small-scale-yielding simula-tions [31 [41 L45 151 D A heuristic procedure for material parameter estimation 155 D.1 Estimation of the parameter list MP1 . . . 156
D.2 Estimation of the parameter list MP2 . . . 159
D.3 Estimation of the parameter list MP3 . . . 161
List of Figures
2-1 Specific volume and specific enthalpy versus temperature . . . . 29
2-2 The radial distribution functions in the quenched state . . . . 30
2-3 Schematic and snapshot of the undeformed configuration . . . . 30
2-4 Schematic and snapshots of the dilated and sheared configurations . . . . 31
2-5 Variation of the mean stress with elastic volumetric strain . . . . 33
2-6 The radial distribution functions for Zr-Zr pairs, showing evidence of strain-induced ordering at high compressive volumetric strains, and a snapshot of a slice of the molecular specimen, demonstrating cavitation-related failure . . . 34
2-7 Variation of the shear stress and the mean stress with elastic shear strain . . 35
2-8 Variation of the shear stress with shear strain at several levels of volumetric strain and variation of the shear modulus with volumetric strain . . . . 36
2-9 Variation of the mean stress with volumetric strain at two levels of fixed shear strain and variation of the shear stress with volumetric strain at two levels of fixed shear strain . . . . 37
2-10 Variation of the shear stress with shear strain at several levels of volumetric strain and the variation of the flow stress with volumetric strain . . . . 40
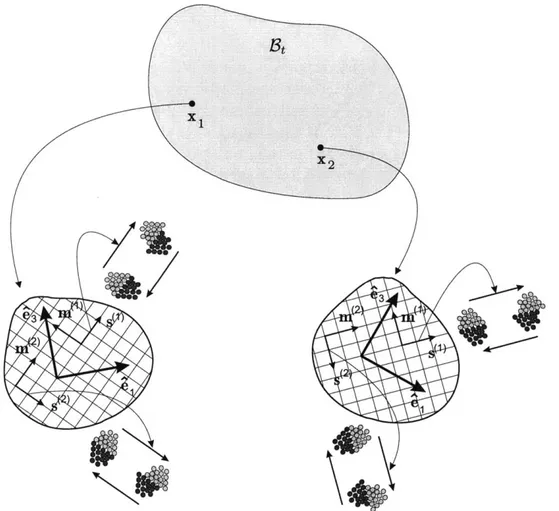
3-1 Schematic of plastic flow by atomic-scale shear transformations on microscopic "slip systems" in the Anand-Su model for metallic glass plasticity . . . . 46
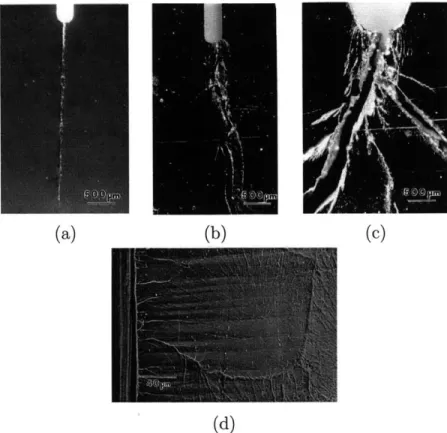
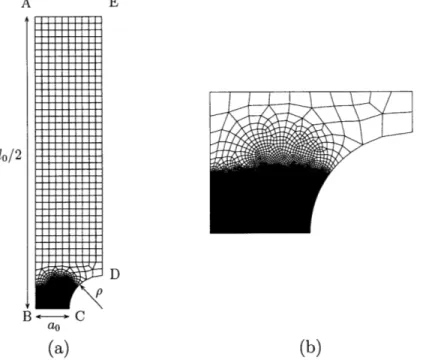
4-1 Notched tensile specimen and micrographs of the failure surface of 1.25 mm notch-root radius bar . . . . 52
4-2 Typical macroscopic crack-path profiles of specimens tested with different notch-root radii . . . . 53
4-3 Relationship between normalized mean normal stress, and normalized elastic volum etric strain . . . . 58
4-4 Stress-strain response of a single element in simple tension and compression (absolute values) and simple shear . . . . 62
4-5 Initial finite element mesh for a notched-tension specimen . . . . 62
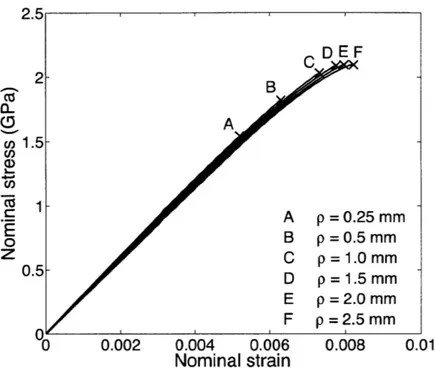
4-7 Failure stress versus notch-root radius in notched-tension specimens . . . . . 64 4-8 Contours of volumetric elastic strain, mean normal stress, and equivalent
plas-tic strain immediately prior to the initiation of cavitation in a notched-tension simulation, and initiation of cavitation in the region ahead of the plastic zone where the volumetric elastic strain and mean normal stress are the highest . 65 4-9 Initial finite element configuration for Mode-I loading . . . . 66 4-10 Reaction force versus loading parameter for different notch-root radii, and
variation of fracture toughness with notch-root radius . . . . 68 4-11 Variation of equivalent plastic strain, volumetric elastic strain, and mean
nor-mal stress along the line ahead of the notch tip . . . . 69 4-12 State immediately prior to the initiation of cavitation, and progressive stages
of the cavitation failure . . . . 70 4-13 Reaction force versus loading parameter for different combinations of elastic
m odu li . . . . 72 4-14 The variation of plane-strain fracture toughness with the ratio of the elastic
shear modulus to the bulk modulus and Poisson's ratio . . . . 73 4-15 Initial finite element mesh configurations for three-point-bending of a
U-Notched beam and a V-U-Notched beam, and reaction force versus displacement for each case . . . . 74 5-1 Stress-strain curves for Vitreloy-1 at various temperatures and strain rates 84 5-2 Stress-strain curves for Vitreloy-1 at various temperatures and strain rates 85
5-3 Stress-strain curves from strain rate decrement and increment experiments for V itreloy-1 . . . . 86 5-4 Steady-state stress and viscosity as a function of temperature and strain rate 87 6-1 A schematic time-temperature-transformation (TTT) diagram for a typical
glass-form ing alloy . . . .. 95 6-2 Plane strain micro-hot-embossing experimental and simulation configurations 96
6-3 Plane strain micro-hot-embossing experimental and simulation results . . . . 98
6-4 Plane strain micro-hot-embossing experimental and simulation comparison 98 6-5 SEM images of the silicon master and resulting metallic glass part and
corre-sponding optical profilometry measurements for a concentric ring pattern and a gear-like geom etry . . . .. 99 6-6 A schematic of the micromixer pattern . . . 100 6-7 SEM micrographs of features in the silicon master and corresponding features
in the m etallic glass tool . . . 101 6-8 SEM micrographs of features in a PMMA part and features in a Zeonex part 103 6-9 SEM micrographs of one of the straight portions on a metallic glass tool that
has been unused and subjected to ~ 350 embossing cycles . . . . 104 6-10 Comparison of the cross-sectional profiles from corresponding straight sections
6-11 SEM images summarizing the micro-hot-embossing of small-scale,
high-aspect-ratio, high-density surfaces . . . 106
7-1 SEM micrographs of pyramidal microfeatures of two different initial heights after annealing . . . ... . . . . .. . . .. .. .. .. .. .. .. .. 110
7-2 Viscosity as a function of strain rate and temperature . . . 115
7-3 Initial finite element mesh configuration for the simulations of the shape-recovery of raised pyramidal microfeatures . . . . 118
7-4 Feature height h as a function of annealing time at 543 K for the pyramidal microfeatures of three different initial heights . . . . 119
7-5 SEM micrographs and corresponding numerical predictions of the largest pyra-midal feature after annealing . . . . 120
7-6 Initial finite element mesh configuration for the simulations of the shape-recovery of residual Berkovich indents . . . . 121
7-7 Residual indent depth h as a function of annealing time for residual Berkovich indents.. ... ... ... ... ... ... 122
7-8 Experimentally-measured topographic contour plots and corresponding simu-lated contour plots of the largest residual Berkovich indent after annealing 124 7-9 Normalized feature height as a function of normalized annealing time . . . . 125
A-1 Schematics of the deformed configuration of the body in isochoric extension and isochoric compression . . . . 142
A-2 Variation of the shear stress and the mean normal stress with elastic shear strain in iscohoric extension and isochoric compression . . . . 143
B-1 Specific enthalpy versus temperature . . . . 146
B-2 The radial distribution functions in the quenched state . . . . 146
B-3 Snapshot of the quenched configuration . . . . 147
B-4 Schematics of the undeformed and strained configurations for simple tension 148 B-5 Stress-strain curve for simple tension in two dimensions and snapshots of the MD configuration at four stages of deformation . . . 149
B-6 Schematic of the reference configuration for indentation . . . 150
B-7 Snapshots of the MD configuration at various indentation depths . . . 150
C-1 Demonstration of convergence with respect to the outer radius with a fixed notch-root radius . . . 152
C-2 Close-up of the mesh at the notch root for meshes of varying refinement and reaction force versus loading parameter for each of these cases . . . 153
D-1 Schematic of the fit of compensated strain rate to temperature-com pensated stress. . . . 157
D-2 Free volume concentration as a function of temperature. . . . 158
D-3 Activation energy and activation volume as a function of temperature . . . . 159
14
D-5 Temperature dependence of elastic parameters . . . . 162 E-1 Schematics of a free surface in a two-dimensional, plane-strain setting, using
four-node reduced-integration elements and in a three-dimensional setting, using eight-node fully-integrated elements . . . 165
List of Tables
4.1 Combinations of elastic moduli used in the Mode-I notch-tip simulations. . . D.1 Material parameter list 1 . . . . D.2 Material parameter list 2 . . . . D.3 Material parameter list 3 . . . .
71 159 160 161
Chapter 1
Introduction
1.1
Background
Under slow-to-moderate cooling rates most metallic materials solidify in a polycrystalline form. However, under high cooling rates, certain metallic alloys solidify in a disordered form; such disordered metals are referred to as amorphous metals or metallic glasses. The first amorphous Au-Si metallic glass was developed in thin ribbon form using a very high cooling rate of ~ 105 - 106 K/s by Klement et al. [1], but by the late 1980s and early 1990s it was discovered that metallic glasses could be processed at relatively slow cooling rates (1 - 100 K/s) in bulk form in certain multi-component alloy systems due to the slug-gish crystallization kinetics in these alloys [e.g., 2-4]. Due to the lack of long-range order, metallic glasses possess unique mechanical properties, which make them attractive materials for fabricating components for a variety of applications. For example, the commercial Zr-based alloys exhibit a reasonably high Young's modulus (~a90 GPa), high tensile strength
(~~2.0
GPa), high yield strain (~2%), good fracture toughness (~ 10-50 MPa i), and good wear resistance (e.g., [2, 3, 5]). A particularly important characteristic of metallic glasses istheir intrinsic homogeneity to the nanoscale because of the absence of grain boundaries. This
characteristic, coupled with their unique mechanical properties, makes them ideal materi-als for fabricating micron-scale components, or high-aspect-ratio micro-patterned surfaces, which may in turn be used, for example, as dies for the manufacture of polymeric microfluidic devices.
When a metallic glass is deformed at ambient temperatures, well below its glass transition temperature, its inelastic deformation is characterized by strain-softening, which results in the formation of intense localized shear bands. Fracture typically occurs after very small inelastic strain in tension, but substantial inelastic strain levels can be achieved under states of confined compression, such as in indentation experiments [cf., e.g., 6-9].
The micro-mechanisms of inelastic deformation in metallic glasses are not related to dislocation-based mechanisms that characterize the plastic deformation of crystalline
met-als. The plastic deformation of amorphous metallic glasses is fundamentally different from that in crystalline solids because of the lack of long-range order in the atomic structure of these materials. The underlying atomistic mechanisms of the inelastic deformation of metal-lic glasses have been under intense investigation for the past three decades, and are still not completely understood [cf., e.g., 6-16]. However, atomistic simulations reported in the literature [cf., e.g., 10, 13-16] show that at a micromechanical level, inelastic deformation in metallic glasses occurs by local shearing of clusters of atoms (~10 to 30 atoms), this shearing is accompanied by deformation-induced microstructural disordering and inelastic
dilatation that produces strain-softening, which at low homologous temperatures leads to the
formation of intense shear bands. The importance of dilatancy in the inelastic response and shear localization of soils and other granular materials, which consist of randomly packed grains, goes back to Reynolds in 1885 [17], who applied the term "dilatancy" to the property possessed by a mass of granular material to alter its volume in accordance with a change in the arrangement of its grains. While the density changes in shear bands in soils are large enough to be experimentally measureable, those in the shear bands in metallic glasses are usually quite small, < 0.5%, and difficult to measure experimentally [18], and even difficult to discern in atomistic simulations [14].
When a metallic glass is deformed at an absolute temperature in the range 0.719g < <
79X, where
og
and Ox are the glass transition and crystallization temperatures, respectively, itsinelastic response is highly rate-dependent, and it deforms approximately "homogeneously" [6]. Indeed in the supercooled liquid rage
Og
< V < dx many metallic glasses are known toshow superplastic behavior at sufficiently slow strain rates [19].
In recent years, an extremely promising method called thermoplastic forming has emerged [cf., e.g., 19-24]. In this process, the metallic glass is first obtained in the amorphous state by traditional die-casting. The shape in this step is not the final shape but in the form of simple plates or rods. The metallic glass plate (or rod) is then heated into the supercooled liquid region above the glass transition temperature of the material, where it may be isothermally formed to produce intricate microscale patterns and then slowly cooled. Since metallic glasses in their supercooled region are metastable, they eventually crystallize; however, the crystallization kinetics in metallic glass alloys are sluggish, and this results in a relatively
large temperature-time processing window in which thermoplastic forming may be carried out without crystallization.' Further, since the forming is done isothermally and the subsequent cooling is rather slow, and since there is no phase change on cooling, residual stresses and part distortion can be minimized - all factors which potentially allow for a forming process which is much better controlled than die-casting. A specific thermoplastic forming process geared towards producing nano/microscale, high-aspect ratio, patterned features on surfaces is that
of micro-hot-embossing. In this process, the metallic glass is formed in its supercooled liquid
region by pressing it against a master-surface with the desired nano/microscale features (usually a patterned silicon wafer). The viability of this process has been demonstrated extensively in the literature [cf., e.g., 19-24].
'The temperature-time processing window for thermoplastic forming is typically much larger than that afforded by die-casting.
1.2
Contributions of thesis and related publications
This thesis address several issues related to the mechanics of metallic glasses, which are summarized below. Publications in peer-reviewed journals related to each aspect of this work are also listed.
1.2.1
A finite elasticity theory for isotropic materials
It has been shown by Anand [25, 26] that when the infinitesimal strain measure is replaced with Hencky's logarithmic finite strain measure in the classical strain-energy function of linear isotropic elasticity [27-29], the theory is in good agreement with experiments for a wide variety of materials for moderately large deformations, i.e. principal stretches ranging from approximately 0.7 to 1.3. Importantly, the shear and bulk moduli in this theory may still be determined from experimental data at infinitesimal strains. Consequently, all moderate strain non-linearities are incorporated in the logarithmic strain measure. However, when large volumetric strains, either in dilatation or compaction, are attained, this simple finite-deformation hyperelasticity model must be extended to account for such situations, and also to account for important volumetric-deviatoric coupling effects.
Since it is difficult to conduct physical experiments to determine volumetric-deviatoric coupling effects under circumstances involving large volumetric strains, we have conducted numerical experiments - using molecular dynamics simulations. Since we are concerned with a free energy function for isotropic materials, in our molecular dynamics simulations we considered an amorphous metallic glass as our representative isotropic material. Based on the results of these numerical experiments, we have developed a continuum-level isotropic elastic free energy that captures the observed coupling effects. The proposed free energy is simple and provides a very good description of the stress-strain results from our molecular dynamics simulations.
Further, plastic flow in metallic materials is known to be "pressure sensitive" - a sensitiv-ity that cannot be ignored at high pressures; accordingly, we have also examined the effect of the volumetric strain on the effective shear stress required for the onset of plastic flow in the metallic glass, and correlated this dependence with the numerically-observed dependence of the elastic shear modulus on the volumetric strain.
e D. L. Henann and L. Anand. A large strain isotropic elasticity model based on molecu-lar dynamics simulations of a metallic glass. Journal of Elasticity, doi:10.1007/s10659-010-9297-y.
1.2.2
Fracture of metallic glasses at notches
Experimental observations in the literature reveal some important intrinsic features of the fracture response of metallic glasses at low homologous temperatures:
1. The notch toughness, Kc, of metallic glasses decreases as the notch-root radius, p, decreases, with Kc decreasing linearly with p [30, 31].
2. Fracture in notched specimens initiates ahead of the notch root where the mean normal stress reaches a maximum value [32].
3. As the ratio p// of the elastic shear modulus y to the bulk modulus r, increases, the toughness Kc decreases, that is, the material becomes more brittle [33].
Motivated by the free energy function based on our molecular dynamics simulations from the previous section, we introduce an important modification of the finite elasticity relation in the large deformation elastic-plastic Anand-Su theory for metallic glasses [34, 35] to account for the strongly nonlinear and eventually softening, dilatational volumetric elastic response of the material. Using this theory we have conducted finite element simulations of fracture initiation at notch tips in a representative metallic glass under Mode-I, plane-strain, small-scale-yielding conditions. We show that the modified theory predicts three important experimentally-observed phenomena enumerated above.
9 D. L. Henann and L. Anand. Fracture of metallic glasses at notches: Effects of notch-root radius and the ratio of the elastic shear modulus to the bulk modulus on toughness.
Acta Materialia, 57:6057-6074, 2009.
1.2.3
Mechanics of metallic glasses in a temperature range
span-ning the glass transition
There is no generally accepted constitutive theory to model the large-deformation, elastic-viscoplastic response of bulk metallic glasses in the temperature range relevant to ther-moplastic forming. What is needed is a unified constitutive framework that is capable of capturing the transition from a visco-elastic-plastic solid-like response below the glass tran-sition to a Newtonian fluid-like response above the glass trantran-sition. We have developed a large-deformation, constitutive theory aimed to fill this need. The material parameters appearing in the theory have been determined to reproduce the experimentally-measured
[12] stress-strain response of Zr4 1.2Ti13.8Cu12.5NiioBe2 2.5 (Vitreloy-1) in a strain rate range of [10-5, 10-1] s-1, and in a temperature range [593,683] K, which spans the glass transition temperature
o
0g = 623 K of this material.We have implemented our theory in a finite element program [36], and this numerical simulation capability is used to determine appropriate processing parameters in order to carry out a successful micron-scale hot-embossing operation. By carrying out a correspond-ing physical experiment, we demonstrate that micron-scale features in a Zr-based metallic glass may be accurately replicated under the processing conditions determined by use of the
numerical simulation capability.
Further, we describe the thermoplastic forming of a tool made from this material, which has the (negative) microchannel pattern for a simple microfluidic device. This tool was successfully used to produce the microchannel pattern by micro-hot-embossing of the amor-phous polymers poly(methyl methacrylate) (,dg ~~ 388 K) and Zeonex-690R (,Og ~ 409 K)
above their glass transition temperatures. The metallic glass tool was found to be very ro-bust, and it was used to produce hundreds of high-fidelity micron-scale embossed patterns without degradation or failure.
* D. L. Henann and L. Anand. A constitutive theory for the mechanical response of amorphous metals at high temperatures spanning the glass transition temperature: Application to microscale thermoplastic forming. Acta Materialia, 56:3290-3305, 2008. " D. L. Henann, V. Srivastava, H. K. Taylor, M. R. Hale, D. E. Hardt, and L. Anand. Metallic glasses: viable tool materials for the production of surface microstructures in amorphous polymers by micro-hot-embossing. Journal of Micromechanics and
Micro-engineering, 19:115030, 2009.
1.2.4
Surface tension-driven shape-recovery of metallic glasses
Recent experiments in the literature show that micro/nano-scale features imprinted in a Pt-based metallic glass, Pt57.Ni5 .3CuM.7P2 2.5 (1g = 503K), using thermoplastic forming at a temperature above its glass transition temperature, may be erased by subsequent annealing at a slightly higher temperature in the supercooled liquid region [37]. The mechanism of shape-recovery is believed to be surface tension-driven viscous flow of the metallic glass. We have used existing experimental data in the literature for Pt5 7.5Ni5.3Cu1 4.7P22.5 [38] to estimate the material parameters appearing in our constitutive equations. We have also developed a numerical scheme for calculating surface curvatures and incorporating surface tension effects in finite element simulations. By carrying out full three-dimensional finite-element simulations of the shape-recovery experiments of Kumar and Schroers [37], and using the independently-determined material parameters for the bulk glass, we estimate the surface tension of Pt5 7.5Ni5.3Cu14.7P2 2.5 at the temperature at which the shape-recovery experiments were conducted. Finally, with the material parameters for the underlying elastic-viscoplastic bulk response as well as a value for the surface tension of the Pt-based metallic glass fixed, we validate our simulation capability by comparing predictions from our numerical simula-tions of shape-recovery experiments of Berkovich nanoindents, against corresponding recent experimental results of Packard et al. [39] who reported shape-recovery data of nanoindents on the same Pt-based metallic glass.
9 D. L. Henann and L. Anand. Surface tension-driven shape-recovery of micro/nanometer-scale surface features in a Pt5 7.Ni 5.3Cu14 .7P22.5 metallic glass in the supercooled liquid region: A numerical modeling capability. Journal of the Mechanics and Physics of
Solids, 58:1947-1962, 2010.
1.3
Structure of thesis
The structure of this thesis is as follows. We begin in Chapter 2 by presenting a large strain isotropic elasticity model based on molecular dynamics simulations of a metallic glass. The
22
Anand-Su large-deformation, elastic-viscoplastic constitutive framework for metallic glasses is presented in Chapter 3, and in Chapter 4 we describe our simulations of brittle fracture of metallic glasses at notches at temperatures below the glass transition. In Chapter 5, we specialize the theory to the high temperature range spanning the glass transition. Chap-ter 6 deals with the application of our theory to model microscale thermoplastic forming of metallic glasses and describes several corresponding micro-hot-embossing experiments. In Chapter 7, we simulate surface tension-driven shape-recovery of metallic glasses above the glass transition. We close in Chapter 8 with some final remarks and future research directions.
Chapter 2
A large strain isotropic elasticity
model based on molecular dynamics
simulations of a metallic glass
2.1
Introduction
Consider a homogeneous body B identified with the region of space it occupies in a fixed reference configuration, and denote by X an arbitrary material point of B.1 A motion of B is described by a smooth one-to-one mapping x = X(X, t), with deformation gradient given by F = VX, and J = det F > 0. The deformation gradient admits the polar decomposition F = VR, with V a symmetric positive definite (left) stretch tensor, and R a rotation tensor. The spectral representation of V is V = EI Aili 0 l, where (A1, A2, A3) and (11, 12, 13) are,
respectively, the lists of principal stretches and principal directions of V. For an isotropic,
hyperelastic material, the free energy per unit reference volume may be expressed in terms
of the principal stretches as
S= /(A1, A2, A3), (2.1)
'Notation: We use standard notation of modern continuum mechanics (cf., e.g., [40]). The symbols V and
Div denote the gradient and divergence with respect to the material point X in the reference configuration; grad and div denote these operators with respect to the point x = x(X, t) in the deformed configuration; a superposed dot denotes the material time-derivative. Throughout, we write Fe- 1 = (Fe)-i, FP-T =
(FP)-T , etc. We write sym A, skw A, AO, and syme A respectively, for the symmetric, skew, deviatoric, and symmetric-deviatoric parts of a tensor A. Also, the inner product of tensors A and B is denoted by A: B, and the magnitude of A by |Al = v/A: A.
with
4
invariant under the permutations of the integers (1, 2, 3). Corresponding to this free energy, the Cauchy stress T is given bywhere J = A1A2A3 > 0. T = J-' A 2 iol, i=1 A 3 E = lnV =Z Eli 3 li, i=1 Ej = ln Ai, (2.2) (2.3) (2.4) denoting the logarithmic strain, and
def
TK =JT
denoting the Kirchhoff stress, (2.2) may be written as 3 TKZ i=1 84(E1, E2
E
, 3) 13 0 li. aF, (2.5)The logarithmic elastic strain E has the important property that
trE = In J
represents a volumetric strain, and that the deviatoric part of E is given by Eo = ln(J-Y1/3V).
Choosing
Ii(E) = trE, I2(E) = trE2, and I3(E) = trE 3
as a list of three independent invariants of E, we may alternatively write the stress-strain relation (2.5) as
(2.9)
TK - 8(Ii(E), I12(E), 13(E))
K
=BE
Recall that in the classical linear theory of isotropic elasticity, with E = (1/2)(Vu + (Vu)T) the infinitesimal strain tensor, the free energy is taken as
$(E) = pol, ol2 + 2 fo(trE)2, (2.10)
where yo > 0 and Ko > 0 are the shear and bulk moduli. Motivated by the simple form of the expression for the strain energy of an infinitesimally-strained isotropic elastic body, one might ask whether an analogous expression, in which dependence upon the infinitesimal strain measure is replaced by dependence upon a finite strain measure, is capable of describing the behavior of a moderately-strained isotropic elastic body. A model of this type, using the With
(2.6)
(2.7)
logarithmic strain measure (2.3), was introduced by Hencky [27-29] and has the form
(E)= polEol12 + -o(tr E)2, (2.11)
2
where yo > 0 and Ko > 0 are the shear and bulk moduli from the classical infinitesimal theory. Anand [25, 26] has shown that the quadratic free energy function (2.11) and the corresponding stress relation,
TK - 2poEo + no(tr E)1, (2.12)
are in good agreement with experiments on a wide class of materials for principal stretches ranging between 0.7 and 1.3. Importantly, since the material constants yo and sO are the classical elastic constants, they may be determined from experimental data at infinitesimal strains. As a consequence of these results, it appears that all moderate-strain non-linearities are incorporated in the logarithmic strain measure. Indeed, for this reasonably large range of stretches, all other commonly used strain measures (including those of Green, Almansi, Swainger, Biot), when used to generalize the classical free energy for isotropic linear elasticity (using the values of po and ro determined from experimental data at infinitesimal strains), give predictions (for the elastic stress response of materials) which are in poor agreement with experiments.
More recently, guided by the universal binding energy relation (UBER) introduced by Rose et al. [41], Gearing and Anand [42] modified the Hencky [27-29] free energy function to account for large elastic volumetric strains. Specifically, with
def
E = trE = lnJ (2.13)
denoting the volumetric part of the logarithmic elastic strain, Gearing and Anand [42] pro-posed the following modification to (2.11):
,O(E) = po |Eo + Ko(c)2 I - (1 +
)
exp - , (2.14)where cc is a critical value of the elastic volumetric strain (a material parameter), and as before, po and ro are the ground-state shear and bulk moduli of infinitesimal isotropic elasticity. This three-constant free energy function was used by Gearing and Anand [42] to model the brittle cracking phenomenon observed experimentally in states of high triaxial tension in front of sharp notches in amorphous polymers.
In writing (2.14), Gearing and Anand [42] assumed that |Eol does not affect the volumet-ric part of the free energy. Correspondingly, they also assumed that the volumetvolumet-ric elastic strain e does not affect the deviatoric part of the free energy. As pointed out by Veprek et al. [43], this lack of interaction between the deviatoric and volumetric parts of the free energy is not well-justified, especially at large volumetric strains. To remedy this situation, they
proposed a free energy function of the form
O(E)
=po
exp
(
Eo1
2+
Ko(,c)21
-
1
+
exp
-).
(2.15)
However, the coupling introduced in the first term of (2.15) by Veprek et al. [43] was based on an assumption that the classical Poisson's ratio (as defined at infinitesimal strains) remains
constant even under large volumetric strains2 - an assumption which is unsupported by either rigorous physical arguments or experimental observations. Indeed, estimates of the pressure sensitivity of the bulk modulus and the shear modulus from seismological studies shows that the Poisson's ratio increases with volumetric-compaction; cf., e.g., the discussion in Section 8 of Stacey and Davis [44].
Since it is difficult to conduct physical experiments to determine volumetric-deviatoric coupling effects under circumstances involving large volumetric strains, it is the purpose of this chapter
e to conduct numerical experiments - using molecular dynamics simulations - to ex-plore such coupling effects in the free energy, and based on the results of these numerical
experiments, to propose a simple continuum-level isotropic elastic free energy that cap-tures the observed coupling effects.
As we are concerned here with a free energy function for isotropic materials, in our molecular dynamics simulations we consider an amorphous metallic glass as our representative isotropic material.
The plan of this chapter is as follows. In Section 2.2, we describe a simple free energy function specialized for large volumetric strains but small distortional strains. The results from our molecular dynamics simulations for various combinations of homogeneous volu-metric and pure-shear deformations are described in Section 2.3. Based on the results of these numerical experiments, in Section 2.4 we construct a simple continuum-level isotropic elastic free energy that captures the volumetric-deviatoric coupling effects observed in our numerical experiments.
Plastic flow in metallic materials is known to be "pressure sensitive" - a sensitivity that cannot be ignored at high pressures; accordingly, in Section 2.5, we examine the effect of the volumetric strain on the effective shear stress required for the onset of plastic flow in the metallic glass, and correlate this dependence with the numerically-observed dependence of the elastic shear modulus on the volumetric strain.
2.2
A simple free energy function that couples the
de-viatoric and volumetric response
As before, let E denote the logarithmic strain, c = trE the volumetric part of the strain, and JEol the magnitude of the deviatoric part of E. For isotropic materials, the deviatoric strain Eo may contribute to the free energy through the second invariant I2 = trE2
= |Eo|2 as well as the third invariant 13 = trE3. However, for small deviatoric strains, we expect that the effect of 13, which is third-order in Eo, is significantly smaller than the effect of 12, which is second-order in Eo. Accordingly,
e for small values of
|Eol,
which is of primary concern in this chapter, we assume from the outset that the free energy does not depend upon the third invariant I3= trEo. We provide a more detailed justification for this assumption in Appendix A.Then, motivated by (2.15), we introduce two scalar valued functions p(c) and g(c), and consider a free energy function of the form
V(E) = p(E) Eol2 + g(E). (2.16)
Here p(e) is a volumetric strain-dependent generalized shear modulus. We assume that
p(E) > 0 (2.17)
for all values of e considered here, and denote the ground-state value of this generalized shear modulus by
sto
,u(0) > 0. (2.18)The term g(c) in (2.16) represents a purely volumetric contribution to the free energy when
Eo = 0. Let
(e) f dg(e) (2.19)
denote a mean normal stress under this circumstance, and correspondingly define a
general-ized bulk modulus by
def d&(E) d2g(c)
'(e)
d(2.20)
.We limit our discussion in this chapter to circumstances in which the generalized bulk mod-ulus is positive-valued,
d() > 0, (2.21)
and denote the ground-state value of the generalized bulk modulus by
Further, in order to ensure that the free energy at zero strain is zero-valued and that the reference configuration is stress-free, we require that
g(O) = 0 and dg(E) 0. (2.23)
The Kirchhoff stress corresponding to the free energy (2.16) is then given by
TK - = 2p()Eo + + d(E) |Eo 2 1. (2.24)
E de
Next, let
defi def 1e
o - trTK, T = TK,ol, and y 2Eol (2.25)
3
define a mean normal stress, an equivalent shear stress, and an equivalent shear strain, respectively. Then (2.24) gives
- -) = &(,E) + 7d(E) 2 and T = re, y) = P(e). (2.26)
2 de
Thus, note that the free energy function (2.16) gives a mean normal stress that depends not only on the volumetric strain but also on the equivalent shear strain -Y: the term d(e) in (2.26)1 represents a mean normal stress versus volumetric strain response in the absence of a shear strain, while the term j(d[4e)/d)y 2 represents a shear-induced mean normal stress. Also, the equivalent shear stress r depends not only on the equivalent shear strain but also on the volumetric strain e, with [(e) in (2.26)2 representing a volumetric strain-dependent generalized shear modulus,
In the next section, we report on our numerical experiments using molecular dynamics simulations on a metallic glass. We shall use the stress-strain results from these numerical experiments to fit specific forms for the functions g(E) and p(e).
2.3
Molecular dynamics simulations
Since we are concerned with a free energy function for isotropic materials, in our molec-ular dynamics simulations, we consider an amorphous metallic glass as our representative isotropic material. Also, in order to determine specific forms for the functions [L(e) and g(c) in the free energy (2.16), we take a pragmatic mechanics-based approach, treating the results from molecular dynamics simulations as we would results from physical experiments, and determine g(e) and p(e) by selecting specific forms which fit our "experimental" data in the range of volumetric and shear strain levels for which we have conducted our numerical simulations.3
3For details on the theory and practice of molecular dynamics simulations, see the text by Frenkel and
500 1000 1500 2000 0 500 1000 1500 200(
Temperature (K) Temperature (K)
(a) (b)
Figure 2-1: (a) Specific volume and (b) specific enthalpy versus temperature.
2.3.1
Preparation of a metallic glass specimen
Following Cao et al. [46] and Cheng et al. [47], we consider a metallic glass with a composition of Cu6 4Zr3 6 and use the embedded atom potential developed and validated (using density functional theory calculations) for this system by these authors.4 To prepare a metallic glass specimen, we use a three-dimensional box of 10,976 atoms under periodic boundary conditions in all three dimensions. The sample was first equilibrated for 2 ns at 2000 K and zero external pressure to ensure melting and then quenched at a rate of 100 K/ns to a temperature of 50 K at zero external pressure using a Nose-Hoover thermostat and the NPT ensemble. Figures 2-1(a) and (b), respectively, show the specific volume and specific enthalpy as a function of temperature during quenching. The markers represent the average of each quantity over temperature spans of 50 K.5 Figure 2-2 shows the radial distribution functions for Cu-Cu, Cu-Zr, and Zr-Zr pairs, confirming that the as-quenched sample is amorphous. From the data in Figs. 2-1(a) and (b), the glass transition temperature
og,
the volumetric coefficient of thermal expansion#
below Og, and the specific heat at constant pressure cp below 19g for the simulated amorphous alloy were determined to be
dg = 664 K, /=33.6 x 10-6 K- 1, and cp = 0.19kgK (2.27)
respectively.
4The embedded atom potential developed by Cao et al. [46] and Cheng et al. [47] may be found in tabular
form at https://sites.google.com/a/gmu.edu/eam-potential-database/.
5The error bars in these figures denote the maximum and minimum values of each quantity measured over temperature spans of 50K during the quenching simulations.
0.3 0.4
r (nm)
Figure 2-2: The radial distribution functions in the quenched state pairs, confirming the amorphous structure of the as-quenched sample.
2
B 1
3
0.7
'or Cu-Cu, Cu-Zr, and Zr-Zr
Figure 2-3: Schematic and snapshot of the undeformed configuration.
A schematic of the as-quenched configuration, which we will refer to as the reference configuration of the body B, is shown in Fig. 2-3, which also shows a snapshot of the molecular configuration of the sample; the copper atoms are copper-colored and the zirconium atoms are white. The sample after quenching has dimensions of 5.62 nm in the 1, 2, and 3-directions.
2.3.2
Numerical experiments on the metallic glass specimen
The Cu6 4Zr36 metallic glass sample was subjected to various combinations of volumetric and shear strain, under periodic boundary conditions and a constant temperature of 50 K, using the NVT ensemble. The various deformations considered are summarized below:
A2 = 1/A
A3 1 A, A
B3t
U .'
(b)
Figure 2-4: Schematic and snapshots of the (a) dilated and (b) sheared configurations.
1. Volumetric dilatation/compaction: The sample is subjected to purely volumetric deformation with equal principal stretches:
A, = A2 = A3 =-A.
A schematic of the deformed body Bt for such a deformation is shown in Fig. 2-4(a);6 this figure also shows a corresponding snapshot of the molecular configuration at a volumetric strain of c = 0.15.
2. Pure shear: The sample is subjected to volume-conserving pure shear: A,= A, A2=1/A, and A3= 1.
A schematic of the deformed body Bt for such a deformation is shown in Fig. 2-4(b); this figure also shows a corresponding snapshot of the MD configuration at a shear
strain of -y = 0.04.
o For sufficiently large shear strains, the metallic glass sample will deform plasti-cally; however, in this numerical experiment, and in all other experiments involv-ing shear strains that follow (except those discussed in Section 2.5), we limit the magnitude of shear strain so that the sample remains in the elastic range.
3. Volumetric deformation followed by pure shear: The sample is first subjected to various levels of volumetric dilatation and compaction, and then subjected to pure shear.
4. Pure shear followed by volumetric deformation: The sample is first subjected to various levels of shear strain, and then subjected to volumetric dilatation and com-paction.
The stress-strain results from each of these numerical experiments are discussed below.
2.3.3
Volumetric dilatation/compaction
The sample was subjected to a constant volumetric strain rate of
e
= ±3 x I08 S-1 in dilatation/compaction. The components of the Cauchy stress may be determined from the virial stress. However, since our stress-strain relation (2.24) is given in terms of the Kirchhoff stress (TK JT), in what follows, unless otherwise specified, we report all stress-relatedquantities in terms of the Kirchhoff stress.
Figure 2-5 shows the mean normal stress o- as a function of the volumetric strain e, for e in the range [-0.30, 0.15]. The corresponding range of mean normal stress o- is approximately
[-45,15] GPa - the dependence of o- on c in this large range of volumetric strains is clearly
nonlinear.
It is important to note that at sufficiently large compressive volumetric strains the numer-ical metallic glass specimen exhibits ordering, while at sufficiently large positive volumetric strains the specimen exhibits cavitation-induced fracturing. Figure 2-6(a) shows the radial distribution functions for Zr-Zr pairs in the quenched state, and at a volumetric strain of
c = -0.35, where evidence of strain-induced ordering can be observed; and Fig. 2-6(b) shows a snapshot of a slice of the molecular configuration at a volumetric strain of e ~ 0.16, where cavitation-related failure is evident. By examining the radial distribution functions for Cu-Cu, Cu-Zr, and Zr-Zr pairs for volumetric strains in the range [-0.30, 0], we have confirmed that no strain-induced ordering occurs in our simulations; correspondingly for volumetric strains in the range [0, 0.15], we do not observe any cavitation-related failure. Thus, for e
in the range [-0.30, 0.15] studied in this chapter, the metallic glass specimen used in our numerical experiments continues to respond as an intact, nominally-isotropic, amorphous material.
20 10 -MD simulation --- Model ' -10 e -20- -30- -40--0.3 -0.2 -0.1 0 0.1 0.2
Figure 2-5: Variation of the mean stress with elastic volumetric strain. The solid line is the result of the MD simulation, and the dashed line is the result of the calibrated hyperelasticity model.
2.3.4
Pure shear
The sample was subjected to volume-conserving pure shear at a shear strain rate of ' =
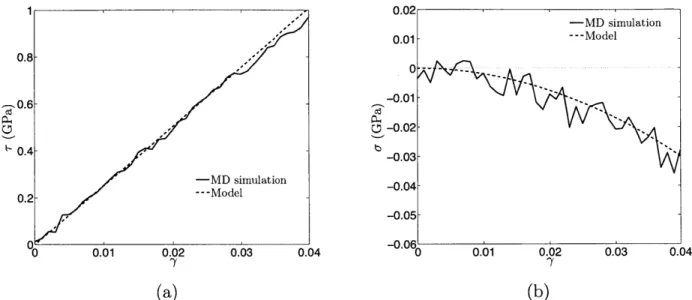
1 x 10⁸ S-1 to a final shear strain of -y = 0.04.7 The resulting shear stress T versus shear strain -y is plotted in Fig. 2-7(a). The dependence of T on y in this range of shear strains is
essentially linear.
Interestingly, the plot in Fig. 2-7(b) shows that a small but non-negligible non-zero mean
normal stress develops during pure shear. More on this later.
2.3.5
Volumetric deformation followed by pure shear
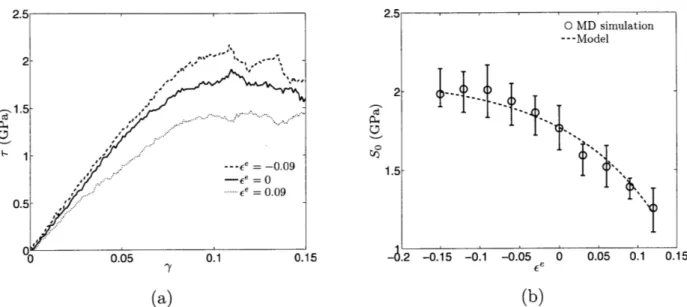
The sample was first subjected to volumetric strains ranging from e = -0.15 to e = 0.15, and subsequently subjected to reversed volume-conserving pure shear to a final shear strain of -y = 0.02. For clarity, in Fig. 2-8(a) we only show the shear stress T versus shear strain -y for volumetric strains of E = -0.09, 0, 0.09.
Figure 2-8(b) shows the shear modulus y as a function of the volumetric strain e, and from this figure it is evident that the shear modulus decreases with volumetric dilatation and
increases with volumetric compaction.
7The strain was reversed to verify that no appreciable permanent deformation had occurred at this level of shear strain.
0 0.1 0.2 0.3 0.4 0.5 0.6 0.7
r (nm)
(a)
(b)
Figure 2-6: (a) The radial distribution functions for Zr-Zr pairs in the quenched state and at a volumetric strain of e = -0.35, showing evidence of strain-induced ordering at high compressive volumetric strains. (b) A snapshot of a slice of the molecular specimen at a volumetric strain of
"0 0.01 0.02 0.03 0.04 '"0 0.01 0.02 0.03 0.04
(a) (b)
Figure 2-7: Variation of (a) the shear stress and (b) the mean stress with elastic shear strain. The solid lines are the result of the MD simulations, and the dashed lines are the result of the calibrated hyperelasticity model.
2.3.6
Pure shear followed by volumetric deformation
The sample was first subjected to pure shear to strains of -y = 0.02, 0.04, then subjected to
volumetric strains ranging from E = -0.15 to e = 0.15. The mean normal stress o is plotted against the volumetric strain e in Fig. 2-9(a) for the different values of prior shear strain. From this figure it is clear that a prior shear strain, in the limited range of accessible elastic
shear strains, has a negligible effect on the subsequent volumetric stress-strain response.
Figure 2-9(c) shows the variation of the shear stress T as a function of the volumetric strain E for the two different levels of prior shear strains, -y = 0.02, 0.04. This figure clearly shows that the shear stress generated by a prior shear strain is significantly affected by a
subsequent volumetric deformation.
2.4
Specialization of the functions
g(c)
and
pI(E)
In this section, we use the stress-strain results from our molecular dynamics simulations to select and calibrate specialized forms for the functions g(e) and p(e). We emphasize from the outset that our focus is on motivating proper functional forms rather than the specific values of the parameters appearing in the specialized functions. The actual values of the material parameters will of course be valid only for this numerical Cu64Zr3 6 metallic glass, and are controlled by its underlying interatomic potential.
0.6 30 -0.09 20 MD simulation 0.--.., --- Model - 26 0.4- '0.09 Cd24 -0.3- , , ,, '0 22 0.2 - ','' -MD simulation 20 --- Model 0.1- 18- o 0 0.005 0.01 0.015 0.02 0.025 -8.2 -0.15 -0.1 -0.05 0 0.05 0.1 0.15 (a) (b)
Figure 2-8: (a) Variation of the shear stress with shear strain at several levels of volumetric strain and (b) variation of the shear modulus with volumetric strain. The solid lines and markers are the result of the MD simulations, and the dashed lines are the result of the calibrated hyperelasticity model.
2.4.1
Determination of the function
g(E)
Recall from (2.19) and (2.20) that the mean normal stress in the absence of a shear strain and the generalized bulk modulus are defined in terms the function g(e) by
def dg(E) def d2g( )
(e) = d and (c) dc2 (2.28)
Following Gearing and Anand [42], we adopt8
g(6) = 0(6c)2 1- + -) exp (- , (2.29)
cc c_
where r0 is the ground-state bulk modulus, and c > 0 is another material constant represent-ing a critical value of the elastic volumetric strain associated with cavitation in volumetric dilatation. Applying the relations (2.28) gives
(E)
=
Ko
exp
--
,c - (2.30)
,(e) = ro 1 - -) exp
-8This form is motivated by the universal binding energy relation (UBER) for a one-dimensional
0 -5 - -5--MD simulation -10- -10- --- Model -15 -15--20 -- y = 0.02 -20-- -20-- 0.04 -5 -0.1 -0.05 0 0.05 0.1 0.15 -115 -0.1 -0.05 0 0.05 0.1 0.15 6 E (a) (b) 1.2 -..-..- MD simulation 1- =0.04 , 0.8 -=0.02 0.4-0 15 -0.1 -0.05 0 0.05 0.1 0.15 E (c)
Figure 2-9: (a,b) Variation of the mean stress with volumetric strain at two levels of fixed shear strain. (a) shows only the result from the MD simulations, and (b) compares the calibrated hyperelasticity model with the results of the MD simulations for both levels of fixed shear strain. (c) Variation of the shear stress with volumetric strain at two levels of fixed shear strain. In (b) and (c), the solid lines are the result of the MD simulations, and the dashed lines are the result of the calibrated hyperelasticity model.
Fitting the function (2.30)1 to the results of our molecular dynamics simulations shown in Fig. 2-5(a), gives
ro = 120.0 GPa and ec = 1.0. (2.31)
The quality of the fit for the mean normal stress versus volumetric strain response using these material parameters is shown in Fig. 2-5.