HAL Id: hal-03128810
https://hal.inrae.fr/hal-03128810
Submitted on 2 Feb 2021
HAL is a multi-disciplinary open access
archive for the deposit and dissemination of
sci-entific research documents, whether they are
pub-lished or not. The documents may come from
teaching and research institutions in France or
abroad, or from public or private research centers.
L’archive ouverte pluridisciplinaire HAL, est
destinée au dépôt et à la diffusion de documents
scientifiques de niveau recherche, publiés ou non,
émanant des établissements d’enseignement et de
recherche français ou étrangers, des laboratoires
publics ou privés.
Distributed under a Creative Commons Attribution| 4.0 International License
Environmental Responses Reveals Roles for
CHROMATIN REMODELING4 in the Arabidopsis
Floral Transition
Qing Sang, Alice Pajoro, Hequan Sun, Baoxing Song, Xia Yang, Sara Stolze,
Fernando Andrés, Korbinian Schneeberger, Hirofumi Nakagami, George
Coupland
To cite this version:
Qing Sang, Alice Pajoro, Hequan Sun, Baoxing Song, Xia Yang, et al.. Mutagenesis of a Quintuple
Mutant Impaired in Environmental Responses Reveals Roles for CHROMATIN REMODELING4 in
the Arabidopsis Floral Transition. The Plant cell, American Society of Plant Biologists (ASPB), 2020,
32 (5), pp.1479-1500. �10.1105/tpc.19.00992�. �hal-03128810�
Mutagenesis of a Quintuple Mutant Impaired in Environmental
Responses Reveals Roles for CHROMATIN REMODELING4 in
the Arabidopsis Floral Transition
[OPEN]Qing Sang,
a,1Alice Pajoro,
a,1Hequan Sun,
aBaoxing Song,
aXia Yang,
a,bSara C. Stolze,
aFernando Andrés,
a,cKorbinian Schneeberger,
aHirofumi Nakagami,
aand George Coupland
a,2 aMax Planck Institute for Plant Breeding Research, D50829, GermanybState Key Laboratory of Systematic and Evolutionary Botany, Institute of Botany, Chinese Academy of Sciences, Xiangshan, Beijing
100093, China
cAmélioration Génétique et Adaptation des Plantes Méditerranéennes et Tropicales, University of Montpellier, Centre de Coopération
Internationale en Recherche Agronomique pour le Développement, Institut National de la Recherche Agronomique, Montpellier SupAgro, 34398 Montpellier, France
ORCID IDs: 0000-0003-1163-1521 (Q.S.); 0000-0002-6419-548X (A.P.); 0000-0003-2046-2109 (H.S.); 0000-0003-1478-9228 (B.S.); 0000-0002-8142-5857 (X.Y.); 0000-0002-1421-9703 (S.C.S.); 4736-8876 (F.A.); 0000-0002-5512-0443 (K.S.); 0000-0003-2569-7062 (H.N.); 0000-0001-6988-4172 (G.C.)
Several pathways conferring environmentalflowering responses in Arabidopsis (Arabidopsis thaliana) converge on developmental processes that mediate thefloral transition in the shoot apical meristem. Many characterized mutations disrupt these environmental responses, but downstream developmental processes have been more refractory to mutagenesis. Here, we constructed a quintuple mutant impaired in several environmental pathways and showed that it possesses severely reducedflowering responses to changes in photoperiod and ambient temperature. RNA-sequencing (RNA-seq) analysis of the quintuple mutant showed that the expression of genes encoding gibberellin biosynthesis enzymes and transcription factors involved in the age pathway correlates with flowering. Mutagenesis of the quintuple mutant generated two late-flowering mutants, quintuple ems1 (qem1) and qem2. The mutated genes were identified by isogenic mapping and transgenic complementation. The qem1 mutant is an allele of the gibberellin 20-oxidase gene ga20ox2, confirming the importance of gibberellin for flowering in the absence of environmental responses. By contrast, qem2 is impaired in CHROMATIN REMODELING4 (CHR4), which has not been genetically implicated infloral induction. Using co-immunoprecipitation, RNA-seq, and chromatin immunoprecipitation sequencing, we show that CHR4 interacts with transcription factors involved in floral meristem identity and affects the expression of key floral regulators. Therefore, CHR4 mediates the response to endogenousflowering pathways in the inflorescence meristem to promote floral identity.
INTRODUCTION
Lateral shoot organs initiate from cells on theflanks of the shoot apical meristem (SAM), and the identity of the formed organs changes during development (Bowman and Eshed, 2000). In Arabidopsis (Arabidopsis thaliana), the transition from vegetative leaf initiation toflower production occurs in response to several environmental and endogenous cues. Important environmental signals that control flowering include seasonal fluctuations in temperature and daylength, which are mediated by the photo-periodic and vernalization pathways, whereas ambient changes in temperature also influence flowering time (Srikanth and Schmid, 2011; Andrés and Coupland, 2012). In addition, endogenous signals such as gibberellins (GAs) and the age of the plant
contribute to thefloral transition in the absence of inductive en-vironmental cues (Wilson et al., 1992; Wang et al., 2009).
Three intersecting environmental pathways that promote flowering have been well characterized. The photoperiodic pathway promotesflowering under long days (LDs) but not under short days (SDs), in which plantsflower much later. Exposure to LDs stabilizes the CONSTANS transcription factor (Valverde et al., 2004), which in turn activates transcription of FLOWERING LOCUS T (FT) and TWIN SISTER OF FT (TSF) in the leaf vascular tissue (Kardailsky et al., 1999; Kobayashi et al., 1999; Suárez-Lopez et al., 2001; An et al., 2004; Yamaguchi et al., 2005). The FT and TSF proteins, which are related to phosphatidyl-ethanolamine binding proteins, move to the SAM (Corbesier et al., 2007; Jaeger and Wigge, 2007; Mathieu et al., 2007), where they physically interact with the bZIP transcription factor FD (Abe et al., 2005, 2019; Wigge et al., 2005). In the SAM, the FT–FD protein complex promotes the transcription of genes encodingfloral activators, such as SUPPRESSOR OF OVEREXPRESSION OF CO1 (SOC1) and FRUITFULL (FUL), which induce thefloral transition, as well as APETALA1 (AP1) and LEAFY (LFY), which promotefloral meristem identity (Schmid et al., 2003; Wigge et al., 2005; Torti et al., 2012; Collani et al., 2019). Because they represent the mobile signal
1These authors contributed equally to this work. 2Address correspondence to coupland@mpipz.mpg.de.
The author responsible for distribution of materials integral to thefindings presented in this article in accordance with the policy described in the Instructions for Authors (www.plantcell.org) is George Coupland (coupland@mpipz.mpg.de).
[OPEN]Articles can be viewed without a subscription. www.plantcell.org/cgi/doi/10.1105/tpc.19.00992
linking leaves and the SAM, FT and TSF are essential for the photoperiodicflowering response, and ft tsf double mutants are daylength-insensitive (Yamaguchi et al., 2005; Jang et al., 2009). The seasonal cue of exposure to winter cold mediatesflowering via the vernalization pathway, which represses transcription of thefloral repressor FLOWERING LOCUS C (FLC; Michaels and Amasino, 1999; Sheldon et al., 1999). FLC is a MADS (MINICHROMOSOME MAINTENANCE FACTOR 1, AGAMOUS, DEFICIENS, SERUM RESPONSE FACTOR)-box transcription factor that forms regulatory complexes with other MADS-box floral repressors, such as SHORT VEGETATIVE PHASE (SVP; Li et al., 2008). Thus, vernalization reduces FLC transcription and promotes flowering via the endogenous and photoperiodic pathways, whereas mutants for FLC are essentially insensitive to vernalization. The genome-wide binding sites of FLC and SVP include those in several genes that promoteflowering within the photoperiodic pathway, such as FT and SOC1 (Searle et al., 2006; Lee et al., 2007; Li et al., 2008; Deng et al., 2011; Mateos et al., 2015; Richter et al., 2019). Because FLC is stably repressed by exposure to cold, plants canflower through the photoperiodic pathway when they are exposed to LDs after cold exposure. Also, genes within the endogenous pathway that are repressed by FLC, such as SQUAMOSA PROMOTER BINDING PROTEIN-LIKE15 (SPL15), can promoteflowering during vernalization (Deng et al., 2011; Hyun et al., 2019)
Arabidopsis alsoflowers rapidly when exposed to high tem-peratures, and this response can overcome the delay inflowering observed under SDs at lower growth temperatures (Balasubramanian et al., 2006). FT and TSF are transcribed at high temperature under SDs and promote earlyflowering; thus their transcriptional re-pression under SDs at lower temperatures is overcome at high temperatures (Kumar et al., 2012; Galvão et al., 2015; Fernández et al., 2016). Accordingly, MADS-box repressors of FT and TSF, particularly FLOWERING LOCUS M and SVP, do not accumulate under SDs at high temperature, and mutations in these genes reduce theflowering response to high temperature (Lee et al., 2007, 2013; Posé et al., 2013; Airoldi et al., 2015). The reduced activity of these repressors also enhances the response of the meristem to low levels of FT and TSF transcription in the leaves (Fernández et al., 2016). Triple mutants for FT, TSF, and SVP are insensitive to higher temperatures under SDs (Fernández et al., 2016).
In addition to these environmental pathways, there are several endogenousflowering pathways. A set of genes was ascribed to the autonomousflowering pathway, because they caused late-flowering under LDs and SDs and were therefore considered to promoteflowering independently of photoperiodic cues (Koornneef et al., 1991). Mutations in all these genes caused elevated levels of FLC mRNA, and the encoded proteins contribute to FLC ex-pression at the transcriptional and post-transcriptional levels (Whittaker and Dean, 2017). The late-flowering phenotype of autonomous pathway mutants can therefore be suppressed by mutations in FLC (Michaels and Amasino, 2001). In addition, GA is an important contributor to endogenous flowering regulation, because mutations or transgenes that strongly reduce GA levels almost abolishedflowering under non-inductive SDs (Wilson et al., 1992; Galvão et al., 2012; Porri et al., 2012). Finally, microRNA156 (miR156) negatively regulates the floral transition and is
developmentally regulated such that its abundance decreases progressively with increasing plant age (Wu and Poethig, 2006; Wang et al., 2009). This miRNA negatively regulates the accu-mulation of several SPL transcription factors, including SPL3, SPL9, and SPL15, which promote thefloral transition, particularly under non-inductive SDs (Gandikota et al., 2007; Wang et al., 2009; Yamaguchi et al., 2009; Hyun et al., 2016; Xu et al., 2016). Thus, miR156/SPL modules have been associated with an en-dogenousflowering pathway related to plant age.
Here, we extend our understanding of the genetic basis of the floral transition by screening specifically for genes that regulate flowering independently of the environmental pathways. To this end, we constructed a high-order quintuple mutant, svp-41flc-3 ft-10 tsf-1 soc1-2, which shows reduced sensitivity to environ-mentalflowering signals because it is impaired in responses to photoperiod and high temperature. Using RNA sequencing (RNA-seq), we characterized the expression offlowering-related genes in this mutant, and we employed a forward genetics approach to identify genes controllingflowering time in this background. This allowed us to define a role for CHROMATIN REMODELING4 (CHR4) in promoting thefloral transition.
RESULTS
Phenotypic and Molecular Characterization of a Quintuple Mutant Strongly Impaired in Responses to
Environmental Cues
To assess theflowering time of Arabidopsis plants in which the major environmental pathways were inactivated, we constructed the quintuple mutant svp-41 flc-3 ft-10 tsf-1 soc1-2 (hereafter referred to as the quintuple mutant). The quintuple mutant showed a dramatically reduced flowering response to daylength com-pared with Columbia 0 (Col-0). Under LDs, the quintuple mutant bolted later and after forming more vegetative rosette leaves than the wild type (Col-0; Figures 1A and 1B). However, under SDs at 21°C, the mutant bolted much earlier than Col-0 in terms of days to flowering and rosette leaf number (Figures 1A and 1B). Bolting of the quintuple mutant was delayed by fewer than 10 d in SDs compared with LDs, whereas bolting in Col-0 was delayed by;50 d. Similarly, the quintuple mutant formed;5 more rosette leaves under SDs than LDs, whereas Col-0 formed over 40 more rosette leaves. Theflowering time of the quintuple mutant was also in-sensitive to higher ambient temperatures under SDs when con-sidering bolting time, but it displayed partial insensitivity in terms of rosette leaf number (Figures 1A and 1B). Finally, GA4treatment
acceleratedflowering of Col-0 under SDs (Wilson et al., 1992) but had a smaller effect on theflowering time of the quintuple mutant (Supplemental Figures 1A and 1B). These results are consistent with the idea that the GA response and signaling are activated in the quintuple mutant, as shown for svp-41 mutants in Andrés et al. (2014). Overall, the quintuple mutant showed strongly impaired responses to environmental signals such as day-length and ambient temperatures, in terms of time to bolting and the number of rosette leaves formed. These data suggest that in the quintuple mutant, thefloral transition occurs via endogenous mechanisms such as the GA or age pathway.
Figure 1. Phenotypic and Molecular Characterization of the Quintuple Mutant svpflc ft tsf soc1.
(A) and (B) Days to bolting (A) and leaf number of plants grown (B) under LD-21°C, SD-21°C, and SD-27°C compared with Col-0. At least 17 plants were analyzed for each genotype. The data were analyzed with one-way ANOVA using Tukey’s honest significant difference as a post-hoc test. Different letters indicate significant differences (P # 0.05). Whiskers represent a distance of 1.5 times the interquartile range.
(C) In situ hybridization analysis of FUL mRNA accumulation in SAMs of different genotypes grown in SDs. Plants were harvested each week between 2 weeks and 6 weeks after germination. Scale bar5 50 mm.
In addition to effects on bolting time and vegetative rosette leaf number, the quintuple mutant produced more cauline leaves than Col-0 in all conditions tested (Supplemental Figure 1C). The quintuple mutant formed on average 4.5-fold more cauline leaves than Col-0 under LDs and 2.3-fold more under SDs. The increased cauline leaf number in the mutant compared with Col-0 suggests that the mutant is also impaired in the determination offloral meristem identity afterfloral induction and bolting, such that more phytomers contain cauline leaves and axillary shoots than in Col-0.
We then compared the developmental stage of the shoot apex of the quintuple mutant to that of Col-0 by performing in situ hybridizations for FUL transcript on apical cross sections of SD-grown plants of different ages (Figure 1C). FUL encodes a MADS-box floral activator that is partially genetically redundant with SOC1. FUL mRNA accumulates in the SAM during the early stages of thefloral transition (Ferrándiz et al., 2000; Melzer et al., 2008; Torti et al., 2012). In the apices of SD-grown plants, FUL mRNA accumulated;1 week earlier in the quintuple mutant than in Col-0 (Figure 1C), which is consistent with the earlierflowering phe-notype of the mutant.
Because the quintuple mutantflowers earlier under SDs and major regulators offlowering are inactivated, the transcriptional network associated with thefloral transition is probably differ-entially expressed in the mutant compared with Col-0. To define these differences, we performed RNA-seq on apices of the quintuple mutant and Col-0 through a developmental time course under SDs. Apical samples were harvested from both genotypes 3, 4, 5, and 6 weeks after sowing. In vegetative apices of both genotypes at 3 weeks after sowing, only 46 genes were differ-entially expressed (adjusted P-value < 0.05) between the quintuple mutant and Col-0. At 4, 5, and 6 weeks, when the mutantflowered more rapidly than Col-0 (Figure 1C), 486, 736, and 568 genes, respectively, were differentially expressed in the mutant com-pared with Col-0 (Supplemental Data Set 1). At these time points, ;45%, 14%, and 33% of the differentially expressed genes (DEGs), respectively, were more highly expressed in the quintuple mutant versus Col-0 (Supplemental Data Set 1). The mRNAs of SPL3, SPL4, SPL5, SPL9, SPL12, and SPL15, which are regulated by miR156 and contribute to the endogenous age-related flow-ering pathway, were more abundant in the quintuple mutant, which is consistent with promotion of flowering by the age pathway (Figures 1D and 1E). Moreover, thefloral activators FD, FDP, and AGAMOUS-LIKE6 (AGL6) were more highly expressed in the mutant versus Col-0 (Figures 1D and 1E; Supplemental Figure 1D; Supplemental Data Set 1), and the expression of the floral repressors MADS-AFFECTING FLOWERING4 (MAF4) and MAF5 was attenuated in the quintuple mutant (Supplemental Data Set 1). Moreover, genes encoding enzymes involved in GA
biosynthesis and catabolism were differentially expressed in the quintuple mutant (Figure 1D).
A Sensitized Mutant Screen in the Quintuple Mutant Background Identifies Two Loci that Promote Flowering We then employed the quintuple mutant as a sensitized back-ground for mutagenesis screening to identify genes that regu-lateflowering independently of environmental pathways. This approach was expected to identify mutations in endogenous components, because the major environmentalfloral response pathways are already impaired in the mutant, and mutations in the autonomous pathway should not be recovered, because FLC is inactive in the quintuple mutant. We screened the M2generation for mutants with alteredflowering behavior (see Methods). Two mutants showing delayedfloral transition in the quintuple mutant background, quintuple ems1 (qem1) and qem2, were selected for detailed studies because they exhibited strong and reproducible phenotypes in the M3 generation. Both lines segregated the
mutant phenotype in a 3:1 ratio in the BC1F2generation (see
Methods), suggesting that a single recessive mutation was re-sponsible for the phenotypes of both mutants. Plants segregating the qem1 or qem2 phenotype in the respective BC1F2populations were then bulk-harvested. Fast-isogenic mapping (see Methods; Hartwig et al., 2012) localized qem1 and qem2 with high con fi-dence to different regions on chromosome 5 (Figure 2; Supplemental Figure 2).
The qem1 mutation localized to the same region of chromo-some 5 as the GA 20-oxidase gene GA20ox2 (Supplemental Figure 2C; Supplemental Table). Mutation of GA20ox2 delays flowering and has a stronger effect in the svp-41 background (Rieu et al., 2008; Plackett et al., 2012; Andrés et al., 2014). In qem1, a single nucleotide polymorphism was identified in the first exon of GA20ox2 that was predicted to cause an amino acid substitution in the protein (ser137asn). To confirm that this mutation causes the late-flowering phenotype of qem1, we performed molecular complementation. Introducing the Col-0 genomic GA20ox2 locus into qem1 strongly reduced leaf number andflowering time, so that the transgenic linesflowered at a similar time or earlier than the quintuple mutant (Supplemental Figures 2D and 2E), confirming that the mutation in GA20ox2 was responsible for the delayed flowering of qem1. This result is consistent with the RNA-seq data showing that GA20ox2 mRNA is more highly expressed in the quintuple mutant background than in Col-0 (Supplemental Fig-ure 1D and with the previous observation that svp-41 mutants contain higher levels of bioactive GAs than the wild type (Andrés et al., 2014). Therefore, the GA pathway likely plays a decisive role in promoting thefloral transition in the quintuple mutant.
Figure 1. (continued).
(D) Transcriptional profile comparisons in apices of svp flc ft tsf soc1. The analysis focuses on genes implicated in flowering time control. The data are represented as a heatmap to highlight upregulated (red) and downregulated genes (blue). Gene expression changes are represented as log2-fold changes. (E) Box plots from RNA-seq data showing differential expression of SPL9, SPL15, FD, FUL, and AGL6 in the apices of svpflc ft tsf soc1 and Col-0 under SDs. The Y-axis shows transcripts per TPM. The X-axis shows time of sampling as weeks after sowing. Whiskers represent distance from the lowest to the largest data point.
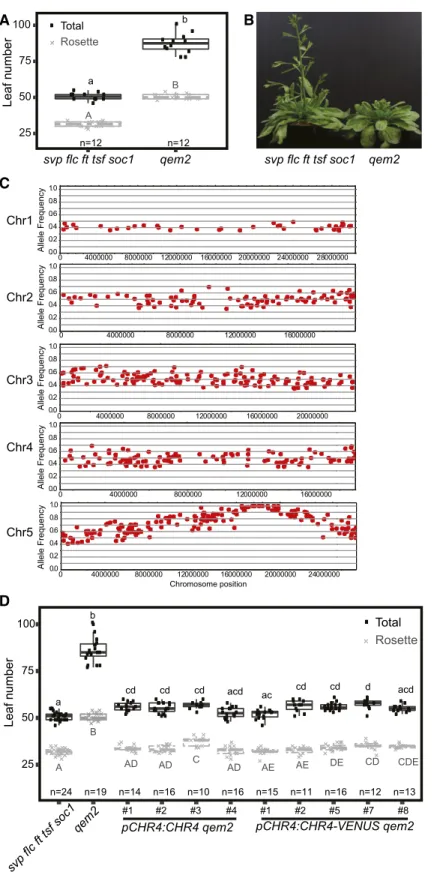
Figure 2. Molecular Genetic Analysis of qem2.
(A) Leaf number atflowering of plants grown under LDs. Twelve plants were analyzed per genotype. The data were compared with one-way ANOVA using Tukey’s honest significant difference as a post-hoc test. Different letters indicate significant differences (P # 0.05). Whiskers represent the distance of 1.5 times the interquartile range.
The qem2 mutant was laterflowering and initiated more rosette and cauline leaves than the quintuple mutant (Figures 2A and 2B), indicating a delay in thefloral transition and impaired floral mer-istem identity. The region of chromosome 5 to which qem2 mapped contained no previously describedflowering-time genes (Figure 2C; Table 1). Three high-confidence polymorphisms predicted to cause non-synonymous mutations in the coding sequences At5g43450, At5g44690, and At5g44800 were iden-tified (Table 1). At5g43450 encodes a protein with similarity to aminocyclopropane-1-carboxylate oxidase, At5g44690 encodes a protein of unknown function, and At5g44800 encodes the CHD3-like ATP-dependent chromatin-remodeling factor CHR4. In Arabidopsis, CHR4 is most closely related to PICKLE (PKL), which repressesflowering via the GA pathway (Fu et al., 2016; Park et al., 2017) and promotesflowering via the photoperiodic path-way though FT activation (Jing et al., 2019a, 2019b). Both PKL and CHR4 are homologous to SWI/SWF nuclear-localized chromatin remodeling factors of the CHD3 family (Ogas et al., 1999), and CHR4 is also named PICKLE RELATED1 (Aichinger et al., 2009). The chr4 mutant shows no obvious mutant phenotype under standard growth conditions (Aichinger et al., 2009). However, CHR4 function has been implicated infloral organ development because it interacts with the MADS-domain transcription factors AGAMOUS (AG), AP3, PISTILLATA (PI), SEPALLATA3 (SEP3), and AP1, as revealed by immunoprecipitation of these factors (Smaczniak et al., 2012). Therefore, we hypothesized that the mutation in CHR4 caused the qem2 mutant phenotype. We tested this by introducing pCHR4:CHR4 and pCHR4:CHR4-VENUS constructs into qem2. The increased leaf number phenotype of qem2 was reduced to a similar number as in the progenitor quintuple mutant in all transformed lines (Figure 2D). Thus, we conclude that the later-flowering qem2 phenotype was caused by the mutation in CHR4.
Phenotypic Characterization of chr4 and Its Effects on Gene Expression during Floral Induction
The qem2 mutant contains a mutation in the SNF2-related heli-case/ATPase domain of CHR4, resulting in the substitution of a conserved alanine residue by valine (ala713val; Figure 3A). To analyze the chr4 mutant phenotype in the Col-0 background, we characterized the T-DNA insertion allele chr4-2 (SAIL_783_C05), containing a T-DNA insertion within the coding sequence between the helicase/ATPase domain and the DNA binding domain (Figure 3A). The T-DNA insertion also causes a reduction in CHR4 mRNA levels (Supplemental Figure 3).
We compared the leaf number, bolting time, andflowering time of qem2 and chr4-2 with those of their respective progenitors under LDs (Supplemental Figures 4A and 4B) and SDs (Figures 3B
to 3E). The qem2 mutant formed;20 more rosette leaves and 30 more cauline leaves than the quintuple mutant under both LDs and SDs (Figures 3B and 3C; Supplemental Figures 4A and 4B). De-spite having more rosette leaves, the bolting time of qem2 was similar to that of its progenitor (Figure 3D), whereas time tofirst openflower was markedly delayed in qem2 (Figures 3D and 3F), which is consistent with the increased number of cauline leaves. The phenotypic difference between Col-0 and chr4-2 was less severe than that between qem2 and the quintuple mutant. Under LDs, chr4-2 and Col-0 initiated a similar number of leaves (Supplemental Figure 4B). Under SDs, chr4-2 and Col-0 had a similar rosette leaf number, but chr4-2 bolted earlier and pro-duced more cauline leaves (Figures 3B to 3E). CHR4 function appeared to be more important for flowering control in the quintuple mutant background, suggesting it might preferentially regulateflowering via the GA and aging pathways.
The chr4-2 and qem2 mutants bolted slightly earlier than their progenitors but initiated a similar number or more rosette leaves (Figures 3B and 3D), suggesting that they might have a shorter plastochron and initiate rosette leaves more rapidly. To determine the plastochron, we counted rosette leaves weekly until the plants bolted under SDs. Early in rosette development, chr4-2 and qem2 produced leaves at a similar rate as their progenitors, but later in rosette development, the mutants produced leaves more rapidly than the progenitors, leading to a steep increase in leaf number (Figures 3G and 3H). More rapid leaf initiation can be related to an enlarged SAM (Barton, 2010); therefore, we compared the SAMs of chr4-2 and qem2 to those of Col-0 and the quintuple mutant, respectively, after 4 and 5 weeks of growth under SDs (Supplemental Figure 5). The SAMs of plants carrying either chr4 mutant allele were larger than those of their progenitors, but this was most pro-nounced for qem2 compared with the quintuple mutant (Supplemental Figure 5).
The transition toflowering in Arabidopsis can be conceptualized as two sequential steps in which the inflorescence meristem acquires different identities. After the transition from a vegetative meristem, the inflorescence meristem (I1) initially forms cauline
leaves and axillary branches, and after transition from I1to I2, it
initiatesfloral primordia (Ratcliffe et al., 1999). Rosette leaf number and days to bolting can be used as a proxy for the I1transition,
whereas the number of cauline leaves produced on theflowering stem and days to thefirst open flower indicate when the I1to I2 transition occurs. Cauline leaves can be distinguished from ro-sette leaves due to their smaller size and more pointed shape, so that the increased number of leaves on the inflorescence stem can be explained by a delayed I2transition rather than by enhanced
internode elongation between rosette leaves. Compared with Col-0, chr4-2 is not delayed in the transition from vegetative meristem to I1but is delayed in the transition from I1to I2. By contrast,
Figure 2. (continued).
(B) Images of qem2 and svpflc ft tsf soc1 plants ;50 d after germination, showing that qem2 produces more leaves than svp flc ft tsf soc1 under LDs. (C) Allele frequency estimates for EMS-induced mutations. Local allele frequencies indicate that the qem2 mutation localized to chromosome (Chr) 5. (D) Leaf number for svpflc ft tsf soc1, qem2, gCHR4 qem2, and gCHR4-VENUS qem2 plants under LDs. At least 11 plants per genotype were analyzed. The data were compared with one-way ANOVA using Tukey’s honest significant difference as a post-hoc test. Different letters indicate significant differences (P# 0.05). Whiskers represent a distance of 1.5 times the interquartile range.
compared with the quintuple mutant, qem2 mutants were strongly delayed in both the transition to I1and to I2(Figures 3B to 3E).
In Arabidopsis, AP1 confers floral meristem identity and is a marker for the I1to I2transition; therefore, we performed in situ
hybridizations to monitor the appearance of AP1 mRNA through a developmental time course (Figure 4). At 5 weeks after germi-nation, no AP1 expression was detected in any of the genotypes, indicating that the plant meristems were still vegetative. AP1 mRNA was detected at 6 weeks in Col-0 and chr4-2. In qem2 mutants, AP1 mRNA appeared more than 1 week later than in the quintuple mutant, which is consistent with observation that more cauline leaves formed in qem2 (Figure 4).
We then performed RNA-seq along a developmental time course to identify the genome-wide effects of CHR4 on gene expression during thefloral transition. We examined the tran-scriptomes of shoot apices of Col-0, the quintuple mutant, chr4-2, and qem2 plants grown for 3, 4, 5, or 6 weeks under SDs and compared the chr4-2 and qem2 transcriptomes to those of Col-0 and the quintuple mutant, respectively (Supplemental Data Set 2). The analysis focused on 237 genes previously reported to regulate thefloral transition in Arabidopsis (Bouché et al., 2016). In total, 26 of these genes were significantly differentially expressed (adjusted P-value < 0.05 and log2FCj1j) between chr4-2 and
Col-0 (Figure 5A), and 18 were DEGs between qem2 and the quintuple mutant (Figure 5C). Nine genes were common to the two lists (AGL79, BRANCHED1, FUL, SEP3, AGL17, SPL4, BROTHER OF FT AND TFL1 [BFT], EARLY FLOWERING4 [ELF4], and MAF4). The expression of SPL4, which encodes a component of the age-dependentflowering pathway, increased at several time points in the chr4 and qem2 mutants compared with their respective progenitors (Figures 5A to 5D). In particular, SPL4 was most highly expressed in 4-week–old qem2 and in 5-week–old chr4-2 plants (Figures 5B to 5D). FUL was also more highly expressed in both mutants at later time points (Figures 5B and 5D) and is a direct target of SPL9, SPL15, and SPL3 during thefloral transition (Wang et al., 2009; Yamaguchi et al., 2009; Hyun et al., 2016). Indeed, a corresponding small increase in mRNA levels of SPL9 and SPL15 was also observed in the CHR4 mutants (Supplemental Data Set 2). The earlier increase in expression of SPL4, SPL9, and SPL15 is consistent with the earlier bolting observed in the
mutants, as qem2 bolted;2-d and chr4-2 ;10-d earlier than their respective progenitors (Figure 3D).
We detected elevated expression of TERMINAL FLOWER1 (TFL1) in chr4-2 (Figures 5A and 5B) and BFT in qem2 (Figure 5C). Overexpression of TFL1 and BFT, which both encode proteins related to phosphatidylethanolamine binding proteins, reduces AP1 and LFY expression and delaysfloral organ initiation (Ratcliffe et al., 1998; Yoo et al., 2010). Consistent with thisfinding, LFY mRNA was also less abundant in qem2 (Figure 5D). During the inflorescence meristem transition from I1 to I2, increased LFY activity inducesfloral meristem identity by directly activating AP1 transcription and reducing GA levels, such that SPL9 recruits DELLA proteins to the regulatory region of AP1 (Weigel et al., 1992; Wagner et al., 1999; Yamaguchi et al., 2014). Therefore, in the absence of CHR4 function, attenuated LFY transcription likely contributes to a delay in the transition to the I2phase, as reflected
by the increased number of cauline leaves in qem2.
CHR4 Protein Localization In Planta and Identification of In Vivo Protein Interactors of CHR4
Chromatin remodelers are often recruited to target genes by specific transcription factors. Therefore, to further understand its mode of action during thefloral transition, we identified proteins that interact with CHR4. We used the transgenic plants described above that express a fusion of VENUSfluorescent protein and CHR4 expressed from its native promoter (pCHR4:CHR4-VENUS). We analyzed the expression pattern of this CHR4-VENUS protein by confocal microscopy and compared it to the results of in situ hybridization analysis of CHR4 mRNA. CHR4-VENUS was localized to the nucleus and its spatial pattern was similar to the mRNA pattern detected by in situ hybridization in the SAM,floral organs, and young leaves (Supplemental Figure 6).
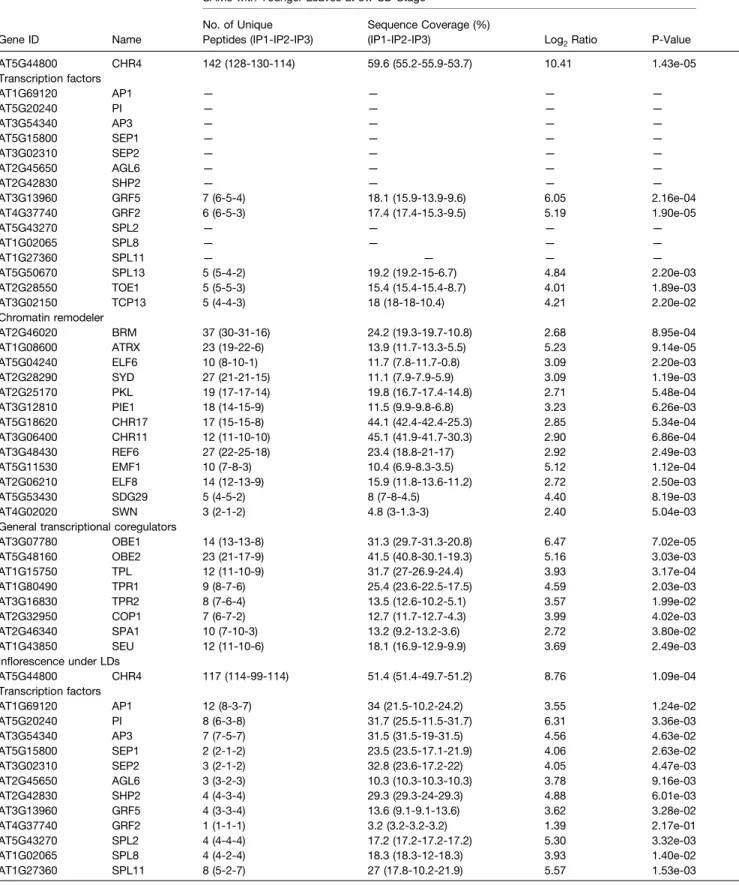
To identify protein interactors, we immunoprecipitated CHR4-VENUS protein from inflorescence tissue and 5-week–old SD apical-enriched tissue using anti-GFP antibodies and used p35S-YFP transgenic plants as a negative control. Proteins that specifically co-immunoprecipitated with CHR4-VENUS were identified by protein mass spectrometry (MS; see Methods). In total, 136 and 342 proteins were significantly (false discovery
Table 1. Candidate SNPs in qem2 Annotated in Genes
Chr Pos R M N AF Sh Region Gene ID Type AR AM Name
5 16,021,261 C T 60 0.87 40 CDS At5g40010 non-synonymous G S ASD
5 17,457,889 C T 38 1 40 CDS At5g43450 non-synonymous D N —
5 18,031,708 G A 27 1 40 CDS At5g44690 non-synonymous R STOP —
5 18,089,069 G A 52 1 40 CDS At5g44800 non-synonymous A V CHR4
5 19,281,739 G A 40 0.93 40 CDS At5g47530 non-synonymous G E —
5 19,572,635 G A 17 0.94 32 39UTR At5g48300 — — — ADG1
5 19,637,792 G A 43 0.96 40 CDS At5g48460 non-synonymous A V ATFIM2
5 20,946,101 G A 49 0.83 40 CDS At5g51560 non-synonymous G S —
AF, allele frequency; AM, amino acid inqem2; AR, amino acid in the reference genome (svpflc ft tsf soc1); CDS, coding sequence; Chr, chromosome; Gen ID, gene identifier; M, nucleotide in qem2; N, number of reads supporting the mutation; Pos, position of the mutated nucleotide; R, nucleotide in the reference genome (svpflc ft tsf soc1); Region, region of the locus where the mutation was identified; Score (maximum 40); Sh, SHORE Score (maximum 40); Type, type of mutation (non-synonymous or synonymous); Dashes indicate no gene name.
rate, FDR5 0.01) enriched in inflorescences and 5-week–old SD apex enriched tissue, respectively. The CHR4-interacting proteins in inflorescences included the floral homeotic MADS-domain transcription factors AP1, SEP3, PI, and AP3 (Table 2; Supplemental Data Set 3). The reciprocal experiment of im-munoprecipitating AP1 was performed with gAP1:GFP plants and
CHR4 was detected among the coimmunoprecipitated proteins (Supplemental Data Set 3 and Supplemental Figure 7). Taken together, these results confirm the previous finding that CHR4 could be co-immunoprecipitated with AGAMOUS, AP3, PI, SEP3, and AP1 (Smaczniak et al., 2012). Moreover, SEP1 and SEP2 were also found here to be interaction partners of CHR4 in inflorescence
Figure 3. Characterization of CHR4.
(A) Schematic representation of the CHR4 locus showing the position of the mutation in qem2 and the T-DNA insertion site (chr4-2). The CHR4 protein domains are illustrated: A plant homeodomain (PHD) zincfinger (blue), a chromo domain (red), a SNF2-related helicase/ATPase domain (green), and a DNA binding domain (yellow). The EMS-induced protein sequence change is located within the SNF2-related helicase/ATPase domain.
(B to E) Leaf number (B), cauline leaf number (C), days to bolting andflowering (D), and number of days from bolting to flowering (E) of Col-0, chr4-2, svp flc ft tsf soc1, and qem2 plants grown under SDs. At least 17 plants were analyzed for each genotype. The data were compared with one-way ANOVA using Tukey’s honest significant difference as a post-hoc test. Different letters indicate significant differences (P # 0.05). Whiskers represent a distance of 1.5 times the interquartile range.
(F) Twelve-week–old plants growing in SDs. Red arrows indicate first open flower. Scale bar 5 10 cm.
(G) Rosettes of Col-0, chr4-2, svpflc ft tsf soc1, and qem2 plants after 38 d and 43 d of growth in SDs. Scale bar 5 1 cm.
(H) Rosette leaf number of Col-0, chr4-2, svpflc ft tsf soc1, and qem2 plants grown under SDs from 3 weeks to 7 weeks. Eighteen plants were analyzed for each genotype. Error bars representSDof the mean. The asterisks indicate significant differences (P-value < 0.05) between Col-0 and chr4-2 (blue) or svp flc ft tsf soc1 and qem2 (red).
tissues (Table 2; Supplemental Data Set 3; Supplemental Fig-ure 7). In addition tofloral homeotic proteins, other MADS-domain proteins were found to interact with CHR4 in inflorescences, in-cluding AGL6 and the fruit- and ovule-specific protein SHAT-TERPROOF2 (SHP2; Favaro et al., 2003; Table 2; Supplemental Data Set 3; Supplemental Figure 7).
Other classes of transcription factors involved in the floral transition were identified in CHR4 complexes. Notably, SPL2, SPL8, and SPL11 were found to be interaction partners in inflorescences, whereas SPL13 was identified as a partner in inflorescences and enriched apices (Table 2; Supplemental Data Set 3; Supplemental Figure 7). Furthermore, TARGET OF EARLY ACTIVATION TAGGED1 (TOE1), an AP2-domain tran-scription factor that represses thefloral transition (Aukerman and Sakai, 2003), also interacted with CHR4 in enriched apices. A further list of transcription factors and chromatin remodelers identified as CHR4 interactors is provided in Table 2 and Supplemental Data Set 3.
These experiments demonstrated that CHR4 associates in vivo with several transcription factors of the MADS, SPL, and AP2 classes that contribute to thefloral transition and floral meristem identity.
Genome-wide Effects of CHR4 on Histone Modifications and Gene Expression
Proteins from the CHD3 group that includes CHR4 can participate in different chromatin remodeling pathways and either repress or activate gene expression, depending on the factors with which they associate. For example, PKL associates with genes enriched in trimethylation of histone H3 lysine 27 (H3K27me3), which is related to gene repression (Zhang et al., 2008, 2012), and main-tains this epigenetic state (Carter et al., 2018). In addition, PKL reduces H3K27me3 at specific target genes in particular tissues and environments (Jing et al., 2013). Changes in H3K27me3 and H3K4me3 were also reported in the rice (Oryza sativa) mutant of a CHR4 homologue (Hu et al., 2012). To test whether CHR4 regulates gene expression by influencing histone modifications, we compared global H3K27me3 and H3K4me3 levels in Col-0 and chr4-2 plants (Supplemental Figure 8). No clear difference in the global frequency of these histone marks was observed between the two genotypes, suggesting that CHR4 does not affect the total accumulation of these histone modifications.
To test whether CHR4 affects the deposition of these histone marks at specific loci, we performed chromatin immunoprecipitation
Figure 4. Temporal and Spatial Patterns of Expression of the Floral Meristem Identity Gene AP1 in Col-0, chr4-2, svpflc ft tsf soc1, and qem2. In situ hybridization analysis of AP1 mRNA accumulation in the SAMs of plants under SDs. The genotypes analyzed are shown together with the number of weeks (w) after germination when material was harvested. For each time point and genotype, three independent apices were examined with similar results. Scale bar5 50 mm.
sequencing (ChIP-seq) to compare genome-wide H3K27me3 and H3K4me3 levels in Col-0 and chr4-2. H3K27me3 and H3K4me3 ChIP-seq experiments were performed on three bi-ological replicates for each genotype (see Methods). In total,
10,194 H3K27me3-marked regions and 15,992 H3K4me3-marked regions were identified in the two genotypes (Supplemental Data Set 4). Quantitative comparison with DANPOS2 (Chen et al., 2013) revealed a subset of regions with significant differences
Figure 5. Transcriptional Changes in chr4 Mutants.
(A) Transcriptional profile comparisons represented as a heatmap to highlight genes implicated in flowering time control that are significantly upregulated (red) or downregulated (blue) in chr4-2 compared with wild type. Gene expression changes are represented as log2-fold change.
(B) Box plots from RNA-seq data showing FD, TFL1, FUL, and SPL4 transcript levels in apices of chr4-2 and Col-0 under SDs. The Y-axis shows TPM. The X-axis shows time of sampling as weeks after sowing. Whiskers represent distance from the lowest to the largest data point.
(C) Transcriptional profile comparisons represented as a heatmap to highlight genes implicated in flowering time control that are significantly upregulated (red) or downregulated (blue) in qem2 compared with svpflc ft tsf soc1.
(D) Box plots from RNA-seq data showing FUL, SPL4, LFY, and BRANCHED1 (BRC1) transcript levels shown as TPM in apices of qem2 and svpflcft tsf soc1 under SDs. The Y-axis shows TPM. The X-axis shows time of sampling as weeks after sowing. Whiskers represent distance from the lowest to the largest data point.
Table 2. List of CHR4 Interacting Proteins
Gene ID Name
SAMs with Younger Leaves at 5w-SD-Stage No. of Unique
Peptides (IP1-IP2-IP3)
Sequence Coverage (%)
(IP1-IP2-IP3) Log2Ratio P-Value
AT5G44800 CHR4 142 (128-130-114) 59.6 (55.2-55.9-53.7) 10.41 1.43e-05 Transcription factors AT1G69120 AP1 — — — — AT5G20240 PI — — — — AT3G54340 AP3 — — — — AT5G15800 SEP1 — — — — AT3G02310 SEP2 — — — — AT2G45650 AGL6 — — — — AT2G42830 SHP2 — — — — AT3G13960 GRF5 7 (6-5-4) 18.1 (15.9-13.9-9.6) 6.05 2.16e-04 AT4G37740 GRF2 6 (6-5-3) 17.4 (17.4-15.3-9.5) 5.19 1.90e-05 AT5G43270 SPL2 — — — — AT1G02065 SPL8 — — — — AT1G27360 SPL11 — — — — AT5G50670 SPL13 5 (5-4-2) 19.2 (19.2-15-6.7) 4.84 2.20e-03
AT2G28550 TOE1 5 (5-5-3) 15.4 (15.4-15.4-8.7) 4.01 1.89e-03
AT3G02150 TCP13 5 (4-4-3) 18 (18-18-10.4) 4.21 2.20e-02
Chromatin remodeler
AT2G46020 BRM 37 (30-31-16) 24.2 (19.3-19.7-10.8) 2.68 8.95e-04
AT1G08600 ATRX 23 (19-22-6) 13.9 (11.7-13.3-5.5) 5.23 9.14e-05
AT5G04240 ELF6 10 (8-10-1) 11.7 (7.8-11.7-0.8) 3.09 2.20e-03
AT2G28290 SYD 27 (21-21-15) 11.1 (7.9-7.9-5.9) 3.09 1.19e-03
AT2G25170 PKL 19 (17-17-14) 19.8 (16.7-17.4-14.8) 2.71 5.48e-04
AT3G12810 PIE1 18 (14-15-9) 11.5 (9.9-9.8-6.8) 3.23 6.26e-03
AT5G18620 CHR17 17 (15-15-8) 44.1 (42.4-42.4-25.3) 2.85 5.34e-04
AT3G06400 CHR11 12 (11-10-10) 45.1 (41.9-41.7-30.3) 2.90 6.86e-04
AT3G48430 REF6 27 (22-25-18) 23.4 (18.8-21-17) 2.92 2.49e-03
AT5G11530 EMF1 10 (7-8-3) 10.4 (6.9-8.3-3.5) 5.12 1.12e-04
AT2G06210 ELF8 14 (12-13-9) 15.9 (11.8-13.6-11.2) 2.72 2.50e-03
AT5G53430 SDG29 5 (4-5-2) 8 (7-8-4.5) 4.40 8.19e-03
AT4G02020 SWN 3 (2-1-2) 4.8 (3-1.3-3) 2.40 5.04e-03
General transcriptional coregulators
AT3G07780 OBE1 14 (13-13-8) 31.3 (29.7-31.3-20.8) 6.47 7.02e-05
AT5G48160 OBE2 23 (21-17-9) 41.5 (40.8-30.1-19.3) 5.16 3.03e-03
AT1G15750 TPL 12 (11-10-9) 31.7 (27-26.9-24.4) 3.93 3.17e-04
AT1G80490 TPR1 9 (8-7-6) 25.4 (23.6-22.5-17.5) 4.59 2.03e-03
AT3G16830 TPR2 8 (7-6-4) 13.5 (12.6-10.2-5.1) 3.57 1.99e-02
AT2G32950 COP1 7 (6-7-2) 12.7 (11.7-12.7-4.3) 3.99 4.02e-03
AT2G46340 SPA1 10 (7-10-3) 13.2 (9.2-13.2-3.6) 2.72 3.80e-02
AT1G43850 SEU 12 (11-10-6) 18.1 (16.9-12.9-9.9) 3.69 2.49e-03
Inflorescence under LDs
AT5G44800 CHR4 117 (114-99-114) 51.4 (51.4-49.7-51.2) 8.76 1.09e-04
Transcription factors
AT1G69120 AP1 12 (8-3-7) 34 (21.5-10.2-24.2) 3.55 1.24e-02
AT5G20240 PI 8 (6-3-8) 31.7 (25.5-11.5-31.7) 6.31 3.36e-03
AT3G54340 AP3 7 (7-5-7) 31.5 (31.5-19-31.5) 4.56 4.63e-02
AT5G15800 SEP1 2 (2-1-2) 23.5 (23.5-17.1-21.9) 4.06 2.63e-02
AT3G02310 SEP2 3 (2-1-2) 32.8 (23.6-17.2-22) 4.05 4.47e-03
AT2G45650 AGL6 3 (3-2-3) 10.3 (10.3-10.3-10.3) 3.78 9.16e-03
AT2G42830 SHP2 4 (4-3-4) 29.3 (29.3-24-29.3) 4.88 6.01e-03 AT3G13960 GRF5 4 (3-3-4) 13.6 (9.1-9.1-13.6) 3.62 3.28e-02 AT4G37740 GRF2 1 (1-1-1) 3.2 (3.2-3.2-3.2) 1.39 2.17e-01 AT5G43270 SPL2 4 (4-4-4) 17.2 (17.2-17.2-17.2) 5.30 3.32e-03 AT1G02065 SPL8 4 (4-2-4) 18.3 (18.3-12-18.3) 3.93 1.40e-02 AT1G27360 SPL11 8 (5-2-7) 27 (17.8-10.2-21.9) 5.57 1.53e-03 (Continued)
(FDR < 0.05) in H3K27me3 or H3K4me3 levels between Col-0 and chr4-2. In total, 857 regions were differentially marked with H3K27me3 and 1,032 regions were differentially marked with H3K4me3 (Supplemental Data Set 4). Notably, hypermethylated as well as hypomethylated regions were identified in chr4-2 (Figure 6A). The genes differentially marked with H3K27me3 included regulators of key hormonal pathways involved in thefloral transition, such as GIBBERELLIN3-OXIDASE1 and GIBBERELLIN3-OXIDASE4, which encode GA biosynthesis en-zymes. Genes encoding components of auxin signaling (ETTIN and AUXIN RESISTANT1) and an enzyme that catabolizes cytokinin (CYTOKININ OXIDASE5) were also differentially marked with H3K27me3 in chr4-2 (Supplemental Data Set 4). Genes differentially marked with H3K4me3 included the regulators of thefloral transition SPL15, FLORAL TRANSITION AT THE MERISTEM1 (Torti et al., 2012), and JUMONJI DOMAIN-CONTAINING PROTEIN30 (Jones et al., 2010; Yan et al., 2014; Supplemental Data Set 4). In addition, 39 genes differentially marked by both H3K27me3 and H3K4me3 were detected, in-cluding the flowering-time regulators miR156D and AGL19 (Figure 6C; Supplemental Data Set 4).
We also examined the extent to which the differentially marked genes were also differentially expressed. H3K27me3 is associ-ated with gene repression, and therefore, genes with higher
H3K27me3 levels in chr4-2 compared with Col-0 were expected to be expressed at lower levels in chr4-2 than in Col-0. Indeed, a significant overrepresentation (Representation factor: 6.2, P-value < 1.317e-11) of downregulated genes was observed among those marked with increased levels of H3K27me3 in chr4-2 (Figure 6B). Among the downregulated and hypermethylated genes in chr4-2 was AHL3, encoding an AT-hook protein that regulates vascular tissue boundaries in roots (Figure 6C; Zhou et al., 2013). By contrast, H3K4me3 is associated with gene ac-tivation and therefore, genes marked with higher H3K4me3 levels in chr4-2 compared with Col-0 were expected to be expressed at higher levels. Indeed, a significant overrepresentation (Repre-sentation factor: 10.8, P-value < 2.176e-48) of upregulated genes between those marked with higher levels of H3K4me3 was ob-served (Figure 6B). Among the upregulated and hypermethylated genes in chr4-2 are CHR23, which is involved in stem-cell maintenance at the SAM (Sang et al., 2012) and SPL15, a pro-moter of thefloral transition at the shoot meristem (Figure 6C; Hyun et al., 2016). Moreover, spl15 produced fewer cauline leaves than the wild type (Schwarz et al., 2008), indicating a premature transition to the I2phase offlower initiation. On the other hand,
plants expressing a miR156-resistant transcript of SPL15, which leads to an increase in SPL15 protein accumulation, produced more cauline leaves than the wild type (Hyun et al., 2016),
Table 2. (continued).
Gene ID Name
SAMs with Younger Leaves at 5w-SD-Stage No. of Unique
Peptides (IP1-IP2-IP3)
Sequence Coverage (%)
(IP1-IP2-IP3) Log2Ratio P-Value
AT5G50670 SPL13 4 (3-1-4) 13.9 (11.1-3.1-13.9) 3.68 4.96e-03
AT2G28550 TOE1 — — — —
AT3G02150 TCP13 6 (5-3-5) 18.3 (15.5-10.1-15.5) 3.96 5.85e-03
Chromatin remodeler
AT2G46020 BRM 24 (13-12-18) 13 (8.6-8.4-10) 2.57 2.36e-02
AT1G08600 ATRX 28 (20-18-24) 18.3 (13.8-13.3-16.3) 4.64 2.59e-03
AT5G04240 ELF6 4 (4-1-4) 5.8 (5.8-0.7-5.8) 2.63 5.22e-02
AT2G28290 SYD 21 (19-12-20) 8 (7.6-4.6-8) 3.70 4.76e-02
AT2G25170 PKL 26 (23-18-24) 23.6 (23-17.4-20.9) 3.49 1.38e-02
AT3G12810 PIE1 7 (4-3-6) 4.5 (3.2-2.6-4.1) 1.89 1.04e-01
AT5G18620 CHR17 14 (11-13-12) 37.4 (35.6-32.6-37.2) 2.97 1.49e-02
AT3G06400 CHR11 17 (13-9-14) 41.3 (39.2-32-39.1) 2.34 9.72e-03
AT3G48430 REF6 33 (27-17-29) 28.8 (24.8-12.9-24.5) 2.21 1.39e-02
AT5G11530 EMF1 7 (6-3-7) 8.5 (7.8-2.9-8.5) 3.31 1.96e-02
AT2G06210 ELF8 — — — —
AT5G53430 SDG29 7 (4-1-5) 10.6 (7-2.5-7.2) 1.99 3.08e-02
AT4G02020 SWN 3 (2-2-2) 4.2 (2.5-2.5-2.5) 1.52 3.13e-02
General transcriptional coregulators
AT3G07780 OBE1 12 (7-6-8) 26 (17.8-14.7-20.7) 4.12 3.47e-03
AT5G48160 OBE2 11 (9-5-11) 26.3 (21.3-12.9-26.3) 3.73 6.56e-03
AT1G15750 TPL — — — —
AT1G80490 TPR1 — — — —
AT3G16830 TPR2 — — — —
AT2G32950 COP1 4 (3-3-3) 6.7 (5.6-5.6-5.6) 1.17 1.63e-01
AT2G46340 SPA1 3 (1-1-2) 4.4 (1.4-1.4-2.6) 1.75 9.65e-03
AT1G43850 SEU 7 (6-2-6) 9.8 (9.7-3.6-8.6) 3.55 2.64e-03
Figure 6. Histone Modification Variation in chr4-2.
(A) Scatterplots showing H3K27me3 and H3K4me3 enrichment between Col-0 and chr4-2 in apices of 5-week–old plants grown under SDs. Blue and orange dots represent significantly more highly methylated regions at FDR 5 0.05 in Col-0 and chr4-2, respectively.
(B) Venn diagram showing the overlap between DEGs and genes differentially marked by H3K27me3 and H3K4me3. (C) H3K27me3 and H3K4me3 profiles and expression of AHL3, AGL19, CHR23, and SPL15.
indicating a delay in the transition to the I2phase offlower initiation, as observed in qem2 mutants.
In conclusion, CHR4 affects H3K27me3 and H3K4me3 levels at a subset of loci in the genome, and changes in both histone modifications in chr4-2 are significantly correlated with changes in gene expression. Notably, a significant increase in H3K4me3 was detected at the SPL15 locus, and a higher level of SPL15 mRNA was found in chr4-2; thesefindings are consistent with the pre-mature bolting and delay in the transition to the I2phase offlower
initiation observed in chr4-2. DISCUSSION
We performed an enhanced genetic screen to identify regulators of thefloral transition, and in particular, to focus on endogenous flowering pathways at the shoot meristem. To this end, we gen-erated a quintuple mutant background strongly impaired infloral responses to environmental stimuli. Mutagenesis of these plants identified a chromatin remodeler, CHR4, which plays important roles in thefloral transition, especially in response to endogenous flowering pathways and during the transition from forming cauline leaves with axillary branches (I1) to formingfloral primordia (I2).
The Quintuple Mutant Is Strongly Impaired in Environmental Flowering Responses and Flowers via Endogenous Pathways
The quintuple mutant showed strongly reduced flowering responses to long photoperiods and high ambient temperature. This insensitivity is consistent with the loss of function of FT and TSF, which confer photoperiodic responses, and the loss of function of FT, TSF, and SVP, which are involved in responses to high ambient temperature (Yamaguchi et al., 2005; Kumar et al., 2012; Fernández et al., 2016). Therefore, thefloral transition in the quintuple mutant is likely promoted by endogenousflowering pathways. In support of this conclusion, RNA-seq analysis de-tected higher mRNA levels of several SPL genes in the mutant versus Col-0. Some of these genes, such as SPL15 and SPL4, are negatively regulated by miR156, which decreases in abundance as plants proceed from the juvenile to the adult phase (Wu and Poethig, 2006; Gandikota et al., 2007; Hyun et al., 2016). There-fore, these SPLs were previously considered to be components of an age-relatedflowering pathway (Wang et al., 2009; Hyun et al., 2017). However, the mRNA of SPL8, which is not regulated by miR156 but has overlapping functions with the miR156-targeted SPL genes (Xing et al., 2010), also increased in abundance in the quintuple mutant, suggesting a broader deregulation of this class of transcription factors in this genetic background.
Transcriptome profiling of the quintuple mutant also detected differential expression of genes encoding enzymes involved in GA biosynthesis, such as GA20ox2. Higher GA20ox2 mRNA ex-pression was detected in the quintuple mutant compared with Col-0 under SDs. The accumulation of GA4under SDs in
Col-0 plants coincides with thefloral transition and increased abun-dance of the mRNAs offloral meristem identity genes such as LFY (Eriksson et al., 2006). Although the GA biosynthesis pathway is complex and includes many enzymatic steps (Yamaguchi, 2008), GA20ox2 appears to be important for controlling thefloral
transition, especially under SDs (Rieu et al., 2008; Plackett et al., 2012; Andrés et al., 2014). SVP reduces GA20ox2 transcript levels and GA levels at the shoot apex as part of the mechanism by which it repressesflowering (Andrés et al., 2014). We therefore propose that increased GA20ox2 transcription in the quintuple mutant contributes to its higher GA levels and earlierfloral transition under SDs. In support of this notion, the qem1 mutation was found to be an allele of GA20ox2 and to delay flowering of the quintuple mutant.
The proposed role for SPLs and GA in causing earlyflowering of the quintuple mutant is consistent with the previousfinding that SPL proteins mediate some of the effects of GA during re-productive development (Porri et al., 2012; Yu et al., 2012; Yamaguchi et al., 2014; Hyun et al., 2016) and that SPL8 regulates several GA-mediated developmental processes (Zhang et al., 2007). Furthermore, SPL9 and SPL15 interact with DELLA pro-teins, which are negative regulators of GA responses that are degraded in the presence of GA (Davière and Achard, 2013). SPL15 promotes the transcription of target genes that induce flowering, such as FUL and miR172b, and activation of these genes by SPL15 is repressed by interaction with DELLAs (Hyun et al., 2016). In Col-0, the role of SPL15 inflowering is particularly important under SDs, whenfloral induction occurs independently of environmental cues and is dependent on endogenous pro-cesses such as the GA pathway (Hyun et al., 2019). By contrast, the DELLA-SPL9 interaction can negatively or positively affect transcription, depending on the target genes and the developmental context (Yamaguchi et al., 2009; Yu et al., 2012). Taken together, these results demonstrate that thefloral transition in the sensitized quintuple mutant background involves the interdependent functions of GA and SPL proteins.
A Chromatin Remodeler Was Identified as a Regulator of the Floral Transition in the Sensitized Screen
The genetic framework forflowering-time control in Arabidopsis is based on analysis of late-flowering mutants identified after mu-tagenesis of early-flowering accessions (Koornneef et al., 1998). However, important regulators were not identified in these screens, but were readily found as early-flowering mutants from mutagenizing late-flowering lines (Michaels and Amasino, 1999) or as late-flowering suppressor mutants after mutagenesis of transgenic plants or mutants requiring vernalization (Chandler et al., 1996; Onouchi et al., 2000). Here, we extended this approach by mutagenizing a quintuple mutant background thatflowered almost independently of environmental cues. Until recently, the molecular characterization of mutations isolated in such complex backgrounds using classical genetic approaches would have been extremely time-consuming and laborious, but this process has been simplified by the implementation of bulk-segregant analysis after backcrossing the mutant to the progenitor fol-lowed by whole-genome resequencing (Abe et al., 2012; Hartwig et al., 2012; Schneeberger, 2014).
The second characterized mutation identified in the quintuple mutant background, qem2, is an allele of CHR4. This gene enc-odes a chromatin remodeler that was previously identified as a member of protein complexes that include AP1 and other MADS-box transcription factors (Smaczniak et al., 2012), but its role in
flowering had not been demonstrated genetically. Nevertheless, several chromatin modifiers and remodelers contribute to the regulation of thefloral transition (Farrona et al., 2008), such as BRAHMA (BRM), a member of the SWI/SNF complex involved in nucleosome sliding and/or eviction, and the H3K27me3-specific histone demethylase RELATIVE OF EARLY FLOWERING6 (REF6), which acts cooperatively with BRM to regulate gene expression duringfloral development (Farrona et al., 2004; Lu et al., 2011; Wu et al., 2012; Li et al., 2016; Richter et al., 2019). Also, the SWI2/SNF2-RELATED1 complex protein PHOTOPERIOD-INSENSITIVE EARLY FLOWERING1 (PIE1) is involved in H2A.Z deposition and delays thefloral transition (Noh and Amasino, 2003; March-Díaz et al., 2008; Coleman-Derr and Zilberman, 2012). Interestingly, PKL and PIE1 were previously proposed to act in the same pathway to define and maintain genomic domains with elevated H3K27me3 levels, suggesting that CHR4 may contribute at different levels within this process (Carter et al., 2018). Taken together, MS identified several proteins in associ-ation with CHR4 that are involved in regulating histone mod-ifications as well as multiple transcription factors with specific roles infloral meristem identity or the floral transition, suggesting that CHR4 functions in different multimeric complexes that reg-ulateflowering.
CHR4 Affects the Expression of Flowering Genes by Modulating H3K4me3 and H3K27me3 Levels and Affects Different Stages of the Floral Transition
The most closely related protein to CHR4 is another CHD3-like family member, PKL, which orchestrates deposition of H3K27me3 and facilitates nucleosome retention (Zhang et al., 2008, 2012; Jing et al., 2013; Carter et al., 2018). In rice, loss of function of the CHR4 homologue CHR729 results in changes in the abundance of H3K27me3 and H3K4me3 at;56% and 23%, respectively, of loci marked by these modifications (Hu et al., 2012). Similarly, we observed variation in H3K27me3 or H3K4me3 levels at a subset of loci marked by these modifications in chr4-2, indicating a con-served function between rice and Arabidopsis. Notably, we ob-served higher levels of H3K4me3 at the SPL15 locus in chr4-2 versus the wild type.
Thefloral transition is considered to be a dual-step process: In thefirst step, the inflorescence meristem produces cauline leaves and axillary branches (I1); and in the second step, it formsfloral primordia (I2; Ratcliffe et al., 1999). Detailed phenotypic analysis of
chr4 mutants showed that CHR4 affects both these phases but with opposite effects. The chr4 mutation accelerates the transition from the vegetative meristem to I1but delays the I1to I2transition.
The premature transition to I1was reflected by earlier bolting, and this correlated with increased abundance of SPL15, SPL4, and FUL mRNA expression. These genes are associated with early bolting andflowering, and SPL15 in particular caused premature bolting when its expression was increased by mutations that rendered its mRNA insensitive to miR156 (Hyun et al., 2016). SPL15 also promotes the meristematic transition from vegetative to inflorescence meristem (Hyun et al., 2016). Moreover, spl15 mutants produced fewer cauline leaves than the wild type (Schwarz et al., 2008), whereas rSPL15 transgenic plants pro-duced more cauline leaves (Hyun et al., 2016), indicating that
SPL15 extends the I1 phase. We propose that the higher ex-pression of SPL15 in chr4 promotes earlier bolting and extends the I1phase. This increased activity of SPL15 could also be enhanced in chr4 by increased activity of the GA biosynthetic pathway, as the resulting reduction in DELLA activity would be predicted to allow SPL15 to more effectively activate transcription of its target genes, leading to premature bolting and more cauline leaves.
Mutant chr4 plants also produced more cauline leaves and required more time to open thefirst flowers than their progenitors, indicating a delay in the I2transition. These mutants also exhibited higher levels of TFL1 and BFT mRNAs; the overexpression of these genes delays the I2transition by repressing AP1 and LFY expression (Ratcliffe et al., 1998; Yoo et al., 2010). Consistent with this conclusion, the onset of AP1 transcription occurred later in qem2 than in the quintuple mutant progenitor, and LFY mRNA was less abundant in qem2 than in the quintuple mutant in the RNA-seq time-course at week 6 in SDs. The chr4 mutant phenotype is strongly enhanced in the quintuple mutant background, probably explaining why chr4 was recovered in the sensitized mutant screen but was not previously identified by mutagenesis of Col-0 plants, where it exhibited a strong effect only under SDs. We propose that CHR4 contributes to thefloral transition in response to GA signaling and that the increased dependency of the quin-tuple mutant on the GA pathway to promoteflowering increases the impact of CHR4 loss of function on the floral transition. Similarly, the stronger phenotype of chr4-2 in Col-0 under SDs than LDs is consistent with a specific role in the floral transition mediated by GA.
In conclusion, the combination of forward genetics and func-tional gene characterization identified CHR4 as a regulator of different stages of the floral transition. Immunoprecipitation of CHR4 suggested that it acts in distinct protein complexes that contain different transcription factors as well as other CHR pro-teins. The contribution of CHR4 within distinct complexes pre-sumably explains its pleiotropic effects, even duringflowering, where it affects both bolting andfloral identity during the transition from I1to I2. Our genome-wide analyses represent thefirst step in
understanding the mechanism through which CHR4 affects these phenotypes by identifying genes whose expression is altered by H3K27me3 or H3K4me3 in chr4 mutants. Further studies are now required to link the specific protein complexes in which CHR4 contributes to histone changes on defined targets. Attempts to perform ChIP-seq on pCHR4:CHR4-VENUS lines did not suc-ceed, but pursuing this approach in the future would define the genome-wide sites with which CHR4 associates and help define its effects on the histone marks at direct target genes. Such approaches would help determine the mechanisms by which CHR4 regulates gene expression and allow this mechanism to be compared with that of PKL, which cooperates with PIE1 and CLF at target genes to maintain elevated H3K27me3 levels (Carter et al., 2018).
METHODS
Plant Materials, Growth Conditions, and Phenotypic Analysis For all studies, Arabidopsis (Arabidopsis thaliana) Columbia (Col-0) eco-type was used as the wild eco-type. To construct the svp-41flc-3 ft-10 tsf-1
soc1-2 quintuple mutant, svp-41flc-3 FRI plants (Mateos et al., 2015) were first crossed to svp-41 ft-10 tsf-1 soc1-2 ful-2 plants (Andrés et al., 2014). The F1plants were self-fertilized and the F2progeny were genotyped for each mutation except ful-2, which was scored phenotypically. Approxi-mately 1,000 F2plants were grown in soil under LD conditions and DNA was extracted from those that flowered later than Col-0. Genotyping was performed to identify plants that carried all mutations, lacked the FRI in-trogression, and were homozygous for FUL in the F3generation. chr4-2 corresponds to SAIL_783_C05. Homozygous mutant plants were selected by PCR using specific primers (Supplemental Data Set 5).
Seeds were immersed in 0.1% melt universal agarose (Bio-Budget Technologies) for 3 d at 4°C in darkness for stratification. Plants were grown in soil under controlled conditions of LDs (16-h light/8-h dark) and SDs (8-h light/16-h dark) at 21°C or 27°C. The light intensity was 150mmol$m22$s21 under all conditions. The growth-chamber is equipped withfluorescent tube bulbs (F17T8/TL841 ALTO-T8; Philips) to supply wavelengths from 430 to 650 nm, and supplemented with LEDs to provide light in the far-red spectrum. As a proxy forflowering time, the number of rosette and cauline leaves on the main shoot was counted as well as the number of days to bolting andfirst flower opening.
Ethylmethanesulfonate Treatment of Seeds
For ethylmethanesulfonate (EMS) treatment, 200 mg (;10,000) seeds of the quintuple mutant were wrapped in Miracloth (EMD Millipore) and im-mersed in 0.1% (v/v) KCl solution on a shaker at 4°C for 14 h. The seeds were washed with double distilled water and treated with 100 mL of 30-mM EMS diluted in double distilled water on a magnetic stirrer in a fume hood overnight (8 h to 9 h). The seeds were washed twice with 100 mL of 100-mM sodium thiosulfate for 15 min and three times with 500 mL of double distilled water for 30 min. After washing, the seeds were immersed in 2 L of 1% (w/v) agarose. Approximately 50 seeds in 10 mL of agarose were sown as the M1
generation in 93 9 cm pots using plastic pipettes. The M1plants were
grown and self-fertilized, and seeds were harvested in bulks of 50 M1
plants. One-hundred-and-forty-six M2bulked families were screened for
plants showing alteredflowering time.
GA Treatment
The GA4stock (cat. no. G7276-5MG; Sigma-Aldrich) was prepared in 100% ethanol with afinal concentration of 1 mM. GA treatments were performed by spraying 2-week–old plants under SDs with either a GA solution (10 mM of GA4and 0.02% [v/v] Silwet 77; Loveland Industries) or a mock solution (1% [v/v] ethanol and 0.02% [v/v] Silwet 77). Spraying was performed twice weekly until the plants bolted.
Selection of Mutants and Sequencing
Approximately 10 M2generation seeds from each M1plant were sown.
Screening for potential mutants was initially performed under LD green-house conditions, and all plants were grown together with the quintuple mutant and Col-0 plants as a reference. Individuals thatflowered later or earlier than the quintuple mutant in the M2population were selected. These
M2putative mutants were self-fertilized and rescreened in the M3 gener-ation. Approximately 24 M3progeny of each potential mutant were grown under the same conditions to test the heritability of the phenotype. M3 plants were backcrossed to the quintuple mutants to generate BC1F1 seeds. The BC1F2offspring of such a cross formed the isogenic mapping population. Approximately 70 plants showing the mutant phenotype were selected from a population of;300 BC1F2plants. One leaf sample of each selected plant was harvested and pooled. Leaf material from the quintuple plants was also harvested as a control. Genomic DNA was extracted from both pools and sent for Illumina sequencing with a depth of;80-fold
coverage. Reads were aligned to The Arabidopsis Information Resource (TAIR10) reference genome (ftp://ftp.arabidopsis.org/home/tair) using the software tool SHORE (Schneeberger et al., 2009). The program SHOREmap (Schneeberger et al., 2009; Sun and Schneeberger, 2015) was used to identify polymorphisms, and those present in;100% of reads in the identified mutant but absent from the progenitor were identified as candidates for the causal mutation.
In Situ Hybridization
In situ hybridization was performed as described in Bradley et al. (1993), with minor modifications. Instead of Pronase, proteinase K (1 mg/mL in 100 mM of Tris at pH 8, and 50 mM of EDTA) was used for protease treatment by incubating at 37°C for 30 min. Post-hybridization washes were performed in 0.13 saline sodium citrate instead of the original 23 saline sodium citrate with 50% (w/v) formamide. The sequences of primers used to generate the probes are listed in Supplemental Data Set 5. For each genotype and time point, three independent apices were analyzed.
RNA Extraction and RNA-Seq Analysis
Total RNA was extracted from 15 shoot apices after removing all visible leaves under a binocular for each of the three independent biological replicates using an RNeasy Plant Mini Kit (Qiagen) and treated with DNase (Ambion) to remove residual genomic DNA. Library for sequencing was prepared using a TruSeq Library Preparation Kit (Illumina) according to the manufacturer’s protocol. Sequencing was performed using the HiSeq 3000 platform (Illumina) in 150-bp single reads. For each sample,;15,000,000 reads were generated. The software tool FastQC was used to assess quality control parameters (https://www.bioinformatics.babraham.ac.uk/projects/ fastqc/). To estimate expression levels, the RNA-seq reads were mapped to the Arabidopsis TAIR10 (Lamesch et al., 2012) reference genome using the software TopHat2 under default settings (Kim et al., 2013), except that only a single alignment was permitted per read and the coverage-based junction search was disabled (settings: 2g 1 –no-coverage-search). The program Samtools was used to sort and index BAM alignmentfilesandtocalculateBAM file statistics (Li et al., 2009). The software HTSeq was used to tabulate the number of reads mapping to each genomic feature, with counts tabulated only for genes that completely overlapped a given feature (Anders et al., 2015). We used the Wald test implemented in the program DESeq2 (https://bioconductor. org/packages/release/bioc/html/DESeq2.html) to detect DEGs for pair-wised comparison. To visualize the expression levels of candidate genes, the ex-pression level for each gene was calculated as transcripts per million (TPM).
ChIP-Seq Experiment and Data Analysis
Three independent biological replicates for each genotype were generated. For each sample, 1 g of plant material was used per biological replicate. Material was collected from plants grown in SD at 21°C for 5 weeks (5 h to 6 h after lights on). Using jeweler’s forceps, leaves with elongated petioles were removed to obtain SAM-enriched tissues. ChIP experiments were performed following a protocol from Kaufmann et al. (2010) with minor modifications. Samples were sonicated in a water bath Bioruptor (Dia-genode) four times for 5 min each of 15 s on and 15 s off, with a 1-min incubation between each sonication treatment. After the preclearing step, the sample was split into three aliquots: Thefirst aliquot was incubated with anti-H3K27me3 antibody (cat. no. 39155, lot no. 25,812,014; Active Motif), the second one was incubated with anti-H3K4me3 antibody (cat. no. 17–614, lot no. 1973237; Millipore), and the third one with anti-H3 antibody (cat. no. ab1791; Abcam). Samples were prepared for Illumina sequencing using the Ovation Ultralow V2 DNA-Seq Library Preparation Kit (Tecan Genomics) according to the manufacturer’s protocol. H3K27me3 and