HAL Id: cirad-00845393
http://hal.cirad.fr/cirad-00845393
Submitted on 17 Jul 2013
HAL is a multi-disciplinary open access
archive for the deposit and dissemination of
sci-entific research documents, whether they are
pub-lished or not. The documents may come from
teaching and research institutions in France or
abroad, or from public or private research centers.
L’archive ouverte pluridisciplinaire HAL, est
destinée au dépôt et à la diffusion de documents
scientifiques de niveau recherche, publiés ou non,
émanant des établissements d’enseignement et de
recherche français ou étrangers, des laboratoires
publics ou privés.
Quantitative trait dissection analysis in Eucalytus using
RAPD markers: 2. Linkage disequilibrium in a factorial
design between E. urophylle and E. Grandis.
Daniel Verhaegen, Christophe Plomion, Mireille Poitel, Paulo Costa, Antoine
Kremer
To cite this version:
Daniel Verhaegen, Christophe Plomion, Mireille Poitel, Paulo Costa, Antoine Kremer. Quantitative
trait dissection analysis in Eucalytus using RAPD markers: 2. Linkage disequilibrium in a factorial
design between E. urophylle and E. Grandis.. Forest genetics, 1998, 5 (1), pp.61-69. �cirad-00845393�
QUANTITATIVE TRAIT DISSECTION ANALYSIS IN EUCALYPTUS USING RAPD
MARKERS: 2. LINKAGE DISEQUILIBRIUM IN A FACTORIAL DESIGN
BETWEEN E. UROPHYLLA AND E. GRANDIS
Daniel Verhaegen', Christophe Plomionz, Mireille Poitel', Paulo Costa2 & Antoine Kremer2
''
CIRAD ForCt, Baillarguet BP 5035, F-34032 Montpellier Cedex 1 , France') INRA, Station d c Recherches Forcstikres, Laboratoire de GknCtique et AmClioration des Arbres Forestiers, B P 45,
F-33610 Cestas. France
Received Januarj. 15, 1997; accepteil Jarluary 15, 1998
ABSTRACT
.4 13 x 13 factorial design between E. rlr.opllj,llu and E. grmclis, comprising 87 full-sib families, was used to
assess the relationships between RAPD marker frequency classes obtained from parental genotypes and the interspecific additive mean (IAM) of the hybrid progeny. For any markcr showing a significant association, the cumulative number of the " present band " allele in the parents was significantly correlated either positively or
negatively, with the IAM of the traits studied: i.e. volume, stem taper and wood quality. We discuss the potential
origin of such correlations in terms of linkage disequilibrium between QTL allele and marker allele. We also examine the possible use of such information, firstly in order to select the parents for further generations of breeding, and secondly in ordcr to choose thc hybrid families in which QTAs of specific value could be detected and uscd to identify the best trees to be vegetatively propagated for the production of clonal variety.
Key words: Erculyptr~s, factorial design, QTL, marker-assisted selection, linkage disequilibrium
INTRODUCTION
Forest trees are allogamous undomesticated organisms characterized by a high genetic heterogeneity (HAM-
RICK et al. 1992). The association between alleles at marker loci and at quantitative trail loci (QTL, GELDERMANN, 1975) is likely to be in linkage equilib- rium in the populations (reviewed by STRAUSS et ul.
1992), due to high levels of heterozygosity and because of recombination. Therefore, marker-assisted selection (MAS) might be questionable for forest trees. Con- versely, in autogamous crop plants or species treated as such for breeding purposes, it is expected that the association between a marker allele and a linked QTL allele (QTA) would be consistent over many individu- als of a breeding population due to linkage disequilib- rium.
However, relying on the RAPD (random amplified polymorphic DNA) technology (WILLIAMS et al. 1990), GRATTAPAGLW and SEDEROFF (1994) presented a solution to deal with linkage equilibrium in forest trees. They showed that it was possible to construct individ- ual tree maps in a very short period of time, allowing the determination of location, number and the effect of QTLs within virtually every two-generation pedigree in a breeding program. In the mapping strategy they developed ("the two-way pseudo-testcross mapping
strategy"), two parental maps are first constructed, with RAPD segregating in the 1:l ratio within a hybrid family, and a QTL analysis carried out independently for both parents of the cross under the backcross model. In such full-sib progeny of heterozygous parents, the analysis of marker-trait association leads to the detection of "specific" QTLs (LEONARDS-SCHIP-
PERS et a / . , 1994; GRATTAPAGLIA et a[. 1995, VER-
HAEGEN e t a / . 1997). QTLs detected in such a narrow gecetic background can readily be used to identify the ideotype to be propagated for clonal variety production (GRATTAPAGLIA et al. 1995; O'MALLEY, 1996, VER-
HAEGEN et (11. 1997). Such a marker-assisted clonal
propagation is valuable for those species where vegeta- tive multiplication is efficient (e.g. eucalyptus, poplar, willow, cryptomeria, larch, radiata pine, acacia, gme- h a , ayous). However, in order to use such QTL for breeding purposes, i.e, to select parents for subsequent generations of breeding, the value of favorable QTAs need to be evaluated over a wider genetic background. An analytical method aimed at estimating the breeding value of such RAPD-QTA in forest tree populations has been proposed by PLOMION and DUREL (1996). It is based on the analysis of the half-sib families, involv- ing both parents of the hybrid progeny. Alternatively, ARCADE et al. (1996) have used factorial design in larch to detect QTL of general value. Their approach
consisted on genotyping the parents with RAPD markers, measuring quantitative traits on the full-sib progenies, and investigating the statistical relationship between expected RAPD marker "present band " allele frequency in the F , , and family performances. Mu-
RANTY (1996) also proposed the use of diverse experi- mental designs involving FS families as an efficient strategy to detect QTL in outbred species. Her ap- proach involved marker genotyping and trait measure- ment on F , progeny. However the number of progeny to be genotyped could be rapidely prohibitive. When few traits are analyzed, MURANTY etal. (1997) consid-
ered a selective genotyping approach for the location and estimation of the effect of a quantitative trait locus.
Here, we present experimental data on E ~ ~ c a l ) p t l ~ s where the significance of marker-trait associations was determined using a factorial design of the breeding program. Our objectives were twofold: (i) to determine to what extent markers (whether linked or not to putative QTLs detected in a single full-sib family) could affect the expression of wood density, volumc of the bole and form of the trunk, in a larger genetic background, and (ii) to use molecular marker data to predict the interspecific additive mean of hybrid families. The eucalyptus breeding program is bascd on hybrids of E. i~roplzjlla x E. grandis which havc
demonstrated a high potential for industrial plantation in the Congo (VIGNERON 1991). Today, commercial plantations of Eucalyptus in this country cover 45,000 hectares and the principal product is round wood for export to pulp mills.
MATERIALS AND METHODS
Genetic materials and factorial design analysis
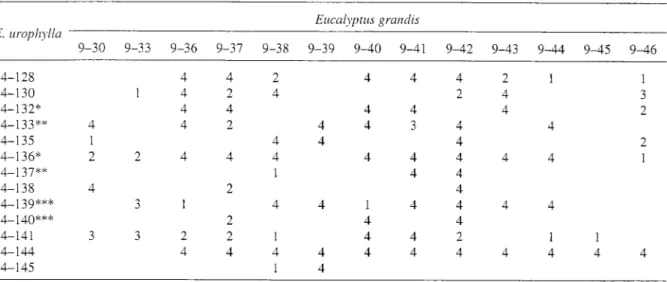
A factorial design (R90-11, Table 1) consisting of 13
E. wophjlla as female parents and 13 E. grarzclis as
male parents was established in 1990. Mother trees were selected in eight open pollinated families from the Monte Lewotobi provenance in the Island of Flores, and in three open pollinated families from the Monte Egon provenance on the Island of Timor, of the Sonda Archipelago. Pollen used for crosses was collected from seven provenances in the northern part of the natural area near Atherton, Queensland (Australia). This design was incomplete since the ratio of full cells to total cells was 5 1 %, i.e. 87 interspecific F , progeny
were available (Table 1). The design was established in 32 incomplete blocks with a variable number of repli- cates (1 to 4 among crosses, Table 1). The experimental unit was a square plot of 4*4=16 hybrids. The traits were: (i) pilodyn pin penetration depth in the trunk (PIL) measured with a penetrometer at 18 months; this
trait is commonly used to evaluate wood density in the eucalyptus breeding program, ( ~ i ) vigor measured at 18, 26 and 38 months by mcans of the volume of the bole (VIG); the volume was calculated from height and circumference, by considering the trunk as a cone surperimposed on acyclindcr, (iii) height/diameter ratio (HDR) also measured at 18, 26 and 38 months. 38 months corresponded to actual selection age. Individual values were adjusted for the block effcct with the software package OPEP (BARADAT 1989) and then used in the following fixed model:
were Y,,, is the phenotypic value of individual kt'' of the crossing bctwecn il"lnale and j'l' female;
p
is the overall mean; M, is the effect of i"' male; F, is the effect of jLh female and M*F,, is the interaction effcct between it" male and j"' female; and E,,, is thc within-replicate residual.The factorial mating design allowed estimation of some genetic variance components: additive and dominance variances. We assumed that epistatic variance was negligible and that the inbreeding coeffi- cient of the parents was zero. In this paper we only consider the mcan estimated for the hybrid population. The dominance effects for the studied traits werc rather low, and decreased with age (BOUVET & VIGNEKON
1995). This parameter was not considcred in this study but many details relating to the prediction of the specific combining ability have been reported by BARRIL et al. (1997a, 1997b). We did not investigate
the marker-GCA associations at parental level because sample sizes were low (13 trees in each species). Rather, we studied the association between the inter- specific additive mean (JAM,,= p
+
M,+
F,) and the frequency classcs of the RAPD " present band " allelein hybrid families.
RAPD assay
DNA was extracted from dried leaves of the 26 parents and used for RAPD assay as described by VERHAEGEN and PLOMION (1 996). These parents were genotyped by two sets of markers:
26 RAPD loci located in the two maps of E.
uroph)lla and E. grtlidis (see markers in bold typc
in figure 1 of VERHAEGEN etal. 1997), either linked
or not with putative QTLs. Amplified products were subjected to electrophoresis on 1 . 8 6 agarose gels cast in 0 . 5 ~ TBE and run in 0 . 5 ~ TBE at 4V.cm-' for 5 hours.
415 polymorphic RAPD fragments. These markers were not located in the parental maps. They were
Table 1. Factorial design with clone nomenclature. Trees follows by the same number of asterisk are half-sibs. (Numbers (1,2,3,4) report to the number of replicates of 16 trees.
Eucalyptus g r a n d ~ s E. uropl~)~lla
9-30 9-33 9-36 9-37 9-38 9-39 9-40 9-41 9-42 9-43 9-44 9-45 9-46
Table 2. Marker genotypes of the female and male parents, and expected frequency of the RAPD "present bandnallele
(+) in hybrid families originating from different parental genotype combinations. Squared cells are not distinguished with dominant markers and represent three possible classes (I, 11,111) to which the hybrid progeny can be assigned.
male parent
PHENOTYPE band present
[+I
band absent[-I
GENOTYPE+
+
+ -
- -female parent PHENOTYPE
band present
[+I
GENOTYPE
++
% + + : % + -+ -
% + + : % + - ' A + + : % + - : % - - % + - : % - - 75 % 25 %+ -
% + - : % - - band absent [-] - - 50 % 25 %used as an independant data set for validation purpose. Amplified products were loaded in 8%
acrylamide gels, and run in 0 . 5 ~ TBE at 18.5V.cm-' for 2 hours.
All the reactions were repeated twice and only reproducible bands were considered in this study. The negative films were scanned and electronic images analyzed with the BIOIMAGE imaging system (Bio Image, Ann Arbor, MI) using the Whole Band Ana- lyzer. A spreadsheet with l and 0 coding for the
presence and absence of a RAPD fragment, respec- tively, was automatically produced using the LANE MATCH" option under the MATCHING RESULTS" com- mand, and later used for analysis.
Marker-trait association
All the RAPD markers were scored by the presence or the absence of a specific amplification product in the
26 parents. The relationships between the molecular
VERHAEGEN E T A L . : LIKKAGE DISEQUlLIBRIUhl IN A FACTORI;\L DESIGN BETWEEN E. C'KOPHYLL,t A N D E. GIZANDIS data and the interspecific additive mean (IAM) in the
hybrid population (87 data points) was evaluated using one-way ANOVA, with the "present band" allele frequency classes for each marker taken as a factor. These frequencies were deduced from the RAPD genotypes of the parents (Table 2). Basically, the 87 full-sib families were grouped into either 2 or 3 fre- quency classes, depending on whether the marker was polymorphic in one or both parental species, respec- tively. It is obvious that the dominant nature of the RAPD markers led to a certain imprecision in the estimation of the "present band" allele frequency. Families belonging to class I (see Table 2) were com- posed of hybrid progenies with " present band " allele
frequency with values of 100%, 75% or 50%. Families bclonging to class I1 (see Table 2) were composed of hybrid progenies with "present band " allele frequency with values of 50% or 25%. Only families produced from homozygous null parents could be classified unambiguously as 0% (class 111 in Table 2).
All parents of the factorial design were represented but not equally. Indeed, the number of FS families and the number of F1 individuals within each FS family could vary (Table 2). In addition sample size within each genotypic class could also vary. In order to take into account this unbalanced experiment. a significance threshold for marker class-IAM association was established by using arandomization test, implemented in OPEP, as follo~vs: (i) the data were permuted by scrambling the relationship between the 87 IAM and the marker classes. This created data where the null hypothesis (no association) was true; (ii) one-way ANOVA with permuted data was performed with the marker class as a factor; (iii) these two steps were repeated 1000 times; (iv) finally we chose a threshold that would be exceeded by only 1%' of all permutations. After this selection procedure. significant RAPD markers were used in a multiple regression analysis using the Splus software (BECKER et al. 1992) in order to predict the IAM of any family within the factorial design. Basically each characteristic was treated as a dependent variable and the various RAPD markers as independent variables.
RESULTS AND DISCUSSION
QTA of "specific" value vs. QTA of "general" value
The association between RAPD polymorphisms and the IAM was evaluated at 18 months for PIL and at 18, 26 and 38 months for VIG and HDR. The 26 parents of the factorial design were genotyped with 26 markers of known location in the maps reported by VERHAEGEN et al. (1997). Of these, 13 of them were associated with a
QTL while 13 were not, as indicated in the third column of Table 3. Marker class-JAM association was investigated using one-way ANOVA. Some markers presented significant effects (based on the permutations test) of the "present band" allele frequency classes on the IAhl (Table 3).
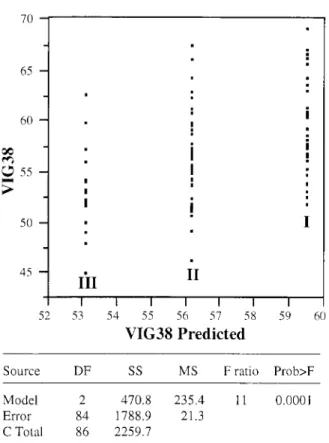
The most important point was that for markers segregating in both species. the three classes could be ordered with the mean value of the progeny belonging to either class I or class 111 being the best or the worst, and the mean value of the progeny bclonging to class I1 being intermediate. An example of such these result is given for VIG38 in Figure 1 . The fact that the three classes could be ordered, i.e. that a significant marker class-IAM could be detected from "present band" allele frequency changes, agrees with the existence of QTLs of "general combining" value.
Out of the 13 RAPD markers associated with a quantitative trait in the full-sib (FS) progeny, 4 were associated with an identical trait at an identical age in the factorial design (FD): i.e., for E. graitdis X12-633 (VIG38), L08-343 (HDR26), B01-576 and U20-1358 (PILl8). These results agree with the existence oS a linkage disequilibrium between these markers and QTL alleles in the studied hybrid population. However linkage disequilibrium was not a general rule. Indeed, 5 rnarkers were not associated nit11 any traits: i.e., for
E. gradisD03-618, N14-1588, A09-I 192. Q05-525, F04-796. Also. 2 markers were associated with the same trait but at different age: i.e., for E. ~ i ~ ~ p h y l l n 209-808, for E. grailclis Rl5-625. Other markers were associated with completely different traits: e.g. in E.
u i q ~ h ~ ~ l l a , 203-925 associatcd with VIG38 in the FS was associated with PILlX in the FD. A very intercst- ing example of association between marker allele and QTA in the population was shown by two tightly linked markers in LG 1 for E. gmnclis: L08-343 and X 12-633. These markers were associated with several QTLs (PIL18,26, HDR26,38, and VIG26,38) in the FS family (Fig. 1 of VERHAEGEN et al. 1997). However, whilst the first marker showed a strong relationship with HDR26 and no association with VIG38 in the factorial design, the second marker showed strictly opposite associa- tions, i.c, it was strongly associated with VIG38 and did not show any association with HDR26. Indeed. because of the linkage equilibrium, the physical associ- ation between favorable alleles at a marker and at a QTL could have been broken even between closely linked markers. As pointed out by STRAUSS et al. (1992), given the large effective population sizes (Ne>1000) in forest trees, linkage disequilibrium due to physical linkage (CROW & KIMURA 1970) would be expected only at recombination frequencies ( 8 ) below
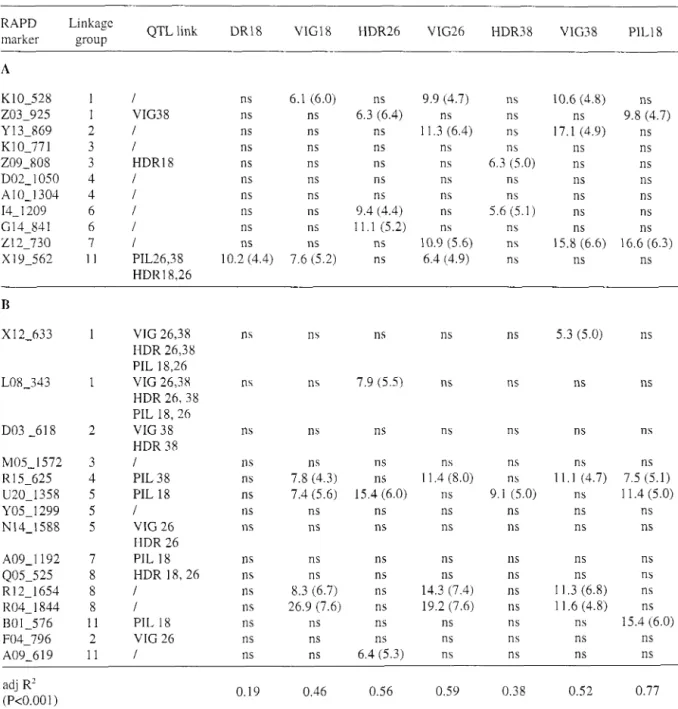
Table 3. RAPD: interspecific additive mean associations for markers located in the E. urophylla (A) and E. grandis (B)
genetic maps. Linkage group numbers refer to VERHAEGEN and PLOMION (1996). It is indicated where a RAPD marker was linked with a QTL detected in the full-sib family used by VERHAEGEN et al. (1997) (QTL link.). Shown are the values of the Fisher test and in parentheses the associated F-value of the 1% probability level determined by bootstrap as described in the Material and Method section. ns: nonsignificant. The adjusted R-squared (adj-R') were determined by multiple regression analyses carried out with all significant markers. Abbreviations are: HDR
-
height diameter ratio; VIG-
vigor and PIL-
pilodyn pin penetration depth, measured a t 18,26 and 38 months.RAPD Linkage
marker group QTL link DR18 VIGl8 HDR26 VIG26 HDR38 VIG38 PIL18
VIG 26,38 HDR 26,38 PIL 18,26 VIG 26,38 HDR 2 6 , 3 8 PIL 18, 26 VIG 38 HDR 38 1 PIL 38 PIL 18 1 VIG 26 HDR 26 PIL 18 HDR 1 8 , 2 6 1 1 PIL 18 VIG 26 1 adj R' (P<0.001)
0.025cM (0 <Ne/4, HILL & ROBERTSON 1968), which quency in the hybrid progeny (see table I), leading to is below the level of our map (VERHAEGEN & PLOMION different patterns of associations.
1996) and any published genetic map. Another possible Out of the 13 RAPD markers that were not associ- explanation could be that these two markers had ated with any trait in the FS; 4 markers did not show different allelic status in the parental species and any association with any trait in the factorial design: i.e. therefore presented different " present band" allele fre- for E. uroplzylla K10-771, A10-1304, and for E.
VERHAEGEN ETAL.: LINKAGE DISEQUILIBRIUM IN A FACTORIAL DESIGN BETWEEN E. UROPHYLLA A N D E. GRANDIS
Table 4. Same a s for Table 3 on a restricted data set.
RAPD Linkage
QTL link DR18 VIG18 HDR26 VIG26 HDR38 VIG38 PIL18 marker group VIG 26,38 HDR 26,38 PIL l8,26 VIG 26,38 HDR 2 6 , 3 8 PIL 18, 26 VIG 38 HDR 38 I PIL 38 PIL 18 I VIG 26 HDR 26 PIL 18 HDR 1 8 , 2 6 I I PIL 18 VIG 26 I adj R2 (P<0.001)
graiidis Y05-1299, M05-1572; whereas 9 presented highly significant associations with the IAM for at least one trait, e.g. for E. urophjlla K10-528 in LG1 and
Y 13-869 in LG2. Some of them presented interesting features: e.g. for E. urophjlla 114-1209 and G14-841 located at both end of LG6 (Fig.1 of VERHAEGEN et al.
1997), as well as for E. grandis R12-1654 and R04-- 1844 closely linked in LG8, presented a similar pattern of association since they were linked with the same traits (Table 3). This demonstrated again the existence of linkage disequilibrium between marker allele and
QTA in the studied population without necessarily any strong physical linkage.
Such disequilibrium was not expected for an undomesticated outbreed species like eucalyptus. The lack of linkage disequilibrium between marker loci and loci involved in the variation of a quantitative character for a non-domesticated allogamous species such as forest trees, is well documented in population genetics studies (reviewed by STRAUSS et al. 1992). The origin of the observed linkage disequilibrium in our study is
I I I I I I I I I
52 53 54 55 56 57 58 59 60
VIG38 Predicted
Source DF S S MS F ratio Prob>F Model 2 470.8 235.4 11 0.0001 Error 84 1788.9 21.3
C Total 86 2259.7
Figure 1. Analysis of variance among RAPD "present band" frequency classes ( I , 11, 111, see table 1) at marker R15-625 for VIG 38.
unknown and whether these associations would hold for the whole breeding population is still an open question that need to be tested. We can only suggest that this linkage disequilibrium may originate, in part, from a physical linkage, which means that linkage between QTA and allele at marker loci has been preserved throughout many generations.
This disequilibrium could well be a simple conse- quence of the narrow genetic base of one or both sets of parents, 3 out of the 13 mother trees being half-sibs (Table 1). We therefore perfomed the same analysis on a restricted data set (76 families) were 3 half-sib mother trees (accession 14-140, 14-137 and 14-132 in table 1) were discarded. The same significant associations were detected (Table 4) but for one case (PIL18 against RAPD marker R15-625).
Alternatively, linkage disequilibrium might origi- nate from selection on epistatic interaction (LEWONTIN 1974), or genetic drift (HILL&ROBERTSON 1968; OHTA
& KIMURA 1969) caused by the geographical origin of
both species. Indeed, the two selected populations of
Eucalqptus used for the breeding program in the Congo
originated from two particular natural areas. The E.
uroplz~dla trees were sampled from a very small area on the Fiores Island, while the E. grarldis trees were sam-
' I ' I ' I m I r I ' I
22.0 22.5 23.0 23.5 24.0 24.5 PILlX Predicted
Effect test
Source DF SS F Ratio Prob>F
ANOVA
Source DF SS MS F ratio Prob>F Model 9 16.72 1.86 29.20 0.0000 Error 77 4.90 0.06
C Total 86 21.62
Figure 2 . Multiple regression on Interspecific AdditiveMean
(IAM) using the 5 RAPD markers associated with the pilodyn pin penetration depth measured at 18 months (PIL 18). The adjusted determination coefficient of this analysis is 0.77 (P<O.00 1).
led near Atherton (Australia) in the north of the natural range.
The eucalyptus breeding program involves cross- ings between highly heterozygous individuals, where allele at marker and QTL loci are likely to be in linkage equilibrium within each species. Interspecific hybrid- ization is known to generate linkage disequilibrium (STRAUSS et al. 1992) and therefore provided opportu-
nities to detect associations between QTL and markers. Interestingly other authors dealing with interspecific crosses (European crossed by Japanese larch) have also detected stronger linkage disequilibrium than expected in intraspecific crosses (ARCADE et al. 1996).
VERHAEGEN ETAL.: LINKAGE DISEQUILIBRIUM IN A FACTORIAL DESIGN BETWEEN E. UROPHYLL4 A N D E. GRANDIS
Stability of marker class-IAM associations across ages
VIG and HDR were measured at three different ages in the factorial design. This made it possible to investigate the stability of marker class-IAM associations across ages. The results (Table 3) showed that some markers were consistently associated with a particular trait: e.g. K10-528 (LG 1, E. urophyllaj, R12-1654, R04-1844 (LG8, E. grandis) and R15-625 (LG4, E. grandis) with VIG. Other markers were significantly associated at two ages or only one, e.g. 114-1209 (E. ~~rophglla, LG6) and U20-1358 (E.grardis, LG5) for HDR26 and HDR38. Selection age of eucalyptus trees occurs at 38 months. This result shows that molecular markers might be a useful tool to reduce this time lag and therefore increase genetic gain per unit of time.
Marker-assisted selection of parental trees and hybrid families
In an advanced tree breeding program using molecular marker technology, it will be important to choose those trees that combine both favorable QTAs of "general" value and superior phenotypes. In the particular case of the reciprocal recurrent selection scheme (RRS) deve- lopped for Eucalyptus (VIGNERON 1991), selection of parental trees to be crossed within each species is based upon their additive effects, determined in factorial designs involving controlled crossings between both species.
For markers segregating in both species and there- fore presenting three frequency classes for the " present
band" allele (either absent in both parent, present in one parent and absent in the other, or else present in both parents), we observed that the cumulative number of "present band" allele in the parents was correlated either positively or negatively with the IAM. QTL detected by such analysis may be of importance for the RRS scheme. Indeed, they could help with the identifi- cation of parents containing QTAs useful for improving performances of hybrid families, in subsequent genera- tion of breeding.
Markers showing significant "present band" fre- quency classes-IAM associations were used in a multiple linear regression analysis in order to predict the performances of hybrid families (Table 3). Ad- justed R-squared were significant (P<0.001) and ranged from 0.20 to 0.77. For VIG38, a trait that is used as an early selection criteria in the breeding program, the 7 significant markers explained 52% of the IAM variation. For PIL18, the 5 significant markers accounted for 77% of the IAM variation (Fig. 2). Narrow sense heritability of this trait was 0.85 (Bouv-
ET 1995). In order to validate this approach in the prediction of IAM, an independent data set of 415 markers was used; from which we only report results for VG38 and PIL18. A total of 28 and 20 RAPD markers were significantly associated with VIG38 and PIL18 (P<0.01 determined by permutation tests), respectively. The exhaustive method of the stepwise function of the Splus software was used to find the best model for VIG38 and PIL18, including the same number of markers; i.e. 7 and 5 explanatory markers for these two traits respectively. For VIG38 and PIL18, adjusted R2 were 90% and 7470, with Cp Mallow's coefficient taking values of 8 and 6, respectively.
Both data sets demonstrated the predictive power of the multiple regression procedure. This method could be used either as an initial screening step for the identification of the best existing hybrid families or for selecting the best parental combination, and eventually for producing hybrid progeny of great value in which specific QTLs could be mapped. It follows that these QTLs could be used to detect ideotypcs that combine several favorable QTAs, which could then be vegeta- tively propagated for the production of clonal varieties (VERHAEGEN et al. 1997).
ACKNOWLEDGMENTS
This work was supported by CIRAD-For&t and INRA, for the duration of the P1i.D of DV at the INRA Station de Rechcr- chcs Forestikres dc Bordeaux-Cestas. We wish to thank J. M. Bouvct for collecting leaves in the Congo and for measuring the traits. Thanks are also due to thc comments of the refer- ees.
REFERENCES
ARCADE, A,, F A I V R E - R A M P ~ T , P., LE GUERROUE, B., PAQUES, L.E. & PRAT, D. 1996: Quantitative traits and genetic markers: analysis of a factorial mating design in larch. I n : "Somatic Cell Genetics and Molecular Genetics
of Trees". Eds MR Ahuja, W Boerjan, D Neale. Kluwer Academic Publishers, Dordrecht, The Netherlands, 211-216.
BARADAT, PH. 1989: AmClioration gCnCtique des arbres fores- tiers. ElCments mCthodologiques. INRA, Laboratoire de GCnCtique et d'amClioration des arbres forestiers. BARRIL, C . P., VERHAEGEN, D., VIGNERON, P., BOUVET, J.M.
& KREMER, A. 1997a: Stucture of the specific ability between between two species of Eucalyptus. I. RAPD data. Theor Appl Genet 947964303,
BARRIL, C . P., VERHAEGEN, D., VIGNERON, P., BOUVET, J.M.
& KREMER, A. 1997b: Stucture of the specific ability between two species of Eucalyptus. 11. A clustering approach and a multiplicative model. Tlzeol: AppI Genet. 94: 804-809.
BECKERT, R.A., CHAMBERS. J.M. & WILKS, A.R. 1992: The new S Language: a Programming Environment for Data
Analysis and Graphics. Wadsworth and Brooks; Cole Advanced Books and Software, Pacific Grove, California. BOUVET, J.-M. 1995: Evolution de la variabilitk avec 1'Bge et corrClation juvknile-adulte dans des populations d'Euca- lyptus. Thkse de 1'Institut National Agronomique Paris- Grignon, France, 236 p.
BOUVET, J.-M. & VIGNERON, P. 1995: Age trends in vari- ances and heritabilities in Eucalyptrls factorial mating designs. Silvae Genet. 44:206-216.
C ~ O W , J.F. & K I ~ ~ U R A , M. 1970: An Introduction to Popula- tion Genetics. Harper and Row, New York.
GELDERMANN, H. 1975: Investigations on inheritance of q~~antitative characters in animals by gene markers. I. Methods. Tlleot: Appl. Genet. 70:138-146.
GRATTAPAGLIA, D. & SEDEROFF, R. 1994: Genetic linkage maps of Eucalyptlls gmndis and E. ~~rophylla using a pseudo-testcross mapping strategy and RAPD markers.
Genetics 137: 1121-1 137.
GRATTAP;\GLIA, D., BERTOLUCCI, F. L. G. & SEDEROFF, R. 1995: Genetic mapping of QTLs controlling vegetative propagation in Ellcalyptus grnrtdis and E. ccropllylla using
a pseudo-testcross mapping strategy and RAPD markers.
Tlieoi: Appl. Genet. 90933-947.
HAMRICK, J. L., GODT, M . J. W. & SCHER~~AN-BRAYLES.S. T. 1992: Factors influencing levels of genetic diversity in woody plant species. Nenl Forest 6:9S-124.
HILL. W. G. &ROBERTSON, A. 1968: Linkage disequilibrium in finite populations. Tlleor: Appl. Genet. 38:226-23 1. LEONARDS-SCHIPPERS C., GIEFFERS W., SCHAFER-PREGL R.,
RITTER, E., KNAPP, S. J.. SALAMINI, F, & GEBHARDT, C. 1994: Quantitative resistance to Pl~ytoplifora inj'estar~s in potato: a case study lor QTL mapping in an allogamous plant species. Genetics 137:67-77.
LEWONTIN, R. C. 1974: The Genetic Basis of Evolutionary Change. Columbia Univ Press, New York.
MURANTY, H. 1996: Power of tests for quantitative trait loci detection using full-sib families in different schemes.
Heirdih 76:156-165.
MURANTY, H. &GOFFNET, B. 1997: Selective genotyping for location for location and estimation of the effect of a quantitative trait locus. Bio~netrics 53:629-643. O'MALLEY, D. M . 1996: Complex trait dissection in forest
trees using molecular markers. hi: The impact of plant molecular genetics (BWS Sobral Ed). Birkhauser, Bos- ton, USA, p 49-70.
OHTA T. & KIMURA M. 1969 Linkage disequilibrium due to random genetic drift. Genet. Res. 13:47-55.
PLOMION, C. & DUREL, C.-E. 1996: Estimation of the average effects of specific alleles detected by the pseudo-testcross QTL mapping strategy. Genet. Sel. Evol. 28:223-235. STRAUSS, S. H., LANDE, R. & NAMKOONG, G. 19%: Limita-
tions of molecular-marker-aided selection in forest tree breeding. Can. J. For: Res. 22: 1050-106 1.
VERHAEGEN. D. & PLOMION, C. 1996: Genetic mapping in
Eucalyptlls urophylla and E. gmtzdis using RAPD
markers. G m o r m 39: 105 I-1061.
VERHAEGEN, D., PLOMION, C., GION, J. M., POITEL, M., COSTA. P. & KREMER, A. 1997: Quantitative trait dissec- tion analysis in Eucal~pr~ts using RAPD markers: 1 -
Detection of QTLs in an interspecific hybrid progeny, stability oSQTL expression across different ages. Theor
Appl. Genet. 95597-608.
VIGNERON: P. 199 1 : CrCation et amklioration de variCtCs d'hybrides d'Elrcalypt~ls au Congo. In: Proc IUFRO Symp "Intensive Forestry: the role of Eucalyptus" Durban, South Africa, p. 345-360.
WILLIAMS, J. G. K., KUBELIK, A. R., LIVAK, K. J. & RAFALSKI, J. A. 1990: DNA polymorphisms amplified by arbitrary primcrs are useful as genetic markers. NLIC. Ac. Res.
18:6531-6535.