The 8th International Renewable Energy Congress (IREC 2017)
Electrical design of a Photovoltaic Panel Incorporated
in an Algerian-Three Phase Grid
Mohamed REZKI
Department of electrical engineering Faculty of sciences and applied sciences, BOUIRA
University,Bouira, ALGERIA m.rezki@univ-bouira.dz
Abstract-This paper aims to investigate problem of the
integration of a photovoltaic site been submitted under local weather conditions, located at Bouira city (Algeria) in a three-phase grid. In fact, Algeria has great assets to embark on the exploration of photovoltaic energy whether by its solar potential or by its large area. The study of photovoltaic systems with their integration into conventional electrical networks is still useful, which gives importance to this research. For this the photovoltaic system with MPPT control was simulated, the selected MPPT algorithm is based on the principle of disturb end observe (P&O). This is followed by a simulation of our photovoltaic system connected to a three-phase network.
Keywords-Solar Energy; Photo voltaic Cell; MPPT; Integration; Three-Phase Grid.
1. INTRODUCTION
After the anarchic exploitation of fossil fuels (non-renewable) with the environmental degradation that follows, human was forced again to turn back to clean and ahnost inexhaustible renewable energy. As a renewable energy, Photovoltaic energy (PY) is constantly expanding [1]. Photovoltaic (PV) covers the conversIOn of light into electricity using semiconducting materials that exhibit the photovoltaic effect (Fig. 1 ). A typical photovoltaic system employs solar panels, each comprising a number of solar cells, which generate electrical power [2].The use of PY energy is very useful in isolated areas where the extension of the conventional electricity grid is very delicate that is why the modelling and simulation of photovoltaic systems connected to single-phase network and more classical three-phase connection is important [1].
There are several methods to obtain the maximum power of the photovoltaic generator [3, 4]. The most famous ones are: perturbation and observation (P &0) [5], incremental conductance [6], short circuit method [7], of the open circuit voltage [8] and the feedback methods of power [9]. During the day, the solar density is variable; most of these algorithms fail to track the maximum power point regularly. For this reason, the methods based on "artificial intelligence" are used. Among which the authors [10, 11] have suggested MPPT algorithm based on artificial neural networks. The author [12] suggested genetic algorithms, and [9, 11] have used fuzzy logic to obtain
978-1-5090-6751-0/17/$31.00 ©2017 IEEE
Issam GRICHE
Department of electrical engineering Faculty of sciences and applied sciences, BOUIRA
University,Bouira, ALGERIA i.griche@univ-bouira.dz
the optimum power point. The extracted power using the photo voltaic generator is transferred to the inverter through the intermediation of a dc bus.
In the second section we presented the mathematical models of the PV array and boost converter. In section 3 we presented the used method of MPPT control. The 4th section presented the proposed system. Finally in Section 5, the simulation and discussion ofthe results are presented.
IT. THEORITICAL BACKGROUND
There are several mathematical models that illustrate the PY generator, the most used and simplified one is the single diode model (Fig.2).
antiref lect i,v e
coating
~~9ht>
fron t
e-?;
... I
contac t e -loadFig. I. Principle of the photoYoltaic effect creating PV generator [13]. Jpv
Fig. 2. The single diode model for solar cells [14].
Where: Rser , Rshu are the lumped series resistance and lumped shunt resistance consecutively.
lph is the photo current.
This mathematical model of the PV cell (lpv(V pv) characteristic) can be explained by the following equation:
I
=
I _ I [x Ee(Vpv+
(Ipv XRser»)_I] Vpv +(lpv X R,er) (I)pv ph sat e p nkT R
shu
With: 1m! (A) saturation current of the junction, e the elementary charge (ev), k Botzman's constant, n ideality factor of the junction, T: junction temperature of the panels COK) and R ser, Rshu (Q)resistors (series and shunt).
A. Characteristics of a PV cell
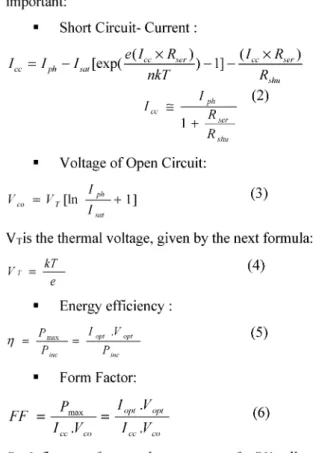
There are numerous characteristics; one will cite the most important:
•
Short Circuit- Current:I
= I -I
[x (e(IccXRser»_I]_ (lcc X Rser) cc ph satep nkT Rshu f ph (2) 1 + R.,er Rshu•
Voltage of Open Circuit: fVm = V1[ln ~+ I] I Wli
(3) VTis the thermal voltage, given by the next formula:
V T =
!:!...-e • Energy efficiency: 77 P owx I 01'1.v
01'1 Pin, Pin, • Form Factor:FF
~ 10pl·Vopllee .Veo lee .Veo
(4)
(5)
(6)
B. Influence of external parameters of a PV cell 1) Current and/or Power -Voltage:
By setting up the standard conditions (temperature at 25°celcius and illumination at 1000 watts/m2) and varying only the voltage, we obtain the following figures:
I-V Curve 4.5 1--- -- - -- -- -- - -- - -- -- -- --~ -_ -_- _- _ I ___________ L ____ _ I 3.5 ___________ L ____ _ I ___________ L _____ ~ ____ _ I I ___________ L _____ ~ ____ _ I I ~ 2.5 ___________ L _____ ~ _____ _ I I 1.5 ___________ L _____ ~ _____ _ ___________ L _____ ~ _____ _ 0.5 ___________ L _____ ~ ______ _ °0L----,~0---i20~--~30~---4~0~-~50 (V)
Fig. 3. Current versus voltage (rcV) curve).
P-V Curve 2 0 0 , - - - - , - - - , - - - - , - - - - , - - - - . 180 1W ---r---T---T---~---1~ - - - r - - - T - - - -120 ~ 100 - - - j- - - + + -00 - - - j - - - + - - - + - - - 4 60 ~ j---+---~---~-20 - ___ L _____ L _____ L _____ ~_ °0L----,LO---i20~--~30~---4LO~-~50 (V)
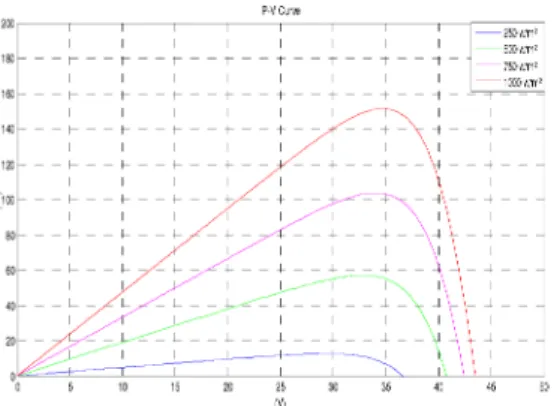
Fig. 4. Power versus voltage (P(V) curve). 2) lllumination:
This parameter gives the intensity of the sunshine by unit of square meter (unit is W/m2). The influence of illumination IS shown in the next figures (Fig.5 and Fig.6).
I-V Curve
0.5 ~~~ ~
P·VCllve j I I I I I I I ®~~~r~~r~~r~~r~~T~~T~~~~~~~ j I I I I I I I ~~~~r~~r~~r~~~~~~~~~~~~~~~~~ j I I I I I I o 20 45 50J
Fig. 6. Effect of illumination on the power-voltage characteristic. 3) Temperature:
The temperature can alter the panel.
operation of the photovoltaic
I·VCllV8 4.5 1 -~. ~~~~~~~~~~~~~~~~ 1.5 - - - t t -- 1OO 'c I
Fig. 7. Effect oftemperature on the current-voltage characteristic.
P·VCllV8 ~ ~~r~~r~~r~~r~~~ rn ~~r~~r~~r~~~~~ ~1CO I 10 15 I ~ I I 25 I ~ 1 1 -I 45
Fig. 8. Eflect oftemperature on the power-voltage characteristic.
Ill. DESCRIPTION OF THE WHOLE SYSTEM
The whole system that we desire study is shown in Fig.9.
Solar panel
· · · ·
.
~
.
t •
.j
controller ~Fig. 9. Central design ofPV system connected to the grid [15].
As it's seen in the Fig.9 the total structure is composed of the solar panel (PV generator), followed by the DC-DC converter in order to track the maximum power and control the battery unit. Finally a DC-AC converter is used for getting alternative current necessary to be connected to the three-phase grid. The battery unit the battery is used to ensure energy at nights and cloudy days. For our study, we have omitted it.
A. DC-DC converter
As we have seen, the power delivered by the photovoltaic panel is a function of irradiation and temperature. The important thing is to control this power in order to have a certain optimum value. For this purpose, a converter controlled by a controller is used according to a control algorithm called MPPT (Maximum Power Point Tracking). The principle of the function of tracking is exposed on the following figure (Fig.IO):
CUlTellt (A) 1/R op~
ISC (A) 1>-"'A'--_ _ _ _ _ _ _ _ ..::S'--__ P8
lopt
Fig. 10. A Buck-Boost converter basic circuit.
As we see, the preferred region for getting an optimal operation is the region between B and C.
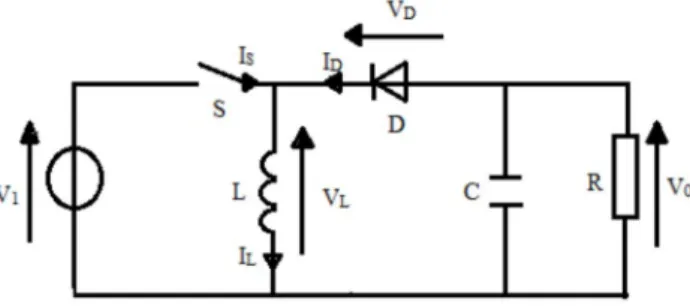
The common used circuit for this converter is called Buck-Boost (Fig. I I ). Its basic diagram is as follow:
VD
c
Fig. 11. A Buck-Boost converter basic circuit.
The controller with MPPT is applied on S gate. The load (output of circuit) for us is represented in Fig.lO by a resistor
R.
The most employed methods ass MPPT controllers are regrouped in the Fig.12.
Ambient temperature Variable temperature Standard Illumination Power Algorithm : Increment Conducta nce(INC) Methods Perturb &Observe (P&O)
Algorithm based on the Measnring a Fraction
of vo ltage Vco and Cn rrent Icc
Fig. 12. The MPPT algorithms for controlling the DC-DC converter.
The algorithm that we have chosen is the P&O algorithm (perturbs and observe).
IV. SIMULATION RESULTS AND DISCUSSION A. Simulation ofMPPTwith (P&O)
The proposal PV system is consecrated to an isolated site (not connected to the grid). We get directly at the output a DC current that we can transform in an AC current for the alternative loads. The scheme of this system is exposed as follows (Fig. 13):
Input Voltage Vi Ouq,ut Voltage Vo
Gain
OulputCurrentlo Dutycyde
Fig. 13. The PV installation with the P&O MPPT's algorithm.
The following figures have been taken with the standard conditions (standard illumination 0=IOOOW/m2 and ambient
temperature T=25°C): XYPlot 5r---~---~---~ 4 1--_________ _ '" 3 >- 2 O L---~---~---~ o 10 20 30 X Axis
Fig. 14. I(V) curve -Scope2-.
XYPlot 100 80 Ul 60 ~ >- 40 20 0 0 10 20 30 X Axis Fig. 15. P(V) curve -Scope2-.
By varying the temperature and illumination taking into consideration the local weather conditions of Bouira (city in the north of Algeria), we get these curves:
15 > 10
~W/MW,wNlMw.wmm"'.WIM"w.WM''''''';.''''''''w.",,,,,,w.,,,,,,,,w.''''''''w."""-1
glO 5 o~--~--~----~--~--~----~--~----~--~--~ "00 . 00 10m 50[1] 60CD JOOJ 81)]) "0 Time (ms)!~t
0 : : : : : : :1
"00 ~OO 31)]) 'OOJ 5000 SOOJ JOOJ 81)]) ~OO "0
Time (ms)
U
'00 Illl 300 100 9JJ OOJ 100 OOJ OOJ 100 Time (ms)
Fig. 16. Output characteristics (Current-Voltage, Power-Voltage and the Duty Cycle) -Scope2-.
As a fIrst deduction we can ascertain that the proposal circuit seems good and do the tracking's function well.
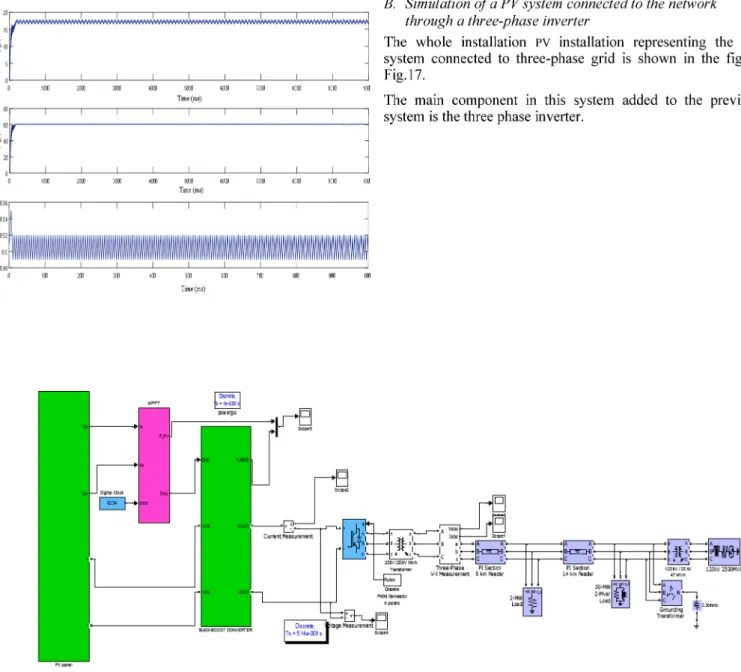
B. Simulation of a PV system connected to the network through a three-phase inverter
The whole installation PV installation representing the PV
system connected to three-phase grid is shown in the fIgure Fig.17.
The main component in this system added to the previous system is the three phase inverter.
Fig. 17. The PV installation connected to three-phase grid (complete scheme).
Curf c nt(AJ
The results are represented as follows:
(a) Vo l'~g e (V) ·~o~---~---~---~~---~---~ Time(s) x ' O~ (b) Current (AI
:~0, A
...
7\\f
' MI! t
.f.
-- -- ---_ ...._---~\IHIIH+lf.HI-HlCftHi+H
··· ·IT
VI
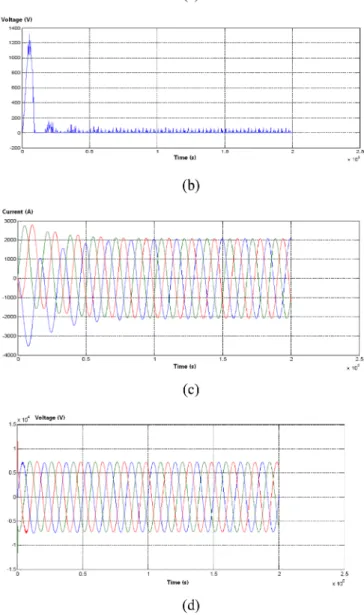
~o~---~~---~---~---~---~ Time (S1 (c) x 10' Vo llilge IV) 1.5;-::----'----,---,---,---, ---, -1 .50~---+---"---__,L,---_!_---~ Time(s) (d) x 1O~Fig. 18. Simulation results ofa PV system connected to the network through a three-phase inverter where (a): Input current on Inverter, (b): Input
Voltage oflnverter, (c):Output Current oflnverter, (d): Output Voltage of Inverter.
From the Fifg,18 we can see that the charging current is carried completely by the network. Input voltage is less undulating.
The figures (c) and (d) illustrate the curves of the inverter output quantities, the outputs current and voltage are perfectly sinusoidal and therefore can be integrated into the three-phase network easily.
V. CONCLUSION
The effect of integrating the photovoltaic panel into a three-phase network was simulated. This integration was made
following the introduction of another stage after Boost, that of the inverter (three-phase). We have seen that the three-phase network effect overcomes the effect ofthe PV generator. In this article we did not seek the effect of the network's stabilization (effect of the disturbances), we just looked for the connection to the network how to be done and how to model all that. And we feel that the task was made.
REFERENCES
[1] M. Rezki, A Belaidi, and M. Ayad, "Technical study of a Photovoltaic site in Bouira-Algeria ", Proceedings of International Conference on Renewable Energy (INCORE 2016), p. 129-551, February 2016. [2] Solar Cells - Chemistry Encyclopedia - structure, metal, equation, The
pn Junction. Chemistryexplained.com. Retrieved on 17-01-2017. [3] T. Esram, JW.Kimball, PT Krein, P.L. Chapman, P. Midya, Dynamic
maximum power point tracking of photovoltaic arrays using ripple correlation control, IEEE Trans Power Electron, 21, pp. 1282-1291 (2006).
[4] R. Ramaprabha, M. Balaji, B.L. Mathur, Maximum power point tracking of partially shaded solar PV system using modified Fibonacci search method with fuzzy controller, Electrical Power and Energy Systems, 2012, pp. 754-765.
[5] Bouzelata Yahia, Djeghloud Hind, Chenni Rachid, The Application of an Active Power Filter on a Photovoltaic Power Generation System, International Journal of Renewable Energy Research, 2 (2012). [6] Hanen Abbes, Hafedh Abid, Kais Loukil, An Improved MPPT
Incremental Conductance Algorithm Using T-S Fuzzy System for Photovoltaic Panel, International journal of renewable energy research,S (2015).
[7] Noguchi T., Togashi S., Nakamoto R., Short-current pulse-based maximum power- point tracking method for multiple photovoltaic and converter module system, IEEE Trans. Ind. Electron., 49, pp. 217-223 (2002).
[8] Dorofte C, Borup n, Blaabjerg F., A combined two- method MPPT control scheme for grid connected photovoltaic systems, Proc. Eur. Conf Power. Electron., 2005, pp. 1-10.
[9] S. Lalouni, D. Rekioua, 1. Rekiou, E. Matagne, Fuzzy logic control of stand-alone photovoltaic system with battery storage, Journal of Power Sources, 193, pp. 899-907 (2009).
[10] S. Boukhalfa, F. Bouchafaa, 1. Aounallah, Optimisation of a GPV by an Artificial Intelligence Technical, International Journal of Renewable Energy Research, 2 (2012).
[II] Ahmet Af9in Kulaksiz, Ramazan Akkaya, A genetic algorithm optimized ANN-based MPPT algorithm for astand-alone PV system with induction motor drive, Solar Energy, 86, 2012, pp. 2366-2375. [12] M.N. Amrani, A Dib, Study of Maximum Power Point Tracking
(MPPT) Method Based on Fuzzy Controller, International Conference on Electrical Engineering and Automatic Control, 2013
[13] Website: https:llwww.britannica.com/science/photoelectric-effect retrieved on 17-01-2017.
[14] D. S. H. Chan, 1. R. Phillips and 1. C H. Phang, "A comparative study of extraction methodsfor solar cell model parameters", Solid-State Electronics Vol. 29, NO.3. pp. 329-337, 1986.
[15] M. Kesraoui, A Lazizi, and A Chaib, "Grid connected solar PV system: modeling, simulation and experimental tests,"Energy ProcediavoL 95, pp. 181-188,2016.
![Fig. I. Principle of the photoYoltaic effect creating PV generator [13].](https://thumb-eu.123doks.com/thumbv2/123doknet/13829705.443200/1.892.537.785.618.793/fig-i-principle-photoyoltaic-effect-creating-pv-generator.webp)