HAL Id: hal-02621643
https://hal.inrae.fr/hal-02621643
Submitted on 26 May 2020
HAL is a multi-disciplinary open access archive for the deposit and dissemination of sci-entific research documents, whether they are pub-lished or not. The documents may come from teaching and research institutions in France or abroad, or from public or private research centers.
L’archive ouverte pluridisciplinaire HAL, est destinée au dépôt et à la diffusion de documents scientifiques de niveau recherche, publiés ou non, émanant des établissements d’enseignement et de recherche français ou étrangers, des laboratoires publics ou privés.
Arthropods life cycle and temperature: beyond
isomorphy hypothesis
Olivier Bonato, Joel Chadoeuf
To cite this version:
Olivier Bonato, Joel Chadoeuf. Arthropods life cycle and temperature: beyond isomorphy hypoth-esis. Journal of Thermal Biology, Elsevier, 2018, 75, pp.1-6. �10.1016/j.jtherbio.2018.05.004�. �hal-02621643�
Version postprint
Author’s Accepted Manuscript
Arthropods life cycle and temperature: beyond
isomorphy hypothesis
Olivier Bonato, Joel Chadoeuf
PII:
S0306-4565(18)30115-3
DOI:
https://doi.org/10.1016/j.jtherbio.2018.05.004
Reference:
TB2111
To appear in:
Journal of Thermal Biology
Received date: 20 March 2018
Revised date:
27 April 2018
Accepted date: 11 May 2018
Cite this article as: Olivier Bonato and Joel Chadoeuf, Arthropods life cycle and
temperature: beyond isomorphy hypothesis,
Journal of Thermal Biology,
https://doi.org/10.1016/j.jtherbio.2018.05.004
This is a PDF file of an unedited manuscript that has been accepted for
publication. As a service to our customers we are providing this early version of
the manuscript. The manuscript will undergo copyediting, typesetting, and
review of the resulting galley proof before it is published in its final citable form.
Please note that during the production process errors may be discovered which
could affect the content, and all legal disclaimers that apply to the journal pertain.
Version postprint
Arthropods life cycle and temperature: beyond isomorphy hypothesis
Olivier Bonato1, Joel Chadoeuf 2
1 IRD, Cirad,Univ. Montpellier, UMR IPME 911 Avenue Agroplis, 34394 Montpellier,France.
2 INRA, Statistics, UR 1052, 67 allée des chênes, cs 60094, 84143 Montfavet cedex.
Version postprint
ABSTRACT
In poikilotherms, developmental time and adult lifespan are biological traits driven by temperature although their underlying physiological mechanisms differ. The
developmental theory of ageing predicts a positive correlation between these two traits without confirming a genetic or causal relationship. The developmental rate isomorphy hypothesis established that the proportionality in the duration of each pre-imaginal stage with respect to total developmental time does not vary with temperature. This may have important evolutionary implications. We conducted an analysis with arthropods of agronomic interest to study if the hypothesis could be extended to the total lifespan of poikilotherms, including adult lifespan. We showed that isomorphy could be acceptable for a global description of this relationship. However a general model of power law type is more appropriate for characterizing the relationship
between developmental time and adult lifespan. In this model, the shape of the curve is a constant characteristic, but the parameters that control it depend on the functional type of the arthropod (phytophagous, predator or parasitoid). Presumably this power law could be extended to all arthropods of agricultural interest, and more generally to all arthropod.
Keywords Ageing, Developmental constraints, life-history traits, thermal requirements, power law
Version postprint
1. Introduction
Ectotherms are directly affected by environmental temperature conditions because they do not regulate their body temperature, which consequently is very close to the
atmospheric temperature (May 1979). Ambient temperature is one of the
environmental factors that strongly influences the fitness of ectotherms in particular through its direct effect on developmental rate (Gillooly et al. 2002). Jarosik et al. (2002) established a general rule regarding the dependence on temperature of the
developmental rate of poikilotherms. According to this hypothesis, called developmental rate isomorphy, within the temperature range for which the relationship between
developmental rate and temperature is linear, the proportionality in the duration of each stage with respect to total developmental time does not vary with temperature. This was shown for 426 non-diapausing populations of 342 insect species (n= 417) and of 7 mite species (n=9) (Jarosik et al. 2002) and was later extended to 22 other
representative groups of animals, including vertebrates (Jarosik et al. 2004). This invariance in proportionality when the temperature changes implies the existence of a lower thermal threshold common to all developmental stages (Jarosik et al. 2002). The existence of this common thermal threshold physiologically links all pre-imaginal stages between them. Indeed, adaptation of a particular stage to the temperature of its
environment can not be realized independently of the other stages of development. In other words, a particular stage can not adapt to the temperature of its environment without affecting the thermal adaptation of all the other stages of development. (Jarosik et al. 2002).
Version postprint
Development is not the only trait driven by temperature; all functional life-history traits involving physiological processes are affected. Adult Lifespan is one of these. Although the physiological mechanisms of aging are different from those involved in development, both are strongly temperature dependent. The temperature responses of developmental and adult lifespan rates are unimodal and asymmetric (left-skewed): they increase gradually from a lower temperature threshold to an optimum temperature and then rapidly decrease to the upper temperature threshold. According to the developmental theory of ageing (Lints 1978,1988; Lints and Lints 1969) a link between development and ageing exists, as shown by the positive correlation between developmental time and adult lifespan (Lints and Lints 1969; Muller 1963). Although, experimental work seems to confirm the genetic relationship between development and lifespan (Lints 1978), this relation is not necessarily a causal one (Zwaan et al. 1991). Development is a continuous process in which senescence forms the last stage (Muller 1963), and the lifespan of an organism could be lengthened as a whole by stretching the development programme in the immature stages (Comfort 1968).
Given that developmental time and adult lifespan exhibit the same response to
temperature, could isomorphy, i.e. the general rule developed by Jarosik et al. (2002) for pre-adult development, be extended to the total lifespan of ectotherms? Thus, is there a common lower thermal threshold at all stages, including the adult stage? Grouping together lifespan and developmental time in an analysis raises another important question about proportionality. It is well known that arthropods invest more in the juvenile phase or in the adult phase depending on their lifestyle as phytophagous, predator or parasitoid (Nylin and Gottard 1998, Boggs 2009). What impact the lifestyle could therefore have on the proportionality between development time and lifespan, knowing that under the assumption of isomorphism this relationship is considered to be
Version postprint
invariant? To answer this question, we conducted an analysis using the same test as carried out by Jarosik, with arthropods of agronomic interest belonging to different functional types (phytophagous, predator or parasitoid). This group is well studied in terms of number of species, experiments carried out and geographic locations. Further, we tested whether the isomorphy hypothesis’ understanding of the proportional relationship between development time and lifespan was true and proposed a power law type for characterizing this relationship. More precisely we considered a power law model for which the functional groups are fixed factors, and the species (inside groups) are random factors. With this model, a reduced number of parameters is enough for estimating the functional group effect and for summarizing the random species effect with a good statistical power.
2. Materials and methods
2.1. Materials
The data used in this study were compiled from the available literature on arthropods (mites or insects) of agronomic importance. In order to reduce experimental bias, only studies for which development and adult lifespan have been characterized in the same experiment and at least for 3 different temperatures, were selected. The final data used in the analysis concerned 72 species belonging to 20 families, of which 44 were pest (10 mites and 34 insects), and 28 were natural enemies (17 predators and 12 parasitoids) (Table 1). After a graphical inspection, only data falling within the range of the linear relationship between the rate of population increase and temperature were used.
Version postprint
2.2. Methods
2.2.1. Rate isomorphy (Jarosik’s approach)
In this first analysis, the existence of isomorphism between pre-imaginal development time and adult lifespan was tested following the method used by Jarosik, Honek and Dixon (2002). For this, Z , the angular transformation of the proportion of time spent in the pre-imaginal period (D) with respect to the total lifespan (pre-imaginal (D) + adult lifespan (L)) was analysed as the dependent variable with rearing temperature (T) as the independent variable, i.e., Z . Under the isomorphy hypothesis, Z does not depend on temperature (T). Thus the regression slope (b) should not significantly differ from zero. Conversely, significant deviation (p<.0.05) from the zero slope of the regression line violates the isomorphy hypothesis. To test for variation among species at the same time, we performed ANCOVA additionally entering arthropod species (i), ( ) . Nested sub-models including arthropod family or functional type (phytophagous, predator or parasitoid) were additionally tested against the general model using a Fisher-Snedecor F test.
2.2.2. Power law (beyond Jarosik’s approach).
In a second analysis, we examined the relationship between adult lifespan and
developmental time in a more general context than a strict proportionality. For this, a linear regression between Log(lifespan) and Log(developmental time) was performed.
Version postprint
Following the hypothesis of Jarosik et al. (2002), if the proportion of time spent
developing is independent of temperature (T), then ( ) ( ) ( ) , and the lifespan (L) is equal to ( ) ( ) ( )). Thus, L(T) should be proportional to developmental time (D(T)). For each species and each temperature, adult lifespan was plotted against pre-imaginal developmental time.
(1)
which, after a log transformation, results in the following ANCOVA model:
( ) ( ) ( ) (2)
Note that under the isomorphy hypothesis, b= 1 and ( )
As in the rate isomorphy test above, we additionally entered functional type, family or species. Therefore covariance analysis was performed to test whether the slopes (bi) for various groups differ from 1, as assumed by the isomorphy hypothesis of Jarosik et al. (2002) and/or from each other.
2.2.3. Modelling functional group effects
In a third analysis, a linear mixed model was used to describe the relationship between lifespan and development which gives:
Version postprint
where Di,n (respectively Li,n) is the development time (respectively lifespan) of arthropod species i belonging to type n, both at the same temperature, an and bn are constants depending on the functional type, αi and βi are random effects linked to the species of variance and and ε is a residual random effect of variance .
3. Results
3.2 Rate isomorphy
For the 72 arthropod species tested, the proportional relationship between the total pre-adult developmental time and the temperature is shown in Figure 1. The data points are evenly spread around the mean curve and no general trend can be observed.
However, grouping the points by functional type (phytophagous, predator or parasitoid) suggests that at least a type effect exists. The Fisher-Snedecor F test showed a significant effect among arthropods (species level: F=13.19, df1=142, df2=197, p-value<10-7;
Functional type level: F=7.86, df1=138, df2=197, p-value<10-7; Family level: F=5.54, df1=116, df2=197, p-value<10-7). The statistical tests also rejected the assumption of a common intercept or slope for the model as they showed an effect at the type level (Common slope: F=1.80, df1=71, df2=197, p-value=0.008; Common intercept: F=2.25, df1=71, df2=197, p-value=6.10-5). For each species, the p-values of the test assuming a value of the slope equal to zero vary between 0.0028 and 0.9758, but most are higher than 0.05; only 11 out of 72 are lower than 0.05. A Bonferroni correction was used to take into account that the 72 tests were performed simultaneously. They showed no significant differences. Thus, although the isomorphy hypothesis was rejected overall,
Version postprint
this was due to the low number of species showing a low p-value, leading to non-significance after Bonferroni correction.
3.2. Power law
Figure 2 shows the relationship between the two variables L(T) and D(T), for each functional type (phytophagous, predator or parasitoid) after logarithmic transformation. The dispersion of points observed in Figure 2 suggests that using a linear relationship between the logarithms of development time and lifespan is the most appropriate. Note that in this case the isomorphy hypothesis corresponds to a regression coefficient equal to one. As in the above analysis (isomorphy test), among the levels at which data can be grouped, the species level is more significant than the family and the type levels (species level: F=12.16, df1=142, df2=197, p-value<10-7; Functional type level: F=7.30, df1=138, df2=197, p-value<10-7; Family level: F=5.15, df1=116, df2=197, p-value<10-7). The statistical tests of a common intercept or slope for the model including an effect at the arthropod level are also rejected (Common slope: F=1.76, df1=71, df2=197,
p-value=0.0012; Common intercept: F=2.66, df1=71, df2=197, p-value=4.10-8). Only 13 intercept p-values (respectively 12 slope p-values) of the test of a common intercept (respectively common slope equals to one) out of 72 were lower than 0.05. The Bonferroni correction showed that no slope was statistically different from 1 and that only two intercepts (out of the 72) were significantly different than the common intercept.
Version postprint
Only one species displayed an intercept and slope value largely different from the others. If this species is not considered, the slope distribution is unimodal with a mode value closed to 0.8, whereas the intercept distribution showed three modes that might correspond to the regression slope built from each of the three functional types.
3.3. Modelling functional group effects
When the different functional types are taken into account, the sum of squares decreases strongly, even if the species level remains significant. Thus, we put forward the mixed model above (eq. 3).
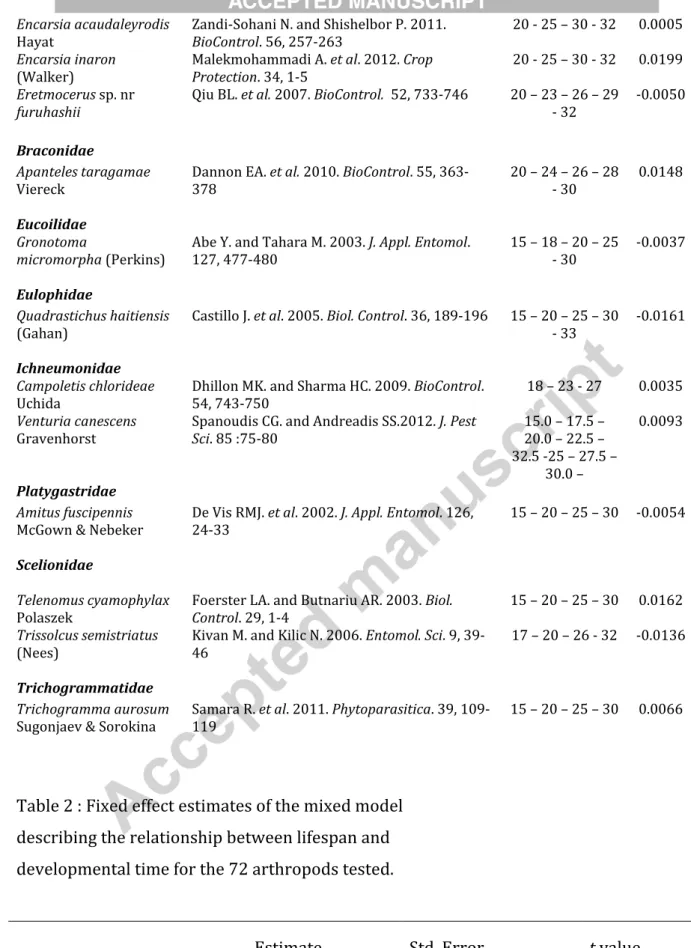
The estimates of the fixed effects ( and ) are presented in Table 2. The fixed effects between phytophagous and predators were not significantly different, so they were grouped together for further analysis against parasitoids. No significant difference was found between parasitoids and the group (phytophagous + predators) (Khi2=5.78, df=2). The random effect due to species was very low at the slope level ( ), but
relatively high at the intercept level ( ). The residual variability was also very low ( =0.075).
Thus, a common power-law shape can describe the relationship between the
developmental times of all species tested. The exact shape of this power law is common to phytophagous and predator. The species effect observed at the intercept level is no longer present in the regression coefficient, thus almost no species effect on the power coefficient is observed when considering the parasitoids.
Version postprint
4. Discussion
After analysing the data using the same procedure and tools as Jarosik et al. (2002), the isomorphy hypothesis can be seen as a good approximation as our results were similar to those of Jarosik et al. (2002) and Jarosik et al., (2004), with very few species showing a significant slope. However, the Jarosik’s approach uses the arcsine transformation that was originally defined for proportions based on counts rather than continuous variables. A further analysis showed that the relationship is more complex than that predicted by Jarosik’s model: the proportionality between pre-adult development and adult lifespan had to be replaced by a general power relationship that, nevertheless, remains quite close to the proportionality in the range of temperatures studied. While this relationship held true for all arthropods we tested, the parameters of the model change according to the functional type of the species: phytophagous, predator or parasitoid. For a given total lifespan at a given temperature, we observed that adult lifespan is often longer than pre-imaginal developmental time for predators and phytophagous. The opposite was observed for parasitoids, for which, at a given temperature, pre-adult
developmental time was always greater than adult lifespan. For each functional type, the slopes of the model vary; the slopes for phytophagous and predators are not
significantly different, reflecting a common response with a varying “species”
coefficients, but the slopes for parasitoids are different from the others (predators and phytophagous). However, the intercepts are significantly different among the groups.
Why do parasitoids invest more in development than lifespan as compared to
predators?. Part of the answer may lie in metabolism and energetic needs. Insects’ body fat is central to energy storage and utilization (Carnovoso et al. 2001). It is mainly
Version postprint
composed of lipids, which are the main source of metabolic fuel, essential for growth and reproduction (Arrese and Soulages 2010). The majority of adult parasitoid species are unable to synthesize lipids. The loss of lipogenesis is an evolutionary consequence of a parasitoid lifestyle. Parasitism facilitates the redundancy of traits involved in lipid production (Visser et al. 2010). Some parasitoids show lipogenic ability, but these are all host species generalists. Having a large range of host species may impede effective host manipulation in which the host is forced to synthetize lipids for the benefit of the parasitoid (Visser et al. 2010). Giron and Casas (2003) report that all parasitoid species for which lipogenesis has been investigated are unable to synthesize lipids from sugars in significant amounts, although these species are able to cover all their functional energetic needs. These authors showed that a parasitoid female invests more in the production of eggs than what she obtains from food and must therefore draw
continuously on her reserves. Yet, these reserves are set at adult emergence and do not increase due to the high demand of maintenance and the inability to ensure lipogenesis. Parasitoids are holometabolous insects, so the storage of body fat, especially lipids, is essential to their survival. Reserves carried over from the larval stage are also crucial for oogenesis (Arrese and Soulages 2010). Over a lifespan of duration equal to that of
predators or phytophagous, a higher investment in pre-adult developmental time rather than adult lifespan would therefore be justified in parasitoids because fat reserves are accumulated during this period.
In contrast, predators can maximize their energetic gains by increasing the number of prey or selecting more nutritious prey (Visser et al. 2010). Predators are not dependent on their immature phase to increase their fat reserves and, more importantly, predation is much more effective when performed by adults (Dostalkova et al. 2002). This may
Version postprint
explain why for a given lifespan, the period corresponding to lifespan in predators is always longer than that of pre-imaginal development. Following Jafferty and Kunis (2002), phytophagous could be defined as micro-predators of plants, thus it is not surprising that their accumulation of fat reserves is also more efficient during the adult phase. As observed in predators, for a given lifetime, the proportion relative to adult lifespan of phytophagous is greater than that relative to pre-imaginal development.
We show here for arthropods of economic importance that the proportional relationship between lifespan and development period can be formalized mathematically. The
resulting slope is an average group characteristic, but the parameters depend on the functional type of the arthropod (phytophagous, predator or parasitoid). If we consider the type as a random effect, then the mathematical relationship can be expressed as Lifespan= ( Developmental time /( Developmental time + Lifespan )*Developmental time0.78. Note that the existence of a common lower thermal threshold for all stages of development of a given insect species (Jarosik et al. 2002) remains valid when switching from the linear relationship to a power law. Presumably this power law could be
extended to all arthropods of agricultural interest, and more generally to all arthropods. Further studies on a larger number of poikilothermic species are needed to explore the potential universality of this law.
Acknowledgements
This manuscript was much improved by the comments and the suggestions of W. Blanckenhorn.
Version postprint
Arrese, E.L., Soulages J.L., 2010. Insect fat body: Energy, metabolism and regulation. - Ann. Rev. Entomol. 55, 207-225.
Boggs, C.L., 2009. Understanding insect life histories and senescence through a resource allocation lens. Funct. Ecol. 23, 27-37
Carnovoso, L.E., Jouni, Z.E., Karnas, K.J., Pennington, J.E., Wells, M.A.,2001. Fat metabolism in insects. Ann. Rev. Nutri. 21,23-46.
Comfort, A., 1968. Feasibility in age research. Nature 217, 320-322
Dostalkova, I., Kindlmann. P., Dixon, A.F. 2002. Are classical predator-prey models relevant to the real world? J. Theor. Biol. 218, 323-330.
Gillooly, J.F., Charnov, E.L., Wess, G.B., Van Savage, M., Brown, H.J., 2002. Effects of size and temperature on developmental time. Nature 417, 70-73.
Giron, D., Casas, J., 2003. Lipogenesis in an adult parasitic wasp. J. Insect. Physiol. 49, 141-147.
Jaffert, K.D., Kuris, A.M., 2002. Trophic strategies, animal diversity and body size. TREE 17, 507-513.
Jarosik, V., Honek, A., Dixon, A.F.G., 2002. Developmental rate isomorphy in insects and mites. Am. Nat. 160, 497-510.
Version postprint
Jarosik, V., Krathochvil, L., Honek, A., Dixon, A.F.G., 2014. A general rule for the
dependence of developmental rate on temperature in ectothermic animals. Proc. R. Soc. Lond. B 271, S219-S221.
Lints, F.A., 1978. Genetics and ageing. Interdisciplinary topics in gerontology. Kargel, Basel.
Lints, F.A., Lints, C.V., 1971. Relationship between growth and ageing in Drosophila. Nat. New biol. 229, 86-87.
Lints, F.A., 1988. Genetics. In: Drosophila as a model organism for ageing studies. Springer US., pp 99-118.
Nylin, S., Gotthard, K,. 1998. Plasticity in life-history traits. Ann. Rev. Entomol. 43, 63-83
May, M.L., 1979. Insect thermoregulation. Ann. Rev. Entomol. 24, 313-349.
Muller, H.J., 1963. Mechanisms of life-span shortening. In: Cellular basis and aetiology of late somatic effects of ionizing radiation. Academic Press, pp. 235-245.
Visser, B., Le Lahn, C., den Blanken, F.J., Harvey, J.A., van Alphen, J., 2010. Loss of lipid synthesis as an evolutionary consequence of a parasitic lifestyle. PNAS 107, 8677-8682.
Version postprint
Zwaan, B.J., Bijlsma , R., Hoekstra, R.F., 1991. On the developmental theory of ageing. I . Starvation resistance and longevity in Drosophila melanogaster in relation to pre-adult breeding conditions. Heredity 66, 29-39.
Version postprint
Figure legends
Figure 1. Isomorphy rate, i.e., proportional relationship between the total pre-adult developmental time and rearing temperature (in °C) for 72 arthropod species grouped by functional type: Phytophagous (◯,___), Predator (△, ---) and Parasitoid. (●,….). Symbol = data points, curve = regression line.
Figure 2. Relationship between lifespan and developmental time after logarithmic transformation of both variables to stabilize the variance for 72 arthropod species of agronomic importance grouped by functional type: Phytophagous (◯,___), Predator (△, ---) and Parasitoid. (●,….). Symbol = data points, curve = regression
Version postprint
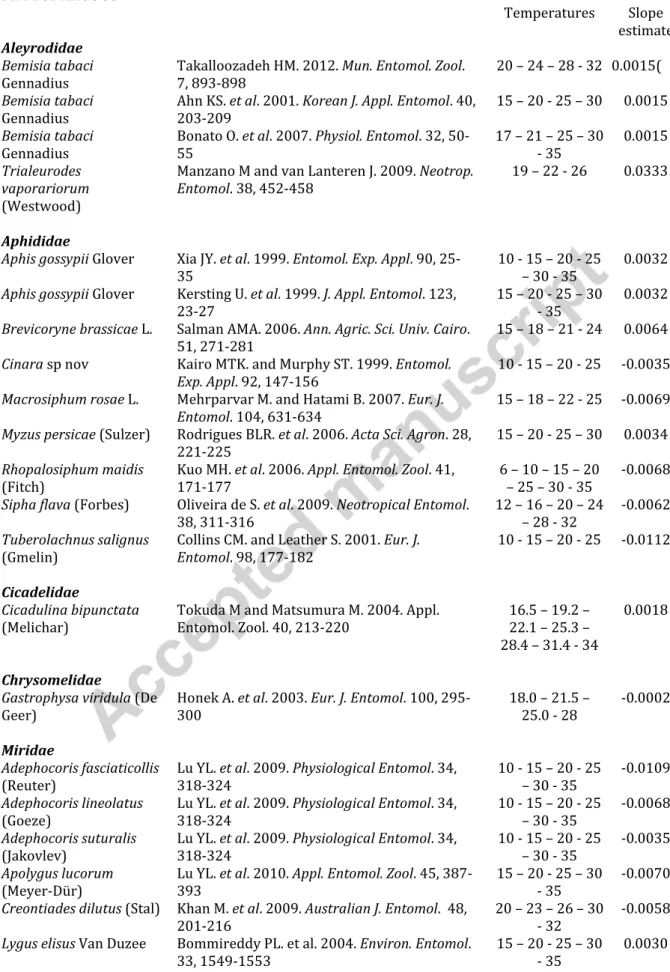
Table 1: List of 72 species considered in the analysis, with their bibliographic source, temperatures to which they were tested by the authors and our estimate of the slope of isomorphy rate. PHYTOPHAGOUS Temperatures Slope estimate Aleyrodidae Bemisia tabaci
Gennadius Takalloozadeh HM. 2012. Mun. Entomol. Zool. 7, 893-898 20 – 24 – 28 - 32 0.0015(
Bemisia tabaci
Gennadius Ahn KS. et al. 2001. Korean J. Appl. Entomol. 40, 203-209 15 – 20 - 25 – 30 0.0015
Bemisia tabaci
Gennadius Bonato O. et al. 2007. Physiol. Entomol. 32, 50-55 17 – 21 – 25 – 30 - 35 0.0015
Trialeurodes vaporariorum
(Westwood)
Manzano M and van Lanteren J. 2009. Neotrop.
Entomol. 38, 452-458 19 – 22 - 26 0.0333
Aphididae
Aphis gossypii Glover Xia JY. et al. 1999. Entomol. Exp. Appl. 90,
25-35 10 - 15 – 20 - 25 – 30 - 35 0.0032
Aphis gossypii Glover Kersting U. et al. 1999. J. Appl. Entomol. 123,
23-27 15 – 20 - 25 – 30 - 35 0.0032
Brevicoryne brassicae L. Salman AMA. 2006. Ann. Agric. Sci. Univ. Cairo.
51, 271-281 15 – 18 – 21 - 24 0.0064
Cinara sp nov Kairo MTK. and Murphy ST. 1999. Entomol.
Exp. Appl. 92, 147-156 10 - 15 – 20 - 25 -0.0035 Macrosiphum rosae L. Mehrparvar M. and Hatami B. 2007. Eur. J.
Entomol. 104, 631-634 15 – 18 – 22 - 25 -0.0069 Myzus persicae (Sulzer) Rodrigues BLR. et al. 2006. Acta Sci. Agron. 28,
221-225 15 – 20 - 25 – 30 0.0034
Rhopalosiphum maidis
(Fitch) Kuo MH. et al. 2006. Appl. Entomol. Zool. 41, 171-177 6 – 10 – 15 – 20 – 25 – 30 - 35 -0.0068
Sipha flava (Forbes) Oliveira de S. et al. 2009. Neotropical Entomol.
38, 311-316 12 – 16 – 20 – 24 – 28 - 32 -0.0062
Tuberolachnus salignus
(Gmelin) Collins CM. and Leather S. 2001. Eur. J. Entomol. 98, 177-182 10 - 15 – 20 - 25 -0.0112
Cicadelidae
Cicadulina bipunctata
(Melichar) Tokuda M and Matsumura M. 2004. Appl. Entomol. Zool. 40, 213-220 16.5 – 19.2 – 22.1 – 25.3 – 28.4 – 31.4 - 34
0.0018
Chrysomelidae
Gastrophysa viridula (De
Geer) Honek A. et al. 2003. Eur. J. Entomol. 100, 295-300 18.0 – 21.5 – 25.0 - 28 -0.0002 Miridae
Adephocoris fasciaticollis
(Reuter) Lu YL. et al. 2009. Physiological Entomol. 34, 318-324 10 - 15 – 20 - 25 – 30 - 35 -0.0109
Adephocoris lineolatus
(Goeze) Lu YL. et al. 2009. Physiological Entomol. 34, 318-324 10 - 15 – 20 - 25 – 30 - 35 -0.0068
Adephocoris suturalis
(Jakovlev) Lu YL. et al. 2009. Physiological Entomol. 34, 318-324 10 - 15 – 20 - 25 – 30 - 35 -0.0035
Apolygus lucorum
(Meyer-Dür) Lu YL. et al. 2010. Appl. Entomol. Zool. 45, 387-393 15 – 20 - 25 – 30 - 35 -0.0070
Creontiades dilutus (Stal) Khan M. et al. 2009. Australian J. Entomol. 48,
201-216 20 – 23 – 26 – 30 - 32 -0.0058
Lygus elisus Van Duzee Bommireddy PL. et al. 2004. Environ. Entomol.
Version postprint
Lygus hesperus Knight Mueller AJ., Stern VM. 1973. Ann. Entomol. Soc.
Am. 66, 593-597 20 – 23 – 26 0.0044 Lygus lineolaris (Palisot
de Beauvois) Ugine TA. 2012. Environ. Entomol. 41, 1-10 17 – 18 – 21 – 25 – 25 – 27 – 30 - 32
-0.0054
Pseudococcidae
Phenacoccus madeirensis
Grenne Chong JH. et al. 2003. Ann. Entomol. Soc. Am. 96, 539-543 15 – 20 - 25 – 30 - 35 -0.0058
Phenacoccus solenopsis
Tinsley Kumar S. et al. 2013. Florida Entomol. 96, 19-28 20 - 25 – 30 - 35 0.0018
Planococcus citri Risso Goldasteh S. et al. 2009. Arch. Biol. Sci.
Belgrade. 61, 329-336 15 – 18 – 20 – 23 – 25 – 28 – 30 – 32
-0.0085
Pseudococcus cryptus
Hempel Kim SC. et al. 2008. J. Asia Pacific Entomol. 11, 149-153 16 – 20 – 24 – 28 - 32 -0.0044 Tetranychidae
Amphitetranychus
viennensis (Zacher) Kasap I. 2003. Exp. Appl. Acarol. 31, 79-91 20 – 30 - 35 -0.0063 Eotetranychus
sexmaculatus (Riley) Jamieson LE. and Stevens PS. 2007. New Zealand Plant Prot. 60, 72-77 10 – 13 – 18 – 21 – 25 - 30 -0.0019
Mononychellus
progresivus Doreste Bonato O. et al. 1995. Entomol. Exp. Appl. 75, 119-125 16 – 22 – 26 – 31 - 36 0.0066
Oligonychus gossypii
(Zacher) Bonato O. et al. 1995. Entomol. Exp. Appl. 75, 119-125 16 – 22 – 26 – 31 - 36 0.0004
Tetranychus abacae
Baker & Pritchard Vasconcelos GJN. et al. Neotrop. Entomol. 33, 149-154 20.0 – 23.0 – 25.5 – 30.0 0.0022
Tetranychus evansi
Baker & Pritchard Moraes G. and McMurthry JA. 1987. Exp. Appl. Acarol. 3, 95-107 15 – 20 - 25 – 30 - 35 -0.0017
Tetranychus evansi
Baker & Pritchard Bonato O. 1999. Exp. Appl. Acarol. 23, 11-19 21 – 26 -31 - 36 -0.0017
Tetranychus lintearius
Dufour Stone C. 1986. Exp. Appl. Acarol. 2, 173-186 15 – 20 – 23 - 25 -0.0174
Tetranychus ludeni
Zacher Domingues da Silva CA. 2002. Pesq. Agropec. Bras. 37, 573-580 20 – 23 – 25 – 28 - 30 -0.0039
Tetranychus pueraricola
Ehara & Gotho Gotho T. et al. 2004. Appl. Entomol. Zool. 39, 675-682 15.0 – 17.5 – 20.0 – 22.5 – 25.0 – 27.5 –
30.0
-0.0100
Tetranychus
urticae(Koch) Osman MA. et al. 2012. Acarines. 6, 25-30 15 – 20 - 25 – 30 - 35 0.0052 Tingidae
Gargaphia torresi Lima Domingues da Silva CA. 2004. Rev. Brasileira
Entomol. 48, 547-552 20 – 23 – 25 – 28 - 30 0.0133
Corythucha ciliata (Say) Ju RT. et al. 2011. J. Insect Sci. 2011, 11-16 16 – 19 – 22 – 26
– 30 – 33 - 36 -0.0051
Stephanitis takeyai
Drake & Maa Tsukada M. 1994. Appl. Entomol. Zool. 29, 571-576 15 – 18 – 20 - 25 -0.0121 Thripidae
Ceratothripoides
claratris (Shumsher) Premachandra WT et al. 2004. Bull. Entomol. Res. 94, 377-384 22 – 25 – 27 – 30 – 34 – 35 - 40 0.0030
Dichromothrips smithi
(Zimmermann) Ahn KS. et al. 2003. Korean J. Apl. Entomol. 42, 211-216 15 – 20 – 25 - 30 -0.0114
Frankliniella occidentalis
Version postprint
Frankliniella occidentalis
(Pergande) Katyama H. 1997. Jpn. J. Appl. Zool. 41, 225-231. 15 – 20 - 25 – 30 -0.0017
Megalurothrips sjostedti
(Trybom) Ekesi S. et al. 1999. Entomol. Exp. Appl. 93, 149-155 14 – 17 – 20 – 23 – 26 - 29 -0.0065
Pezothrips kellyanus
(Bagnall) Varikou K. et al. 2009. Ann. Entomol. Soc. Am. 102, 835-841 15.0 – 20.0 – 25.0 – 30.0 – 32.5 - 35
0.0031
Thrips tabaci Lindeman Murai T. 2000. Appl. Entomol. Zool. 35,
499-504 15 – 20 – 23 – 25 - 30 0.0121
PREDATORS
Miridae
Cyrtorhinus lividipennis
Reuter Do Bae S. et al. 2002. Korean J. Appl. Entomol. 41, 91-97 24 – 28 - 32 0.0029
Deraeocoris brevis
(Uhler) Kim DS., Riedl H. 2005. BioControl. 50, 881-897 21.7 – 24.0 – 30.1 – 32.0 0.0109
Macrolophus pygmaeus
Rambur Perdikis DC., Lykouressis DP. 2002. Bio. Control. 17, 55-60
15 – 20 - 25 – 30 -0.0099
Pilophorus typicus
Distant Nishikawa H. et al. 2010. Jpn. Appl. Entomol. Zool. 45, 313-318 17.5 – 20.0 – 22.5 – 25.0 – 27.5
0.0171
Anthocoridae
Orius albidipennis
Reuter Cocuzza GE. et al. 1997. Entomol. Exp. Appl. 85,189-198 15 – 25 – 35 -0.0020
Orius laevigatus Fieber Cocuzza GE. et al. 1997. Entomol. Exp. Appl.
85,189-198 15 – 25 – 35 0.0040
Orius naivashae
(Poppius) Bonte J. et al. 2012. Environ. Entomol. 41, 989-996 15 -19 -25 - 33 0.0003
Orius sauteri (Poppius) Nagai K., Yano E. 1999. Appl. Entomol. Zool. 34,
223-229 15 – 20 - 25 – 30 -0.0038
Orius strigicollis Poppius Kim JH. et al. 1999. Korean J. Appl. Entomol. 38,
29-33 15 – 20 - 25 – 30 -0.0040
Orius thripoborus
(Hesse) Bonte J. et al. 2012. Environ. Entomol. 41, 989-996 15 -19 –25 –33 0.0091
Nabidae
Nabis roseipennis Reuter Nadgauda D. and Pitre H. 1986. Environ.
Entomol. 15, 536-539 20 - 25 – 30 0.0055
Coccinellidae
Adalia bipunctata L. Jalali MA. et al. 2009. J. Appl. Entomol. 133,
615-625 19 – 23 - 27 -0.0059
Axinoscymmus
cardilobus Huang Z. et al. 2008. Biol. Control. 46, 209-215 14 – 17 – 20 – 23 – 26 – 29 - 32 -0.0017
Clitostethus arcuatus
(Rossi) Adriano Mota J. et al. 2008. BioControl. 53, 603-613 15 – 20 - 25 – 30 0.0050
Hippodamia variegata
(Goeze) Mandour NS. et al. 2011. Egyp. J. Bio. Pest Control. 21, 305-312 15 – 20 - 25 – 30 -0.0019 Scymnus levaillanti
(Mulsant) Uygun N. and Atlihan R. 2000. BioControl. 45, 453-462 15 – 20 - 25 – 30 - 35 -0.0035
PARASITOIDS
Version postprint
Encarsia acaudaleyrodis
Hayat Zandi-Sohani N. and Shishelbor P. 2011. BioControl. 56, 257-263 20 - 25 – 30 - 32 0.0005 Encarsia inaron
(Walker) Malekmohammadi A. et al. 2012. Crop Protection. 34, 1-5 20 - 25 – 30 - 32 0.0199 Eretmocerus sp. nr
furuhashii Qiu BL. et al. 2007. BioControl. 52, 733-746 20 – 23 – 26 – 29 - 32 -0.0050 Braconidae
Apanteles taragamae
Viereck Dannon EA. et al. 2010. BioControl. 55, 363-378 20 – 24 – 26 – 28 - 30 0.0148 Eucoilidae
Gronotoma
micromorpha (Perkins) Abe Y. and Tahara M. 2003. J. Appl. Entomol. 127, 477-480 15 – 18 – 20 – 25 - 30 -0.0037 Eulophidae
Quadrastichus haitiensis
(Gahan) Castillo J. et al. 2005. Biol. Control. 36, 189-196 15 – 20 – 25 – 30 - 33 -0.0161 Ichneumonidae
Campoletis chlorideae
Uchida Dhillon MK. and Sharma HC. 2009. BioControl. 54, 743-750 18 – 23 - 27 0.0035
Venturia canescens
Gravenhorst Spanoudis CG. and Andreadis SS.2012. J. Pest Sci. 85 :75-80 15.0 – 17.5 – 20.0 – 22.5 – 32.5 -25 – 27.5 –
30.0 –
0.0093
Platygastridae
Amitus fuscipennis
McGown & Nebeker De Vis RMJ. et al. 2002. J. Appl. Entomol. 126, 24-33 15 – 20 – 25 – 30 -0.0054 Scelionidae
Telenomus cyamophylax
Polaszek Foerster LA. and Butnariu AR. 2003. Biol. Control. 29, 1-4 15 – 20 – 25 – 30 0.0162 Trissolcus semistriatus
(Nees) Kivan M. and Kilic N. 2006. Entomol. Sci. 9, 39-46 17 – 20 – 26 - 32 -0.0136
Trichogrammatidae
Trichogramma aurosum
Sugonjaev & Sorokina Samara R. et al. 2011. Phytoparasitica. 39, 109-119 15 – 20 – 25 – 30 0.0066
Table 2 : Fixed effect estimates of the mixed model describing the relationship between lifespan and developmental time for the 72 arthropods tested.
Estimate Std. Error t value a (Parasitoid) -0.61304 0.27044 -2.267
Version postprint
a (Phytophagous) 0.88140 0.14088 6.256
b (Parasitoid) 1.05384 0.08523 12.365
b (Predator) 0.85853 0.06853 12.528
Version postprint
Highlights :
Relationship between lifespan and development time is more complex than that predicted by rate isomorphy hypothesis
Version postprint
A power law can describe the relationship of proportionality between development time and lifespan
This power law is applicable to all arthropods tested but the parameters depend on their functional type: phytophagous, predator or parasitoid
The hypothesis of a lower thermal threshold common to all developmental stages of a same species remains valid