HAL Id: hal-01771839
https://hal.archives-ouvertes.fr/hal-01771839
Submitted on 27 May 2020
HAL is a multi-disciplinary open access
archive for the deposit and dissemination of
sci-entific research documents, whether they are
pub-lished or not. The documents may come from
teaching and research institutions in France or
abroad, or from public or private research centers.
L’archive ouverte pluridisciplinaire HAL, est
destinée au dépôt et à la diffusion de documents
scientifiques de niveau recherche, publiés ou non,
émanant des établissements d’enseignement et de
recherche français ou étrangers, des laboratoires
publics ou privés.
Distributed under a Creative Commons Attribution| 4.0 International License
stramenopiles reveals underestimated functional
diversity across oceans
Yoann Seeleuthner, Samuel Mondy, Vincent Lombard, Quentin Carradec, Eric
Pelletier, Marc Wessner, Jade Leconte, Jean-François Mangot, Julie Poulain,
Karine Labadie, et al.
To cite this version:
Yoann Seeleuthner, Samuel Mondy, Vincent Lombard, Quentin Carradec, Eric Pelletier, et al..
Single-cell genomics of multiple uncultured stramenopiles reveals underestimated functional diversity across
oceans. Nature Communications, Nature Publishing Group, 2018, 9, pp.310.
�10.1038/s41467-017-02235-3�. �hal-01771839�
ARTICLE
Single-cell genomics of multiple uncultured
stramenopiles reveals underestimated functional
diversity across oceans
Yoann Seeleuthner et al.
#Single-celled eukaryotes (protists) are critical players in global biogeochemical cycling of
nutrients and energy in the oceans. While their roles as primary producers and grazers are
well appreciated, other aspects of their life histories remain obscure due to challenges in
culturing and sequencing their natural diversity. Here, we exploit single-cell genomics and
metagenomics data from the circumglobal
Tara Oceans expedition to analyze the genome
content and apparent oceanic distribution of seven prevalent lineages of uncultured
het-erotrophic stramenopiles. Based on the available data, each sequenced genome or genotype
appears to have a speci
fic oceanic distribution, principally correlated with water temperature
and depth. The genome content provides hypotheses for specialization in terms of cell
motility, food spectra, and trophic stages, including the potential impact on their lifestyles of
horizontal gene transfer from prokaryotes. Our results support the idea that prominent
heterotrophic marine protists perform diverse functions in ocean ecology.
DOI: 10.1038/s41467-017-02235-3
OPEN
Correspondence and requests for materials should be addressed to M.S. (email:mike.sieracki@gmail.com) or to C.d.V. (email:vargas@sb-roscoff.fr) or to P.W. (email:pwincker@genoscope.cns.fr)
#A full list of authors and their affliations appears at the end of the paper
123456789
T
he microbial loop in planktonic ecosystems is the process
by which suspended organic matter produced within food
webs is channeled through heterotrophic prokaryotes and
their tiny grazers and eventually transferred to higher trophic
levels or remineralized
1. Very small but numerous marine
het-erotrophic protists play key roles in these processes. Since most of
them remain uncultured, their functions remain largely
unknown
2. A recent DNA metabarcoding survey based on Tara
Oceans global plankton samples has revealed the existence of
thousands of heterotrophic protist taxa in eukaryotic
commu-nities
3that potentially participate in numerous species interaction
networks in yet-to-be defined ways
4. An extensive genome-level
description of abundant marine heterotrophic protists could
therefore be a key step toward understanding their ecological
roles. Currently, the only way to obtain such information is
through single-cell sequencing, although the technology is still in
its infancy for eukaryotic cells
5–10, since generated assemblies are
highly fragmented and rarely complete.
Here, we integrate single-cell genomics with metagenomic and
metatranscriptomic sequence data for exploring the ecological
and functional complexity of uncultured micro-eukaryotes, key
players in the world’s largest ecosystem. We selected for our study
40 single cells representative of three uncultured stramenopile
clades that are known to be abundant in marine pico-nano
plankton. Marine stramenopile group 4 (MAST-4)
representa-tives are small,
flagellated, bacterivorous cells that are abundant in
temperate and tropical oceans
11,12. A partial genome of a
MAST-4 clade D was previously characterized using single-cell
sequen-cing
8. In this study, we present three distinct genomes from
clades A, C, and E, clearly divergent from clade D. MAST-3
11is a
very diverse group of small
flagellated organisms that includes a
potential diatom epibiont and one cultured strain
13,14.
Hetero-trophic chrysophytes from the Clade H additionally appear to be
abundant in the ocean, according to environmental DNA
sur-veys
15. It has been postulated that all of these lineages originated
from a presumably autotrophic stramenopile ancestor
16, although
lack of genome information has hindered understanding of the
evolution of heterotrophy vs. autotrophy within the
strameno-piles. Assessment of the genes involved in the degradation of
organic matter may thus be relevant for elucidating their roles in
marine ecosystems and biogeochemical cycles
17.
Results
Assembly strategy. More than 900 single-cell amplified genomes
(SAGs) were generated from small heterotrophic protists selected
from eight Tara Oceans sampling stations representing
con-trasting environments in the Mediterranean Sea and Indian
Ocean. SAGs belonging to the target lineages were identified by
PCR and subsequent sequencing of their 18S rRNA gene. A total
of 40 SAGs were sequenced
18: 23 from three MAST-4 lineages
(MAST-4A, MAST-C, and MAST-E), six from two lineages of
MAST-3 (MAST-3A and MAST-F), and 11 from two lineages of
chrysophytes (Chrysophytes H1 and H2). We also generated
metagenomic and metatranscriptomic datasets from the 0.8 to 5
µm size fraction collected from 76 and 68 Tara Oceans sampling
sites, respectively, to assist the removal of potential contaminants
from nuclear sequences and to improve gene structures (see
section
“Methods”; Supplementary Fig.
1
, and companion
papers
18,19). The characteristics of each composite genome are
summarized in Table
1
. The MAST-4A cells were co-assembled as
two independent sets of sequences, for use as an internal control
for subsequent analyses and because they originated from two
different water masses; however, they were very similar in
gen-ome composition (Supplementary Fig.
2
) and a single assembly
would have been possible
20.
Functional repertoires. To assess variation in the functional
repertoires of the sequenced uncultured stramenopiles and to
provide further context, we predicted functional domains (Pfams)
in each annotated protein from each of the lineages, and
com-pared their diversity and abundance against each other and
against other sequenced stramenopile genomes. We then
calcu-lated pairwise distances between genomes based on relative Pfam
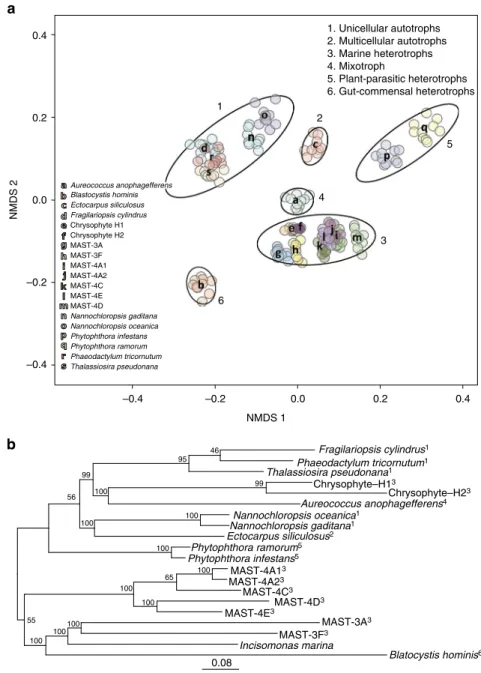
abundances. The resulting pattern (Fig.
1
a) indicated that the
uncultured heterotrophic stramenopiles contained a diversity of
gene repertoires, comparable to those of the sequenced genomes
of autotrophic stramenopiles. However, the composition of each
genome clustered primarily according to the trophic mode of
each organism, with groups corresponding to heterotrophs,
single-celled autotrophs, multicellular autotrophs, and
mixo-trophs. Moreover, within the heterotrophs, the MAST lineages
and the chrysophytes-clade H clustered into a single functional
group despite their distant phylogenetic positions (Fig.
1
b,
Sup-plementary Fig.
3
). They could also be clearly distinguished from
the plant-parasitic and gut-commensal heterotrophic
strameno-piles (Fig.
1
a, groups 3, 5, and 6), suggesting ecosystem-specific
functional diversification, which needs further investigation.
Within the marine SAG genomes, many gene families showed
differential abundances, indicating that functional capacities are
distinct (Supplementary Table
1
). One extreme pattern was
observed for genes encoding the axonemal dynein heavy chain
(DHC), which is an essential
flagellar component. Almost all SAG
genomes contained a family of genes encoding DHCs, with the
exception of MAST-3A, for which we could not detect a single
full-length gene and observed a significant decrease in the
number of DHC Pfam domains (Supplementary Fig.
4
). A closer
examination of the MAST-3A genome regions containing the
DHC-associated Pfam domains showed evidence of advanced
Table 1 SAGs assembly and annotation summary
Name Number of cells Raw assembly size (Mbp) Cross SAG sequences (Mbp) Outlier sequences (Mbp) Final assembly size (Mbp) N50 BUSCO v2 complete genes (%) Number of predicted genes Chrysophyte H1 8 16.7 0.1 0.6 15.9 25,581 57 3050 Chrysophyte H2 3 14.3 1.1 0.3 10.6 10,194 27 1637 MAST-3A 4 20.0 0 1.0 18.9 6223 53 3289 MAST-3F 2 21.5 0 0.3 21.1 7132 37 2694 MAST-4A1 6 33.4 0 1.0 31.8 10,950 59 8018 MAST-4A2 4 37.1 3.0 1.1 32.8 11,577 64 8537 MAST-4C 4 31.2 0 0.9 30.0 8097 54 5478 MAST-4E 9 30.3 0.2 1.4 28.4 9788 61 4652
SAG single amplified genome, N50 length of the shortest scaffold from the minimal set of scaffolds representing 50% of the assembly size, BUSCO v2 number of complete genes found using the BUSCO program (Benchmarking Universal Single-Copy Orthologs)
pseudogenization (Supplementary Fig.
4
c and
e–i
), indicating that
relatively recent gene loss events are responsible for the absence
of DHC-encoding genes. Although we did not observe DHC
reduction in the MAST-3F genome (Supplementary Table
1
;
Supplementary Fig.
4
a), previous morphological analyses of other
MAST-3 members had indicated reduced motility and the
presence of only a single
flagellum
12,13. Solenicola setigera
(MAST-3I clade) is found living epiphytically on diatoms, while
the cultured Incisomonas marina (MAST-3J clade) seems to be a
bad swimmer, with cells generally attaching to surfaces. Motility
may therefore have been dispensed with on multiple occasions in
these organisms, and may be congruent with the switch to
epiphytic or parasitic lifestyles in several MAST-3 lineages.
We further observed the presence of rhodopsin coding genes
exclusively in the MAST-4C lineage, suggesting again functional
adaptation. Two rhodopsin classes with distinct functions are
known: sensory rhodopsins act as light sensors for diverse signal
transduction pathways, whereas proteorhodopsins are
light-driven proton pumps that synthesize ATP independently of
photosynthesis
21. Phylogenetic analysis of these two rhodopsin
genes revealed that they are related to previously described
proteorhodopsins of diatoms, dinoflagellates and haptophytes,
0.4 0.2 0.0 6 3 5 4 2 1 Aureococcus anophagefferens Thalassiosira pseudonana Phaeodactylum tricornutum Phytophthora ramorum Phytophthora infestans Nannochloropsis oceanica Nannochloropsis gaditana MAST-3A Chrysophyte H2 Chrysophyte H1 Fragilariopsis cylindrus Ectocarpus siliculosus Blastocystis hominis MAST-3F MAST-4A1 MAST-4A2 MAST-4C MAST-4E MAST-4D –0.2 –0.2 –0.4 –0.4 95 46 99 99 100 56 100 100 100 100 100 0.08 55 65 100 100 100 100 0.0 0.2 0.4 NMDS 2 NMDS 1 1. Unicellular autotrophs 2. Multicellular autotrophs 3. Marine heterotrophs 4. Mixotroph 5. Plant-parasitic heterotrophs 6. Gut-commensal heterotrophs Fragilariopsis cylindrus1 Nannochloropsis oceanica1 Nannochloropsis gaditana1 Ectocarpus siliculosus2 Phytophthora ramorum5 Phytophthora infestans5 Incisomonas marina Blatocystis hominis6 MAST-4A13 MAST-4A23 MAST-4C3 MAST-4D3 MAST-4E3 MAST-3A3 MAST-3F3 Phaeodactylum tricornutum1 Thalassiosira pseudonana1 Chrysophyte–H13 Chrysophyte–H23 Aureococcus anophagefferens4
b
a
Fig. 1 Marine heterotrophic SAG lineages form a functional group distinct from autotrophs and other heterotrophs. a Non-metric multidimensional scaling (NMDS) projection of a Bray–Curtis distance matrix that shows Pfam motif occurrences in various stramenopile genomes. Because the genome sequences are incomplete, a rarefying procedure was applied to obtain 1400 Pfam motifs per genome. Ten independent rarefied samples were obtained and used for NMDS. Ellipses (at 95% confidence limit) were drawn by using the ‘ordiellipse’ function of the vegan package in R, with the group defined by life history mode (indicated by number in top right). Letters indicate the positions of the mean coordinates of the 10 rarefied Pfam counts per organism. The analysis was conducted on 19 stramenopile genomes, which included MAST-4D8. Marine heterotrophic stramenopiles from this study form a large but coherent group (Group 3), which is distinct from autotrophic species and heterotrophic species from other environments.b Phylogenetic tree from the analysis of a total of 160 conserved eukaryotic proteins using maximum likelihood. Protein sequences ofIncisomonas marina from ref.44are included. Indices indicate life history mode as in panela. Bootstrap values are represented on internal nodes. The branch length represents the mean number of substitutions per site
and are evolutionarily distant from prokaryotic
proteorhodop-sins
22,23(Supplementary Fig.
5
). MAST-4C rhodopsins are thus
eukaryotic proteorhodopsins, not derived from recent bacterial
gene transfers. No proteorhodopsins were found in the other
lineages, suggesting a specific genetic adaptation of MAST-4C to
phototrophy. The MAST-4C proteorhodopsin genes appear to be
highly expressed in surface samples, representing more than 3%
of the total MAST-4C transcripts (Supplementary Fig.
5
b). We
further observed that MAST-4C cells were preferentially detected
in samples from tropical surface waters (see below).
We then explored the gene families related to organic carbon
acquisition
in
the
various
MAST
lineages,
and
used
Carbohydrate-active enzymes (CAZymes) as indicators of
nutrient acquisition and more generally of organismal
glycobio-logical potential
24. The CAZyme-encoding gene profiles indicated
a large repertoire of glycoside hydrolases (GHs) in almost all
genomes, with many bearing secretion peptide signals
(Supple-mentary Table
2
). This is consistent with the bacterivorous
lifestyle proposed for most of these organisms, which have the
capacity to degrade bacterial carbohydrates and to target them for
degradation in phagosomes. MAST-4 was found to be the most
CAZyme-rich group, consistent with it including only
bacter-ivorous lineages. On the other hand, MAST-3F appears to have a
very limited CAZyme repertoire, almost none of which appear to
be secreted. The MAST-3F genome also encodes fewer hydrolytic
enzymes of other types, such as proteases (Supplementary
Table
1
), indicating that MAST-3F may not be bacterivorous.
The other most CAZyme-poor genomes are those of
chryso-phytes, a group containing many photosynthetic organisms with
mixotrophic behavior. This suggests complex evolutionary
patterns in chrysophyte genomes, with intricate losses and/or
gains of genes involved in photosynthesis and heterotrophy.
Putative substrates were predicted on all encoded CAZymes
theoretically capable of cleaving complex carbohydrates (GHs
and polysaccharide lyases) to reveal which enzymes are involved
in bacterivory and possible carbohydrate acquisition from other
sources (Fig.
2
). Identification of lysozymes from the GH25
family in most co-assembled genomes could be indicative of
peptidoglycan breakdown. Moreover, in all 4 and
MAST-3A genomes, suites of genes encoding enzymes able to hydrolyze
all the components of green and brown algal cell walls were
detected, including cellulose, xylan, pectin, and agarose (Fig.
2
).
Interestingly, examination of sequences that were considered as
contaminants during genome reconstruction revealed large
fragments of chloroplast, and sometimes even nuclear, DNA
from photosynthetic eukaryotes in two of the MAST-4A and one
of the MAST-4E cells, but not in any of the other lineages
(Supplementary Table
2
). MAST-4 was previously shown to have
the capacity to ingest eukaryotic microalgae in an experimental
setting in the presence of high algal concentrations
25. Our
observations provide further evidence for the role of MAST-4 and
MAST-3A in algal consumption, which could have a significant
impact on the transfer of organic material from primary
producers to higher trophic levels. Further function predictions
identified candidate secreted enzymes for the breakdown of
starch, chitin, and beta-1,3-glucans (Fig.
2
). The above
observa-tions imply that the examined organisms may have the capacity
to degrade organic materials from bacteria and algae, as well as
from chitin-containing organisms, such as fungi, diatoms, and
crustaceans, emphasizing their global involvement and
differ-entiated roles in the microbial loop.
For the MAST-4A, MAST-4C, MAST-4E, and MAST-3A
genomes, the number of GH genes exceeded that of
glycosyl-transferases (GTs), with the GH/GT ratio ranging from 1.6 to 2,
reflecting the heterotrophic nature of these organisms. However,
the MAST-3F and chrysophytes H1 and H2 genomes displayed
higher numbers of GTs than GHs, indicating that these
organisms may be less dependent on carbohydrate degradation.
Horizontally transferred genes. Another fundamental question
is whether heterotrophic protists are impacted by horizontal gene
transfer (HGT) from the prey they ingest. We assessed the extent
to which genes had probably been acquired by horizontal transfer
from prokaryotes in each SAG lineage (see section
“Methods”).
The proportion of potential HGT events was different among the
studied genomes (Supplementary Table
3
). The lowest observed
value was for MAST-3F, which was also the genome lacking
elements suggestive of a bacterivorous lifestyle (see above). A link
could therefore exist between bacterivory and prokaryotic gene
acquisition in the other lineages. Furthermore, the functional
classification of candidate HGTs based on Clusters of
Ortholo-gous Groups (COGs)
26showed a bias towards metabolic activities
(Supplementary Fig.
6
a and
6
b). Refining the metabolic COG
categories revealed an even more pronounced bias towards
activities linked to carbohydrate and protein degradation,
defense/resistance against bacteria and nitrogen utilization
(Supplementary Table
4
). Overall, our data indicate that each
MAST lineage may have a different functional profile in terms of
organic matter processing, and that HGT may have contributed
to enabling this metabolic specialization.
Geographical distributions. Finally, we used metagenomic
fragment recruitment from the 0.8 to 5
µm size-fraction of the
Tara Oceans metagenomics dataset to explore the global
dis-tribution of the studied lineages and of MAST-4 D (Fig.
3
). In
addition to quantifying lineage-specific abundances,
metage-nomics data was used to obtain indications of genetic
diversifi-cation by using the similarity of nucleotide sequences to each
reference genome as a measure of divergence (Supplementary
Fig.
7
). Widely differing geographic distributions were observed.
First, the previously sequenced MAST-4 D genome is
encoun-tered in only one coastal sample from the South Atlantic Ocean,
indicating that open ocean populations of MASTs can differ from
coastal ones. In the studied lineages, only one organism with a
well-conserved genotype, MAST-4A, appears to be cosmopolitan,
although it was not detected in the Southern Ocean. Another
group, MAST-4C, displays high genetic homogeneity worldwide
but with a geographic range restricted mostly to tropical and
sub-tropical waters, except in the sub-sub-tropical Atlantic Ocean. In
other cases, we observed the existence of genotype subsets
divergent from the reference genomes, with preferential
geo-graphic patterns (MAST-4E, MAST-3A, and chrysophyte H1).
Finally, chrysophyte H2 and MAST-3F are low-abundance
spe-cies encountered in different regions as divergent genotypes.
Each of the distributions was compared to the environmental
parameters recorded at each sampling site
27,28(the four most
significant parameters are highlighted in Supplementary Fig.
8
).
The most significant parameter that discriminate the distributions
(Kruskal–Wallis test p-value = 2.2×10
−16) was water temperature
(Fig.
4
a), suggesting that some of these species likely have
preferential temperature ranges in which they are maximally
abundant. Divergent MAST-3A and MAST-4E genomes were
found in water temperatures distinct from where organisms with
genomes more similar to the reference SAG genome thrive
(Wilcoxon test, p-value
<2×10
−2and p-value
<3×10
−4,
respec-tively; Fig.
4
b and c). Finally, depth-dependent distributions were
also frequent, with MAST-4C and MAST-3A being located
preferentially in the subsurface, while MAST-4E and Chrysophyte
H1 were found predominantly at the deep chlorophyll maximum
(DCM), except in well-mixed water columns (Fig.
3
).
Discussion
Our
findings indicate that each of the examined taxa may have a
specific spatial distribution that correlates with environmental
parameters, principally ocean provinces, temperature, and depth.
However, some limitations of the data set—mostly its single time
point per location, the use of Tara Oceans metagenomes as the
only resource, the relatively low resolution of sampling points per
geographical area, and the absence of metagenomics replicates—
may have under-estimated the true distribution of the organisms
studied here. Notwithstanding, the Tara Oceans data set is by far
the largest available today, and is the only extensive
metage-nomics effort tackling specifically the size fraction where these
heterotrophic protists can be found (no additional location was
revealed using the other available size fractions). The relatively
low resolution of sampling locations is balanced by a careful
choice of oceanographic situations in each sampled region. The
depth of sequencing is also particularly significant compared to
other studies (at about 25 Gb per sample), so the use of replicates
will be of low utility for detecting the presence of the genomes
under study here. The major limitation in our view is the absence
of temporal information from each sampling location. Although
Tara Oceans was a 3-year expedition that sampled plankton
across all seasons, each location is currently described at a single
time only and so it will be interesting to extend our results in
future sampling campaigns by targeting sites of interest during
different seasons.
GH35 β-Galactosides Chitin Chitin Xylan α-Galactosides α-Mannosidesα-Glucosides α-Mannosides α-Galactosides Heparin Glycogen/starch Pectin/xylan Misc Misc Pectin Chitin Cellulose/xylan Pectin Xylan N-Glycans α-Mannosides β-1,3-Glucan Trehalose Sucrose Glycogen/starch Peptidoglycan Trehalose Agarose Glycogen/starch Peptidoglycan β-Mannosides Xylan α-Fucosides α-Fucosides α-Mannosides α-Mannosides Sialic acid Glycolipid α-Mannosides β-1,3-Glucan Misc Cellulose Hyaluronic acid Glycolipid Pectin/xylan α-GlcNAc GH18 GH89 GH56 GH10 GH59 GH54 GH19 GH39 GH63 GH99 GH55 GH37 GH32 GH15 GH25 GH65 GH86 GH14 GH24 GH130 GH67 GH29 GH1 GH76 GH7 GH125 GH95 GH92 GH16 GH33 GH5 GH36 GH13 GH79 GH43 GH78 GH2 GH30 GH38 GH31 GH47 GH28 GH3 GH20 GH27MAST-4A1 MAST-4A2 MAST-4E MAST-3A MAST-3F
Chrysophyte H2
Chrysophyte H1
MAST-4C
Fig. 2 SAG lineage glycoside hydrolases (GHs). GH families are numbered (right) according to the CAZyme database. Potential substrates are indicated on the left side. Internal numbers represent the number of genes in each genome predicted to belong to the GH category. Colors indicate the number of predicted GH genes per family, from low (red) to high (green)
Moreover, the differentiated gene content between taxa
sug-gests specific distinctive functional capacities even within taxa.
This indicates that, like prokaryotes and phytoplankton
29–31,
heterotrophic protists are not interchangeable components of
marine plankton ecosystems, but effectively participate from
varied perspectives in the highly complex networks of interacting
taxa
4,32.
Methods
Single-cell isolation and amplification. Aquatic samples were collected during the Tara Oceans expedition23,33. One-milliliter aliquots were amended with 6% (final concentration) glycine betaine and stored at−80 °C34. Flow-cytometric sorting, whole genome amplification, and sequencing of partial 18S rRNA genes of single cells were performed by the Bigelow Laboratory Single Cell Genomics Center (https://scgc.bigelow.org/), following previously described protocols5,7with a slight modification: 1x SYBR Green I (Life Technologies Corporation) was used instead of Lysotracker Green to stain the cells18. The 40 SAGs analyzed in this study came from the Mediterranean Sea (sampled in November 2009) and Indian Ocean (sampled in March 2010) (Table1). Cell sorting was performed on cells lacking chlorophyll. Therefore all cells were considered heterotrophic.
Sequencing and assembly. The steps used for assembly, annotation, and con-tamination control are summarized in Supplementary Fig.1a. Library preparation from single cells is described in Alberti et al.18. All cells were independently sequenced on a 1∕8thIllumina HiSeq lane, which produced ~25 million 101-bp
paired-end reads. Reads from SAGs with highly similar 18S werefirst co-assembled using the HyDA assembler35. Based on colored de Bruijn graphs, HyDA outputs
the contribution of each library to each contig, which provides a criterion to determine which libraries can be co-assembled: only libraries that cover a large fraction of the longest contigs were pooled, which ensured that the genomes were close enough to be co-assembled. Libraries that were successfully co-assembled with HyDA were then re-assembled using SPAdes 2.436, which provided the best results in terms of assembly size, N50 and number of core eukaryotic genes recovered. Although SPAdes provides an integrated scaffolder, we re-scaffolded contigs with SSPACE v237andfilled gaps with GapCloser (SOAPdeNovo2 package [v 1.12-6]38). Scaffolds shorter than 500 bp were discarded from the assembly. Accession numbers of generated assemblies can be found in Supplementary Table5.
Removal of organelle sequences. Because we found nearly identical organellar DNA sequences in different SAG assemblies, we suspected a potential biological or technical contamination of these highly amplified sequences and decided to completely separate organellar sequences from the assemblies.
The presence of organellar scaffolds was searched using a combined approach. First a BLASTn analysis was done using scaffolds as queries against a database that contained all sequenced organelle genomes. Scaffolds similar to a known organelle genome (bit score>1000) were flagged. Then, a scaffold was considered to have an organelle origin if at least three predicted proteins from the scaffold showed similarities to proteins from the Curated Chloroplast Protein Clusters (CHL) or Curated Mitochondrial Protein Clusters (MTH) databases (http://www.ncbi.nlm. nih.gov/books/NBK3797/). Then, the two lists were merged. The scaffolds that were inferred to have come from organelles were retrieved from the SAG dataset for subsequent analysis and the corresponding proteins were removed from the nuclear protein dataset.
23 23 MAST-4A MAST-4C MAST-4E MAST-4D Chrysophyte H1 Chrysophyte H2 MAST-3A MAST-3F DCM SRF DCM SRF DCM SRF DCM SRF DCM SRF DCM SRF DCM SRF DCM SRF Abundance (%) Identity (%) 100 99 98 97 96 95 Identity (%) 100 99 98 97 96 95 Identity (%) 100 99 98 97 96 95 Identity (%) 100 99 98 97 96 95 Identity (%) 100 99 98 97 96 95 Identity (%) 100 99 98 97 96 95 Identity (%) 100 99 98 97 96 95 Identity (%) 100 99 98 97 96 95 0.05 0.30 0.50 Abundance (%) 0.01 0.06 0.10 Abundance (%) 0.01 0.06 0.10 Abundance (%) 0.005 0.008 0.010 Abundance (%) 0.001 Abundance (%) Abundance (%) 0.005 0.050 0.100 0.005 0.008 0.010 Abundance (%) 0.005 0.030 0.050 23 23 41 41 23 23 23 23 23 23 41 41
a
b
c
d
e
f
g
h
Fig. 3 Biogeographic distribution of the SAG lineages based on metagenome read recruitment with separation between deep chlorophyll maximum and subsurface. Global maps showing the presence of the SAG lineages based on metagenomics read mapping at eachTara Oceans station either as a black dot (no signal detected) or as a circle whose diameter indicates the species relative abundance. Abundance in samples from deep chlorophyll maximum (DCM, left panel) often differs from surface samples (SRF, right panel): only MAST-4A shows the same pattern in DCM and SRF samples (a). The color inside each circle provides the median percentage similarity of the reads to the reference. The station from where the SAG originates is indicated by its
Cross-genera contamination removal. To detect identical scaffolds in the dis-tantly related SAGs from this study, all scaffolds were cut into 1000 bp-long fragments along a 500-pb overlapping sliding window. We used entire sequences of scaffolds shorter than 1000 bp. We aligned these fragments on each target assembly with BLAT and kept alignments with≥95% identity >80% length. For each assembly, we considered and discarded contigs with at least one selected match with a distant phylum as contaminants. We distinguished three taxa: chrysophytes, MAST-3, and MAST-4. Subsequently, we assessed assembly completion using the BUSCO v2 pipeline39with the eukaryotic set of genes.
Gene prediction. Protein-coding genes were predicted by combining alignments of proteins from a custom database built from Uniref100 and MMETSP, alignments of transcripts from the Tara Oceans collection and ab initio gene models. The combination step was performed using the GAZE framework.
The custom protein database was based on Uniref100, with the addition of curated translated CDS from MMETSP transcripts and in-house sequenced transcriptomes. Thefinal dataset contained more than 26 million proteins that were aligned using a two-step strategy. Protein sequences werefirst aligned using the fast BLAT program and significant matches were then re-aligned using the more accurate Genewise v2.2.0 software.
Transcripts from the Tara Oceans metatranscriptomic dataset were mapped using BLAST + 2.2.28. Significant alignments were then refined using est2genome, in particular to properly define exon–intron boundaries. To select organism-specific transcripts and avoid false positives, we only retained transcripts with ≥95% identity and with ≥80% of their length aligned onto the assembly.
Ab initio models were predicted using SNAP (v2013-02-16) trained on complete protein matches. Because of the insufficient number of complete proteins matching the MAST-3 F assembly, SNAP was trained on MAST-3 A assembly before running on that of MAST-3 F (Supplementary Table6).
GAZE framework was used to integrate these three types of resources, using different weights to reflect their reliability. The most reliable resources—transcript alignments—were weighted 6.0, whereas protein alignments were weighted 4.5 and ab initio models 1.0. The weight acts as a multiplier for the score of each resource to build thefinal gene structure. Gene predictions with a GAZE score ≥0 were selected.
Bacterial decontamination. Bacterial scaffolds were detected using the alien index (AI)40calculated on each predicted gene. The alien index was defined as log(best eukarytic hit e-value + 10−200)−log(best non-eukaryotic hit e-value + 10−200). Thus, purely eukaryotic genes have a negative value whereas prokaryotic genes have a positive value. Scaffolds with predicted genes having an AI> 45 exclusively were considered as bacterial scaffolds and discarded from thefinal assembly. Metagenomic sequencing and mapping. We sequenced 122 samples (accession numbers and contextual data in Supplementary Data1–3) from 76 stations from the 0.8 to 5µm size fractions (the size fraction where the studied MAST lineages
are most abundant), and obtained a total of 23.1×10⁹Illumina 101-bp paired-end reads. Reads from the 0.8 to 5µm fraction size samples were mapped, in a three-step pipeline. In order to avoid the computation-intensive mapping of all reads, we first selected reads with at least one 25-mer in common with the target assembly. We then mapped the selected reads using bowtie2 2.1.0 aligner41with default parameters. Finally, wefiltered alignments that correspond to low complexity regions using the DUST algorithm: alignments with<95% mean identity or <30% of high complexity bases were discarded.
Discarding contaminants through metagenomic signatures. The presence of unrelated sequences in the assembly was analyzed using a combination of approaches to obtain a list of scaffolds with atypical or suspect content. First, eukaryotic and prokaryotic signatures were determined for each scaffold. For this, a BLASTx analysis was conducted using the predicted gene as query against the nr-prot database (e-value threshold<1×10−0.5) followed by taxonomic assignment of
each hit. A scaffold was determined to have a eukaryotic signature if it presented either at least one prediction assigned to one eukaryotic organism or none of the gene predictions had any similarities in the database. The scaffolds without these signatures were removed from the dataset. Second, we developed a new method to identify a population of scaffolds that co-vary in representation in the metage-nomic data (see details below). This method identified outlier and inlier genes. The outlier dataset included genes with atypical behavior relative to the whole popu-lation of genes. Scaffolds that contained all genes that belonged to the outlier dataset were discarded. Supplementary Fig.1b depicts an example of two different outlier scaffold groups (red), compared with the inlier scaffolds (blue). The three approaches were combined, which facilitated generation of a cleaned scaffold dataset and a corresponding cleaned gene dataset.
Gene functional analysis: comparison of Pfam domain content between stramenopile genomes. CDD search 3.11 was used for functional annotation of SAG genomes. Annotation was conducted on the cleaned gene dataset (see above) including outlier genes contained within single-gene scaffolds. We retrieved the Pfam motifs from CDD search output. Multiple occurrences of the same Pfam motif in one protein were counted as one. To perform a comparative analysis of the Pfam signature in the stramenopile taxa, we retrieved the protein dataset of representative available stramenopile genomes. To homogeneize these datasets from different projects, functional annotation of these gene datasets was per-formed. Proteins with similarities to CHL and MTH clusters were retrieved from the prior analysis. Because genome completeness was not similar between SAG lineages, random sorting of 1400 Pfam domains was independently performed 10 times for each genome. This threshold was selected because 1414 was the lowest number of Pfams, found per genome. A matrix with Pfam motif occurrence for all stramenopiles (10 random samplings per organism) was obtained. To visualize differences between Pfam content in stramenopile communities, we used non-metric multi-dimensional scaling (NMDS) based on Bray–Curtis dissimilarity distance. Bray–Curtis was used instead of Pearson correlation factor, because Bray–Curtis is unaffected by the addition or removal of Pfam motifs that are not
30°C 25°C Density 0.20 Identity < 98% Identity ≥ 98% Identity < 98% Identity ≥ 98% 0.15 0.10 0.05 0.00 0 10 20 30 Temperature (°C) 0 10 20 30 Temperature (°C) Density 0.15 0.10 0.05 0.00 20°C 15°C 10°C 5°C 0°C 0.0299% 0.0146% 0.0806% 0.0011% 0.4864% 0.5087% 0.2241% 0.2765% Chrysophyte-H1Chrysophyte-H2
MAST-3A MAST-3F MAST-4A1MAST-4A2 MAST-4C MAST-4E
a
b
c
Fig. 4 Water temperature and distribution of the heterotrophic protists. ax-axis represents the lineage composite genomes, and y-axis represents surface temperatures in degrees Celsius at each sampling location. Relative abundances are represented by circle size (one per station/depth where the genome was detected). The scale for each column is indicated below the name of the lineage.b MAST-3A abundance distribution relative to temperature. A difference in the distributions is observed with ap-value <2×10⁻²(Wilcoxon test).c MAST-4E abundance distribution relative to temperature. Means are statistically different with ap-value <3×10⁻⁴(Wilcoxon test). Inb and c, line type indicates median sequence similarity to the reference genome assembly
present in two gene repertoires. Moreover, it is unaffected by the addition of a new genome in the analysis. If Euclidean distance measures were used, the presence of double zeros in Pfam matrix abundance data may result in two genomes without any Pfam motifs in common being found to be more similar than other genome pairs with shared motifs. Bray–Curtis calculation and NMDS were created using the vegan package (v1.17-11) in R. Ellipses (95% confidence limit) were drawn in vegan using the ordiellipse function, with each group defined by common life history mode.
Phylogenomic analysis. The maximum likelihood phylogenetic tree of sequenced stramenopiles was reconstructed from conserved eukaryotic proteins detected using the BUSCO v2 pipeline. A total of 160 protein sequences present in at least four SAG assemblies were aligned using MUSCLE v3.8.31. Alignments were manually inspected to remove non-orthologous proteins (false positive detection with BUSCO). Subsequently, they were trimmed with Gblocks v0.91b using more relaxed parameters than default (−b4=5 −b3=4). Remaining trimmed sequences were concatenated. Because the selected 160 proteins were not present in all genomes, missing sequences were replaced by gaps (‘-', character). Thus, the effective number of sequences used to infer phylogeny was often much lower than 160 (Chrysophyte H2: 51; MAST-4D: 72; MAST-3F: 73; MAST-3A: 88; MAST-4C: 90; MAST-4A1: 113; Chrysophyte H1: 113; MAST-4E: 115; MAST-4A2: 115). Phylogeny was inferred using RAxML v8.2.9 under the GAMMA model of het-erogeneity in evolutionary rates among sites and using the JTT substitution model. Branch support was evaluated using 100 bootstrap pseudoreplicates.
CAZyme analysis. Using BLASTp42, each encoded protein model was compared to the proteins listed in the CAZy database24(http://www.cazy.org/). Proteins with >50% identity over the entire domain length of an entry in CAZy were directly assigned to the same family, whereas proteins with 15–50% identity to a protein in CAZy were all manually inspected, aligned, and searched for conserved features, such as catalytic residues. Functional prediction was performed by BLASTp comparison of the candidate CAZymes against a library constructed with only the biochemically characterized CAZymes reported in the CAZy database under the ‘characterized’ tab of each family43.
HGT detection. The presence of putative HGT events was determined using two methods. First, in the AI method40, the‘inlier’ gene dataset was used to query nr-prot (April 2014 version), and the BLASTx search output was used to calculate the AI. Additionally, a second step was also added to the AI method because the AI calculation is made using thefirst best hit from eukaryotes and prokaryotes: If a gene is wrongly assigned as prokaryotic, it would be erroneously considered an HGT event (false positive). Alternatively, if a closely related organism with a common HGT event is present in the database used for the BLAST search, a gene could be excluded from the putative HGT list (false negative). Consequently, the first 1000 hits were retrieved, taxonomically assigned, and classified in eukaryotic and prokaryotic classes. We considered genes with an AI> 45, predicted internally on a scaffold with more thanfive predicted genes as putative HGTs.
To validate these putative HGTs, we constructed a phylogenetic tree of the predicted protein and its 200 best BLASTp matches (Supplementary Data4), but only allowing a maximum of three matches from the same genus to extend the sampled diversity. If less than 10 eukaryotic sequences were present in the 200 best BLAST matches, we included the 10 closest eukaryotic matches of all BLAST matches (8000 max). Sequences were aligned using MUSCLE 3.8.31 and non-conserved positions were discarded using GBlocks 0.91b with relaxed parameters (−b3=10 −b4=5 −b5=h). Phylogeny was inferred using RAxML 8.2.9 with JTT model and gamma model of rate heterogeneity (−m PROTGAMMAJTTX parameter). We considered the tree to support the horizontal transfer hypothesis if the investigated gene did not cluster with other eukaryotic sequences (bootstrap value>50). In the other case, the putative HGT was eliminated and considered as a False Positive of the alien index method.
Annotation of bacterial enzymatic activities in HGT. A functional classification of HGTs was obtained using Intepro and Pfam motifs, and functional categories were determined using COG. The HGT protein sequences were used for protein-versus-protein alignments, using the BL2 option (BLAST allowing gaps) and a BLOSUM62 score matrix against UniProtKB. Those that had>30% identity over at least 80% of the length of the smaller of two compared sequences were kept. The best hit for each HGT was then selected. For each best hit, Interpro and Pfam classification identifiers were retrieved using the UniProtKB interface. Each HGT protein was then manually assigned to one functional category (cellular process and signaling, information storage and processing, metabolism, or poorly char-acterized) using their best hit functional annotation and signatures.
Biogeography inlier/outlier detection. The measurement of an organism’s rela-tive abundance from short-read metagenomic information is very difficult, because some genes may be highly homologous to orthologous genes from others organ-isms and attract cross-mapping metagenomic reads. Here, we present a statistical approach to discriminate genes with atypical mapping behavior. This analysis relies on the assumption that the values of the metagenomic RPKM (number of mapped
reads per gene (intron plus exon) per kb per million of mapped reads) per gene follow a normal distribution. The presence of genes with mapping values distant from the majority of genes could have numerous causes, such as (i) presence of a scaffold coming from another organism, (ii) cross mapping, or (iii) genes with a high copy number. Outlier presence was determined using the Grubb’s test. The test was conducted for a station if at least 20% of the organism’s genes were detected. A gene was considered detected if at least one read mapped with 95% identity on 100% of the read length. The outlier lists for each station were merged to provide the outlier gene list. This detection allowed clear discernment of genes usable for relative abundance measurement (the inlier dataset) from unusable genes with noisy or random signal (the outlier dataset). Organism abundance measure-ments across stations is highly dependent on thisfilter (Supplementary Fig.9a, b, f, and g), necessary for this type of analysis. However, the abundance measured in one station resulted from the combination of inlier and outlier genes (as in station 89 and 85 at surface, Supplementary Fig.9c). The high number of stations sampled during the Tara Oceans expedition allowed us to show that outlier genes were detected in a large number of stations, which is expected for non-specific signals (Supplementary Fig.9d, e).
Biogeographic distributions. Genes detected as outliers were removed from the biogeographic analysis. The relative abundance of an organism was measured as the sum of the number of mapped reads per gene divided by the total number of reads sequenced per station. Because only genes and not intergenic regions were used, a correction factor was applied to the relative abundance values: corrected relative abundance= raw relative abundance × assembly size/(size of the mapped genome × genome completion). The abundance in a geographical area was calcu-lated as the mean of the relative abundance of all stations in the corresponding geographical area (Atlantic Ocean, Mediterranean Sea, Indian Ocean, Southern Ocean, and Pacific Ocean). For the world maps (e.g., Fig.3), and to compare the SAG lineage abundance and reveal common patterns of occurrence, the data were normalized by dividing the relative abundance by the maximal relative abundance per organism. The world maps were generated using the R packages maps_2.1-6, mapproj 1.1-8.3, gplots_2.8.0, and mapplots_1.4.
Correlations to environmental parameters. We tested whether the SAG lineage presence and/or abundance in Tara Oceans samples were correlated with local physico-chemical conditions. We used physico-chemical parameter values obtained from each sampling site during the expedition, which are available in the PAN-GAEA database27. For each parameter, we performed a Kruskal–Wallis one-way test and a post-hoc Tukey’s test. We statistically delineated SAG lineage classes. Only stations for which we detected at least 20% of genes from each composite assembly lineage were considered. MAST-3F was not present at a sufficient number of stations and was therefore excluded from statistical analyses.
Code availability. Computer code used to perform comparative genomics, cal-culate relative abundances and represent biogeographies is available from the corresponding authors upon request.
Data availability. Sequencing data are archived at ENA under the accession number PRJEB6603 for the SAGs (see Supplementary Table5for details) and PRJEB4352 for the metagenomics data (see Supplementary Data3). All other relevant data supporting thefindings of the study are available in this article and its Supplementary Informationfiles, or from the corresponding authors upon request.
Received: 10 May 2017 Accepted: 15 November 2017
References
1. Azam, F. & Malfatti, F. Microbial structuring of marine ecosystems. Nat. Rev. Microbiol. 5, 782–791 (2007).
2. Worden, A. Z. et al. Environmental science. Rethinking the marine carbon cycle: factoring in the multifarious lifestyles of microbes. Science 347, 1257594 (2015).
3. de Vargas, C. et al. Ocean plankton. Eukaryotic plankton diversity in the sunlit ocean. Science 348, 1261605 (2015).
4. Lima-Mendez, G. et al. Ocean plankton. Determinants of community structure in the global plankton interactome. Science 348, 1262073 (2015). 5. Heywood, J. L., Sieracki, M. E., Bellows, W., Poulton, N. J. & Stepanauskas, R.
Capturing diversity of marine heterotrophic protists: one cell at a time. ISME J. 5, 674–684 (2011).
6. Yoon, H. S. et al Single-cell genomics reveals organismal interactions in uncultivated marine protists. Science 332, 714–717 (2011).
7. Martinez-Garcia, M. et al Unveiling in situ interactions between marine protists and bacteria through single cell sequencing. ISME J. 6, 703–707 (2012).
8. Roy, R. S. et al. Single cell genome analysis of an uncultured heterotrophic stramenopile. Sci. Rep. 4, 4780 (2014).
9. Lasken, R. S. Genomic sequencing of uncultured microorganisms from single cells. Nat. Rev. Microbiol. 10, 631–640 (2012).
10. Vannier, T. et al. Survey of the green picoalga Bathycoccus genomes in the global ocean. Sci. Rep. 6, 37900 (2016).
11. Massana, R. et al Phylogenetic and ecological analysis of novel marine stramenopiles. Appl. Environ. Microbiol. 70, 3528–3534 (2004).
12. Massana, R., del Campo, J., Sieracki, M. E., Audic, S. & Logares, R. Exploring the uncultured microeukaryote majority in the oceans: reevaluation of ribogroups within stramenopiles. ISME J. 8, 854–866 (2014).
13. Gomez, F., Moreira, D., Benzerara, K. & Lopez-Garcia, P. Solenicola setigera is thefirst characterized member of the abundant and cosmopolitan uncultured marine stramenopile group MAST-3. Environ. Microbiol. 13, 193–202 (2011). 14. Cavalier-Smith, T. & Scoble, J. M. Phylogeny of Heterokonta: Incisomonas
marina, a uniciliate gliding opalozoan related to Solenicola (Nanomonadea), and evidence that Actinophryida evolved from raphidophytes. Eur. J. Protistol. 49, 328–353 (2013).
15. del Campo, J. & Massana, R. Emerging diversity within chrysophytes, choanoflagellates and bicosoecids based on molecular surveys. Protist 162, 435–448 (2011).
16. Reyes-Prieto, A. & Bhattacharya, D. Phylogeny of nuclear-encoded plastid-targeted proteins supports an early divergence of glaucophytes within Plantae. Mol. Biol. Evol. 24, 2358–2361 (2007).
17. Giering, S. L. et al Reconciliation of the carbon budget in the ocean’s twilight zone. Nature 507, 480–483 (2014).
18. Alberti, A. et al. Viral to metazoan marine plankton nucleotide sequences from the Tara Oceans expedition. Sci. Data 4, 170093 (2017).
19. Carradec, Q. et al. A global ocean atlas of eukaryotic genes. Nature Commun.
https://doi.org/10.1038/s41467-017-02342-1.
20. Mangot, J. F. et al. Accessing the genomic information of unculturable oceanic picoeukaryotes by combining multiple single cells. Sci. Rep. 7, 41498 (2017). 21. Beja, O. et al Bacterial rhodopsin: evidence for a new type of phototrophy in
the sea. Science 289, 1902–1906 (2000).
22. Slamovits, C. H., Okamoto, N., Burri, L., James, E. R. & Keeling, P. J. A bacterial proteorhodopsin proton pump in marine eukaryotes. Nat. Commun. 2, 183 (2011).
23. Marchetti, A. et al Comparative metatranscriptomics identifies molecular bases for the physiological responses of phytoplankton to varying iron availability. Proc. Natl. Acad. Sci. USA 109, E317–E325 (2012).
24. Lombard, V., Golaconda Ramulu, H., Drula, E., Coutinho, P. M. & Henrissat, B. The carbohydrate-active enzymes database (CAZy) in 2013. Nucleic Acids Res. 42, D490–D495 (2014).
25. Massana, R. et al Grazing rates and functional diversity of uncultured heterotrophicflagellates. ISME J. 3, 588–596 (2009).
26. Galperin, M. Y., Makarova, K. S., Wolf, Y. I. & Koonin, E. V. Expanded microbial genome coverage and improved protein family annotation in the COG database. Nucleic Acids Res. 43, D261–D269 (2015).
27. Pesant, S. et al. Open science resources for the discovery and analysis of Tara Oceans data. Sci. Data 2, 150023 (2015).
28. Tara Oceans Consortium, C., Tara Oceans Expedition, Participants. Methodological context of all samples from the Tara Oceans Expedition (2009–2013). (2015).
29. Brown, M. V. et al. Global biogeography of SAR11 marine bacteria. Mol. Syst. Biol. 8, 595 (2012).
30. Martiny, A. C., Tai, A. P., Veneziano, D., Primeau, F. & Chisholm, S. W. Taxonomic resolution, ecotypes and the biogeography of Prochlorococcus. Environ. Microbiol. 11, 823–832 (2009).
31. Swan, B. K. et al Prevalent genome streamlining and latitudinal divergence of planktonic bacteria in the surface ocean. Proc. Natl. Acad. Sci. USA 110, 11463–11468 (2013).
32. Guidi, L. et al Plankton networks driving carbon export in the oligotrophic ocean. Nature 532, 465–470 (2016).
33. Karsenti, E. et al. A holistic approach to marine eco-systems biology. PLoS Biol. 9, e1001177 (2011).
34. Swan, B. K. et al Potential for chemolithoautotrophy among ubiquitous bacteria lineages in the dark ocean. Science 333, 1296–1300 (2011). 35. Chitsaz, H. et al Efficient de novo assembly of single-cell bacterial genomes
from short-read data sets. Nat. Biotechnol. 29, 915–921 (2011). 36. Bankevich, A. et al SPAdes: a new genome assembly algorithm and its
applications to single-cell sequencing. J. Comput. Biol. 19, 455–477 (2012). 37. Boetzer, M., Henkel, C. V., Jansen, H. J., Butler, D. & Pirovano, W. Scaffolding
pre-assembled contigs using SSPACE. Bioinformatics 27, 578–579 (2011). 38. Luo, R. et al. SOAPdenovo2: an empirically improved memory-efficient
short-read de novo assembler. GigaScience 1, 18 (2012).
39. Simao, F. A., Waterhouse, R. M., Ioannidis, P., Kriventseva, E. V. & Zdobnov, E. M. BUSCO: assessing genome assembly and annotation completeness with single-copy orthologs. Bioinformatics 31, 3210–3212 (2015).
40. Gladyshev, E. A., Meselson, M. & Arkhipova, I. R. Massive horizontal gene transfer in bdelloid rotifers. Science 320, 1210–1213 (2008).
41. Langmead, B. & Salzberg, S. L. Fast gapped-read alignment with Bowtie 2. Nat. Methods 9, 357–359 (2012).
42. Altschul, S. F., Gish, W., Miller, W., Myers, E. W. & Lipman, D. J. Basic local alignment search tool. J. Mol. Biol. 215, 403–410 (1990).
43. Cantarel, B. L. et al The Carbohydrate-Active EnZymes database (CAZy): an expert resource for Glycogenomics. Nucleic Acids Res. 37, D233–D238 (2009). 44. Derelle, R., Lopez-Garcia, P., Timpano, H. & Moreira, D. A phylogenomic
framework to study the diversity and evolution of Stramenopiles (=Heterokonts). Mol. Biol. Evol. 33, 2890–2898 (2016).
Acknowledgements
We thank the commitment of the following people and sponsors who made this singular expedition possible: CNRS (in particular Groupement de Recherche GDR3280), Eur-opean Molecular Biology Laboratory (EMBL), Genoscope/CEA, the French Governe-ment‘Investissement d’Avenir’ programs Oceanomics (ANR-11-BTBR-0008), FRANCE GENOMIQUE (ANR-10-INBS-09), MEMO LIFE (ANR-10-LABX-54), PSL* Research University (ANR-11-IDEX-0001-02), Fund for Scientific Research—Flanders, VIB, Sta-zione Zoologica Anton Dohrn, UNIMIB, ANR (projects ‘PHYTBACK/ANR-2010-1709-01’, POSEIDON/ANR-09-BLAN-0348, PROMETHEUS/ANR-09-PCS-GENM-217, TARA-GIRUS/ANR-09-PCS-GENM-218), EU FP7 (MicroB3/No. 287589, IHMS/ HEALTH-F4-2010-261376), ERC Advanced Grant Award to CB (Diatomite: 294823), US NSF grant DEB-1031049 to M.E.S. and R.S., FWO, BIO5, Biosphere 2, agnès b., the Veolia Environment Foundation, Region Bretagne, World Courier, Illumina, Cap L’Orient, the EDF Foundation EDF Diversiterre, FRB, the Prince Albert II de Monaco Foundation, Etienne Bourgois, the Tara schooner and its captain and crew. Tara Oceans would not exist without continuous support from 23 institutes (http://oceans. taraexpeditions.org). We also acknowledge C. Scarpelli for support in high-performance computing. This article is contribution number 63 of Tara Oceans.
Author contributions
R.M., O.J., M.Si., C.d.V., and P.W. designed the study. P.W. wrote the paper with sub-stantial input from S.M., Y.S., Q.C., V.d.B., E.K., C.B., D.I., R.S., R.M., B.H., O.J., M.S., S. Su., C.d.V., P.H. and M.B.S. C.D., M.P., S.K.L., S.Se., and S.P. collected and managed Tara Oceans samples. J.P. and K.L. coordinated the genomic sequencing. N.P., R.S., and M.S. conducted SAG generation and identification. S.M., Y.S., Q.C., E.P., M.W., J.L., V.L., J.F. M., R.L., V.d.B., M.Sa., R.M., J.M.A., B.H., and O.J. analyzed the genomic data. D.I. analyzed oceanographic data. Tara Oceans Coordinators provided a creative environ-ment and constructive criticism throughout the study. All authors discussed the results and commented on the manuscript.
Additional information
Supplementary Informationaccompanies this paper at https://doi.org/10.1038/s41467-017-02235-3.
Competing interests:The authors declare no competingfinancial interests. Reprints and permissioninformation is available online athttp://npg.nature.com/ reprintsandpermissions/
Publisher's note:Springer Nature remains neutral with regard to jurisdictional claims in published maps and institutional affiliations.
Open Access This article is licensed under a Creative Commons Attribution 4.0 International License, which permits use, sharing, adaptation, distribution and reproduction in any medium or format, as long as you give appropriate credit to the original author(s) and the source, provide a link to the Creative Commons license, and indicate if changes were made. The images or other third party material in this article are included in the article’s Creative Commons license, unless indicated otherwise in a credit line to the material. If material is not included in the article’s Creative Commons license and your intended use is not permitted by statutory regulation or exceeds the permitted use, you will need to obtain permission directly from the copyright holder. To view a copy of this license, visithttp://creativecommons.org/ licenses/by/4.0/.
© The Author(s) 2018
Yoann Seeleuthner
1,2,3, Samuel Mondy
1,2,3, Vincent Lombard
4,5,6, Quentin Carradec
1,2,3, Eric Pelletier
1,2,3,
Marc Wessner
1,2,3, Jade Leconte
1,2,3, Jean-François Mangot
7, Julie Poulain
1, Karine Labadie
1, Ramiro Logares
7,
Shinichi Sunagawa
8,9, Véronique de Berardinis
1,2,3, Marcel Salanoubat
1,2,3, Céline Dimier
10,11,12,
Stefanie Kandels-Lewis
8,13, Marc Picheral
14, Sarah Searson
15, Tara Oceans Coordinators, Stephane Pesant
16,17,
Nicole Poulton
18, Ramunas Stepanauskas
18, Peer Bork
8, Chris Bowler
12, Pascal Hingamp
19,
Matthew B. Sullivan
20, Daniele Iudicone
21, Ramon Massana
7, Jean-Marc Aury
1, Bernard Henrissat
4,5,6,22,
Eric Karsenti
12,15,16, Olivier Jaillon
1,2,3, Mike Sieracki
23, Colomban de Vargas
10,11& Patrick Wincker
1,2,31CEA - Institut de biologie François Jacob, GENOSCOPE, 2 rue Gaston Crémieux, 91057 Evry, France.2CNRS, UMR 8030, CP5706 Evry, France. 3Université d’Evry, UMR 8030, CP5706 Evry, France.4Centre National de la Recherche Scientifique, UMR 7257, F-13288 Marseille, France.5
Aix-Marseille Université, UMR 7257, F-13288 Aix-Marseille, France.6INRA, USC 1408 AFMB, F-13288 Marseille, France.7Department of Marine Biology and Oceanography, Institut de Ciències del Mar (CSIC), E-08003 Barcelona, Catalonia, Spain.8Structural and Computational Biology, European Molecular Biology Laboratory, Meyerhofstraße 1, 69117 Heidelberg, Germany.9Institute of Microbiology, Department of Biology, ETH Zurich, Vladimir-Prelog-Weg 4, 8093 Zürich, Switzerland.10CNRS, UMR 7144, Station Biologique de Roscoff, Place Georges Teissier, 29680 Roscoff, France.11Sorbonne Universités, UPMC Univ Paris 06, UMR 7144, Station Biologique de Roscoff, Place Georges Teissier, 29680 Roscoff, France.
12Ecole Normale Supérieure, PSL Research University, Institut de Biologie de l’Ecole Normale Supérieure (IBENS), CNRS UMR 8197, INSERM U1024,
46 rue d’Ulm, F-75005 Paris, France.13Directors’ Research European Molecular Biology Laboratory, Meyerhofstraße 1, 69117 Heidelberg, Germany. 14Sorbonne Universités, UPMC Université Paris 06, CNRS, Laboratoire d’océanographie de Villefranche (LOV), Observatoire Océanologique, 06230
Villefranche sur Mer, France.15Department of Oceanography, University of Hawaii, 96815 Honolulu, Hawaii, USA.16PANGAEA, Data Publisher for
Earth and Environmental Science, University of Bremen, 28359 Bremen, Germany.17MARUM, Center for Marine Environmental Sciences, University
of Bremen, 28359 Bremen, Germany.18Bigelow Laboratory for Ocean Sciences, East Boothbay, ME 04544, USA.19Aix Marseille Univ, Université de
Toulon, CNRS, IRD, MIO UM 110, 13288 Marseille, France.20Departments of Microbiology and Civil, Environmental and Geodetic Engineering, Ohio
State University, Columbus, OH 43210, USA.21Stazione Zoologica Anton Dohrn, Villa Comunale, 80121 Naples, Italy.22Department of Biological Sciences, King Abdulaziz University, Jeddah, 21589, Saudi Arabia.23National Science Foundation, Arlington, VA 22230, USA. Yoann Seeleuthner and Samuel Mondy contributed equally to this work
Tara Oceans Coordinators
Silvia G. Acinas
7, Emmanuel Boss
24, Michael Follows
25, Gabriel Gorsky
16, Nigel Grimsley
26,27, Lee Karp-Boss
24,
Uros Krzic
28, Fabrice Not
11, Hiroyuki Ogata
29, Jeroen Raes
30,31,32, Emmanuel G. Reynaud
33, Christian Sardet
16,34,
Sabrina Speich
35,36, Lars Stemmann
16, Didier Velayoudon
37& Jean Weissenbach
1,2,324School of Marine Sciences, University of Maine, Orono, Maine, 04469, USA.25Department of Earth, Atmospheric and Planetary Sciences,
Massachusetts Institute of Technology, Cambridge, MA 02139, USA.26CNRS UMR 7232, BIOM, Avenue du Fontaulé, 66650 Banyuls-sur-Mer, France.27Sorbonne Universités, Paris 06, OOB UPMC, Avenue du Fontaulé, 66650 Banyuls-sur-Mer, France.28Cell Biology and Biophysics, European Molecular Biology Laboratory, Meyerhofstrasse 1, 69117 Heidelberg, Germany.29Institute for Chemical Research, Kyoto University, Gokasho, Uji, Kyoto 611-001, Japan.30Department of Microbiology and Immunology, Rega Institute, KU Leuven, Herestraat 49, 3000 Leuven, Belgium.31Center for the Biology of Disease, VIB, Herestraat 49, 3000 Leuven, Belgium.32Department of Applied Biological Sciences, Vrije Universiteit Brussel, Pleinlaan 2, 1050 Brussels, Belgium.33Earth Institute, University College Dublin, Dublin 4, Ireland.34CNRS, UMR 7009 Biodev, Observatoire Océanologique, F-06230 Villefranche-sur-mer, France.35Department of Geosciences, Laboratoire de Météorologie Dynamique (LMD), Ecole Normale Supérieure, 24 rue Lhomond, 75231 Paris Cedex 05, France.36Laboratoire de Physique des Océans, UBO-IUEM, Place Copernic, 29820 Plouzané, France.37DVIP Consulting, 92310 Sèvres, France