New insights on coral mound development from groundtruthed
high-resolution ROV-mounted multibeam imaging
Aaron Lim
a,⁎, Veerle A.I. Huvenne
b, Agostina Vertino
c,d, Silvia Spezzaferri
e, Andrew J. Wheeler
a,f aSchool of Biological, Earth and Environmental Sciences, University College Cork, IrelandbMarine Geoscience, National Oceanography Centre, University of Southampton Waterfront Campus, European Way, Southampton SO14 3ZH, UK cGhent University, Department of Geology, Renard Centre of Marine Geology, Krijgslaan 281 S8, B-9000 Gent, Belgium
dUniversity of Milano-Bicocca, Department of Earth and Environmental Sciences, Piazza della Scienza 4, 20126 Milano, Italy eUniversity of Fribourg, Department of Geosciences, Chemin du Musée, CH-1700 Fribourg, Switzerland
fIrish Centre for Research in Applied Geosciences, University College Cork, Ireland
A R T I C L E I N F O Editor: E Anthony Keywords: Currents Sediments Bedforms
Cold water coral mounds Habitat mapping
A B S T R A C T
Currents play a vital role in sustaining and developing deep water benthic habitats by mobilising food and nutrients to otherwise relatively barren parts of the seabed. Where sediment supply is significant, it can have a major influence on the development and morphology of these habitats. This study examines a segment of the Belgica Mound Province, NE Atlantic to better constrain the processes affecting a small-sized cold water coral (CWC) mound habitat and conversely, the hydrodynamic influence of CWC mounds on their own morphological development and surroundings. Here, we utilise ROV-mounted multibeam, ROV-video data, and sediment samples to investigate current processes, mound morphology, density and development. Detailed mapping shows that the area may have the highest density of coral mounds recorded so far, with three distinct mound types defined based on size, morphology and the presence and degree of distinct scour features. A residual current of 36–40 cm s−1is estimated while large scour features suggest low-frequency, high-magnitude events.
These 3 mound types are i) smaller mounds with no scour; ii) mounds with scour in one to two distinct directions and; iii) larger mounds with mound encircling scour. The differing mound types likely had a staggered initiation where younger mounds preferentially developed near clusters of pre-existing mounds. Given the high density of these small CWC mounds, we support the hypothesis that over time, this clustering may eventually lead to these mounds coalescing into larger coral mound features.
1. Introduction
Frame-building cold water corals (CWC) are sessile, filter-feeding organisms that can produce large three dimensional calcium carbonate skeletons and develop complex bioconstructions (Freiwald and Wilson, 1998; Zibrowius, 1980). Some species, such as Lophelia pertusa and Madrepora oculata, occur worldwide and have the ability to exist in a range of settings, from large submarine canyons to contourite drifts and from the Indian Ocean to the Canadian Arctic (e.g.Davies and Guinotte, 2011;Edinger et al., 2011;Freiwald et al., 2004;Hargrave et al., 2004; Huvenne et al., 2011; Roberts et al., 2009; van Rooij et al., 2003). Frame-building CWC are typically found where a supply of food is concentrated and transported to the corals via enhanced currents (Davies et al., 2009). The three dimensional framework developed by the coral skeleton creates frictional drag, slowing the current causing the deposition of suspended particles (Wheeler et al., 2005). Continued
deposition of sediments coupled with growth of CWC generates positive topographic features on the seabed called CWC mounds (De Mol et al., 2007;Victorero et al., 2016;Wheeler et al., 2008).
CWC mounds can range in height above the surrounding seabed from 10 m to 350 m (Henriet et al., 2014;Huvenne et al., 2005). Al-though development of CWC mounds tends to be episodic, dating of sediment cores from CWC mounds shows that mound growth can be as high as 120 cm ka−1 offshore Scotland (Douarin et al., 2013), 220 cm ka−1offshore Ireland and between 600 and 1500 cm ka−1 off-shore Norway (Wienberg and Titschack, 2017and references therein). The current interglacial, the Holocene, has been particularly well-stu-died in terms of periods of CWC mound development (Frank et al., 2009; Wienberg and Titschack, 2017). During this period, the mor-phology of coral mounds is a result of the processes (e.g. currents) that have influenced them through their development (Huvenne et al., 2009a; Thierens et al., 2010; Wheeler et al., 2007; Wheeler et al.,
⁎Corresponding author.
E-mail address:[email protected](A. Lim).
http://doc.rero.ch
Published in "Marine Geology 403(): 225–237, 2018"
which should be cited to refer to this work.
2005). Early research showed that currents were among the main dri-vers for faunal distribution across coral mounds (Messing et al., 1990). More recently, direct measurements from current meters show that currents vary in velocity and regime across a coral mound and are likely to be the main control on coral distribution and therefore mound growth (Dorschel et al., 2007). The influence of currents on mound development and morphology can also be seen across a number of small coral mounds where they elongate with prevailing current direction and become larger with increasing current velocity (Lim, 2017; Wheeler et al., 2008). Observations show that clusters of mounds de-velop an elongate pattern, corresponding to the direction of the highest currents speeds (Mienis et al., 2007). As such, CWCs are known to occur where currents are particularly high (Mohn et al., 2014). In support of this, long term measurements at coral mounds in the Rockall Trough, NE Atlantic show that low currents are one of the factors that limit coral growth on mound structures (Mienis et al., 2012).
More recently,Cyr et al. (2016)show that mound size has a direct influence on local hydrodynamics where larger mounds have a greater influence on hydrodynamics than smaller mounds. The same authors go on to show that CWC mounds create hydrodynamic turbulence, fa-vourable for coral growth, and suggest that at a certain sizeflow can become blocked, detrimental to vertical growth of the mound.
Despite many studies carried out so far, the influence of environ-mental factors on mound density, morphology and size (and vice versa) is still poorly understood. This work focuses on the Moira Mounds re-gion, a key study area characterised by densely-packed CWC mounds and well-defined, current-generated bedforms. It aims to better under-stand (1) the interactions between currents and CWC mound mor-phology and size and (2) the mechanisms that regulate coral mound development and coalescence.
1.1. Regional setting
The Belgica Mound Province (BMP) is located on the eastern margin of the Porcupine Seabight: a large north-south embayment on the Irish continental margin, NE Atlantic (seeFig. 1) (Beyer et al., 2003;van Rooij et al., 2003). Part of the BMP exists within a Special Area of Conservation (SAC) designated under the EU Habitats Directive (https://www.npws.ie/). The main modern-day Porcupine Seabight water mass, which affects coral mound growth, is the Mediterranean Outflow Water (MOW) (De Mol et al., 2005;Rice et al., 1991;White et al., 2005) characterised by a salinity maximum between 600 m and 1100 m water depth. At this depth, temperatures are approximately 10 °C with relatively high residual current speeds (White and Dorschel, 2010).
The BMP is known for its abundance of coral mounds (Wheeler et al., 2005). Large coral mounds occur in 2 distinct chains oriented parallel to the continental shelf (Fig. 1); the eastern chain is largely moribund (with a mainly dead coral cover;Foubert et al., 2005) while the western chain is mostly active with a profusion of live coral (De Mol et al., 2007;Dorschel et al., 2007;Eisele et al., 2008). These large coral mound morphologies range from conical to elongate, ridge-like forms and are typically 1 km across and 100 m tall (Beyer et al., 2003; Wheeler et al., 2005). Contourite drifts have accumulated between the giant (~100 m in height) carbonate mounds and buried their upslope flanks (van Rooij et al., 2003). Smaller CWC reefs, typically 30 m across and 10 m tall, are found throughout the BMP and are referred to as the “Moira Mounds” (Foubert et al., 2005; Kozachenko, 2005; Wheeler et al., 2005; Wheeler et al., 2011). These are divided into 4 zones (Fig. 1) based on their geographic distribution: upslope area, down-slope area, mid-down-slope area and northern area (seeWheeler et al., 2011). The Moira Mounds in the northern and upslope areas are dormant (Wheeler et al., 2011) while the Moira Mounds in the mid-slope area have been described as “sediment stressed”, where they are being smothered by sediments (Foubert et al., 2011). A blind channel, re-ferred to as“Arwen Channel” (Fig. 1) (Murphy and Wheeler, 2017;Van
Rooij, 2004), formerly connected to the shelf break, runs through the province and now contains the westernmost Moira Mounds studied here (referred from here on as downslope Moira Mounds).
Wheeler et al. (2011)hypothesise that the Moira Mounds may re-present an early-stage “start-up” phase of the nearby, large Belgica coral mounds, noting that the“footprints” of clusters of Moira Mounds have a comparable size to the base of the giant cold-water coral mounds which, as such, may have formed through a coalescing of smaller coral mounds at early stages of their development (see alsoDe Mol et al., 2005;Huvenne et al., 2005).
2. Materials and methods
2.1. ROV-mounted high-resolution multibeam echosounder
ROV-mounted multibeam echosounder (MBES) data were collected over the downslope Moira Mounds area during the QuERCi survey (2015) on board RV Celtic Explorer with the Holland 1 ROV (cruise number CE15009:Wheeler et al. (2015)). A high-resolution, dual-head Kongsberg EM2040 MBES was integrated with a sound velocity probe and mounted on the front-bottom of the ROV. Data were acquired at a frequency of 300 kHz while the ROV maintained a height of approx. 150 m above the seabed with a survey speed of approximately 2 knots. This achieved a swath width of approx. 400 m. Positioning and attitude were obtained using a Kongsberg HAINS inertial navigation system, ultra-short baseline (USBL) system (Sonardyne Ranger 2) and doppler velocity log (DVL). Data acquisition was carried out using SIS software, where calibration values, sensor offsets, real-time sound velocity, na-vigation and attitude values were incorporated. Seven lines ranging from 850 m to 4.2 km long were collected over the downslope Moira Mound study site. It is worth noting that, although rare, the DVL mis-triggered during data acquisition, affecting limited stretches of the raw navigation data. The MBES data were stored as *.all and *.wcdfiles and were processed using CARIS HIPS and SIPS v9.0.14 to apply tidal cor-rections and clean anomalous data spikes. The cleaned data were saved as a single *.xyz and gridded to a 0.5 m ArcView GRID.
The 0.5 m MBES grid was imported into ArcMap 10.4 and projected in UTM Zone 29 N. Slope (degrees) and aspect were derived from the bathymetry using the Arc Toolbox Spatial Analyst tools.
The raw multibeam backscatter data were processed using the Geocoder algorithm in IVS Fledermaus. This algorithm removes all the gains used during acquisition and applies a series of radiometric and geometrical corrections to the original acoustic observations in order to obtain a correct value of backscatter strength (Fonseca et al., 2009). The processedfile was saved as a geotiff. Throughout this manuscript, references to backscatter refer to relative backscatter strength.
2.2. Seabed morphometric analyses and mound density
To characterise the study area, distinguish between mound types and associated bedforms, morphometric analyses were carried out. Bathymetric grids, backscatter and slope of study area were plotted in ArcMap 10.4. Using a combination of these datasets, three main geo-morphological features were identified: positive mound features, ne-gative scour features and positive ridge-form features. Each individual feature was delineated manually within ArcMap and saved as a polygon *.shpfiles. The mound and scour polygons were used to extract the pixel values from the bathymetric (depth), backscatter (backscatter strength) and slope (slope angle) rasters. Individual mound height and scour depth were calculated by subtracting the minimum bathymetric value from the maximum bathymetric value within each of these mound and scour polygons using the Extract by Attributes tool. Similarly, mound and scour polygon area, average backscatter, minimum slope, maximum slope and average slope were calculated using the same tool and added to the polygon attribute table.
Mound volumes were calculated by:
= ∗
V (A H)/3 (1)
where V is volume, A is area of base and H is height. This calculation assumes that the mound is conical with an elliptic base. Calculated mound volumes were added to the attribute table of the mound polygon.
The scour features were individually inspected, which resulted in a manual classification of the mounds into three distinct types; a) mounds with one or two scour directions, b) mounds with scour that encircles part or all of the mounds and c) mounds without scour. This scour classification was added to the mound polygon attribute table.
Using the kernel density tool in ArcMap Toolbox, a mound density distribution raster layer was created. This calculated the density of the mound point features at each output raster cell neighbourhood (460 m) and shows the number of mounds per square kilometre across the study site. This was carried out for all the mounds within the area and se-parately for mounds with one to two distinct scours and mounds with encircling scour.
2.3. ROV-mounted video
In this study, ROV video data are used to groundtruth bathymetry and qualitatively assess mounds, scours and sediment types. ROV-video data were collected over downslope Moira Mounds during the VENTuRE survey (2011) (cruise number CE11009:Wheeler and ship-board party (2011)) and QuERCi survey (2015) (cruise number CE15009:Wheeler et al. (2015)) on board RV Celtic Explorer with the Holland 1 ROV (Fig. 2a). Video data were recorded using an array of HD and colour composite cameras including aft-facing, forward-facing and downward-facing cameras mounted on the HOLLAND 1 ROV. The ROV video survey speed was typically 0.3–0.4 kt. Positioning and na-vigation were achieved using a USBL (Sonardyne Ranger 2) and 1200 kHz RDI Workhouse DVL. The ROV altimeter recorded and logged
the height of the ROV from the seabed. Parallel lasers set at 11 cm apart were used to scale video imagery. The ROV's forward-facing (naviga-tion) sonar guided the ROV over the summit of each mound feature.
2.4. Sediment sampling
Seven box cores from the downslope Moira Mounds are used in this study to estimate current velocities (Fig. 1b). They were collected using a NIOZ-type box corer during the Eurofleets Moira Mounds survey (2012) on board RV Belgica (Cruise Number 2012/16) in 980–1100 m of water, with pre-calibrated Global Acoustic Positioning System (GAPS) Ultra Short Base Line (USBL) navigation to an accuracy of 0.5% of the slant range. Sub-cores were taken from each retrieved box core, and were stored at 4 °C.
For this study, only surface sediment samples from the box cores were used. The carbonate and organic component of the surface sedi-ment was removed using 10% HCl and 10% H202. Details of this
car-bonate and organic dissolution procedure can be found inPirlet et al. (2011).
A 0.05% of sodium tetraphosphate solution was added to the re-maining (lithic) component of the samples. The samples were shaken by hand and then sonicated for approximately 12 s to minimize floccula-tion of particles. Before particle-size analysis (PSA), the samples were mixed to ensure accurate representation of each sample. Laser granu-lometry was carried out at the Applied Geology Lab, University of Milano-Bicocca using a Malvern Mastersizer 2000. Each sample was added to the Malvern Mastersizer 2000 by means of liquid dispersion. Before measurement, ultrasonic waves were passed through the liquid to ensure full deflocculation of particles. Each sample was measured 5 times. The results were then averaged and stored as an excelfile. Files were opened in GRADISTAT (seeBlott and Pye, 2001) where mean grain sizes were automatically calculated using the Folk and Ward method (Folk and Ward, 1957).
Fig. 1. a) Locations of the Moira Mounds (star) and of Darwin Mounds (dot); 1b) TOBI 30 kHz sidescan sonar map (afterHuvenne et al., 2005) of the Moira Mounds area showing the Challenger Mound (green dot), chains of giant coral carbonate mounds (red lines), margins of blind channel (red dashed line), the 4 Moira Mound areas afterWheeler et al. (2011)(yellow dashed lines), the study site (solid yellow box) and locations of box cores used for this study (red dots). (For interpretation of the references to colour in thisfigure legend, the reader is referred to the web version of this article.)
2.5. Current velocity estimation
To understand the hydrodynamic regime around the Moira Mounds, erosional current thresholds were calculated afterSoulsby (1997) (a detailed mathematical explanation can be found in Huvenne et al. (2009b)) to estimate current speeds where box-cores were retrieved. The mean grain size of each of these samples was used to estimate the critical current velocity 1 m above the seabed that would be required to allow grains to be transported in the water column. Grain sizes smaller than 10μm were excluded from critical current velocity calculations as these are subject toflocculation (McCave et al., 1995).
Soulsby (1997)defines the formula to calculate the critical current velocity erosional threshold from particle size distributions as:
⎜ ⎟ = ⎛ ⎝ ∗ ⎞⎠ ⎛⎝ ⎞⎠ z z 0.41 ln , where erosion cr 100 100 0 U U (2) =
z100 level above seabed (1m) (2.1)
= = ⎛
⎝ ⎞⎠
z roughness length, calculated d 12
0
(2.2)
= =
d grain diameter mean of sample grain size curve (2.2.1)
= = ∗ =
u τ
ρ
critical shear velocity , where
cr U cr cr
(2.3)
= =
τcr threshold bed shear stress (N/m )2 (2.3.1)
− ⎛ ⎝ + ∗ + − − ∗ ⎞⎠ g ρ ρ d D D ( ) . 0.30 1 1.2 0.055[1 exp( 0.020 )] s (2.3.1) = = ρ water density 1027.4 kg/m3 (2.3.2) = =
ρs grain density 2650 kg/m (quartz)3 (2.3.3)
= = ⎡ ⎣⎢ − ⎤ ⎦⎥ = ∗ D g ρ ρ ρv d v
dimensionless grain size ( ) kinematic viscosity of water
s
2
1 3
(2.3.4) The use of this approach assumes that particle size reflects the benthic current regime. For our area of study where currents are strong, and sediment ripples are common, testifying to extensive bedload se-diment transport and sese-diment reworking, this assumption appears valid.
In a second current estimation in support of the current strength calculations above, current velocity estimation is applied via use of a bedform velocity matrix (seeStow et al., 2009). This utilises mean grain size and bedform type to estimate current velocity, which can be read directly from a graph therein.
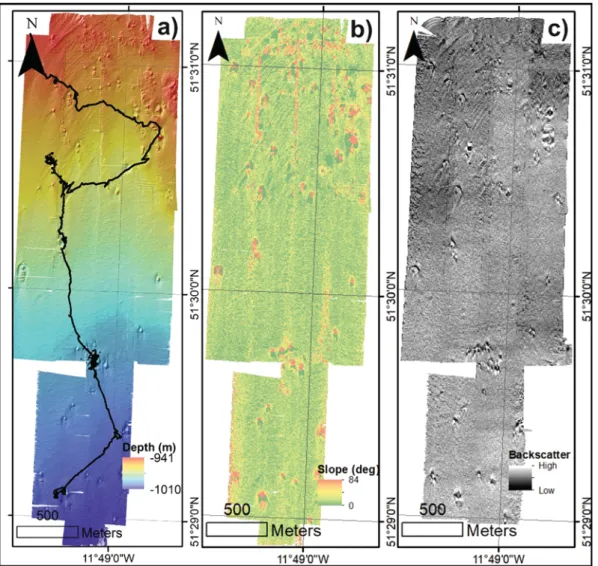
Fig. 2. a) Multibeam echosounder bathymetric coverage with the ROV video groundtruthing line shown in black; 2b) seabed slope within the study area (degrees); 2c) multibeam echosounder backscatter (high backscatter in lighter tones, lower in darker tones).
3. Results
3.1. Bathymetry, slope and acoustic backscatter
An area of 4.6 km2was imaged with the multibeam echosounder.
The bathymetric coverage reveals a relativelyflat seabed with mega-ripples punctuated by 106 distinct mound-like features (the Moira Mounds) with associated scour pits and ridges throughout the down-slope Moira Mound study site. The bathymetric map (Fig. 2a) shows the seabed gently sloping from the deeper south to the shallower north (−1010 m to −942 m). The mounds are typically 4.9 m in height on average (a maximum height of 14.8 m) with a slightly elongated conical morphology and relatively low backscatter. Distinct scour features occur around the mound perimeters. These can occur as 1 or 2 smaller linear scours that extend from the mound perimeter or encircle all or part of the mound perimeter. Scour features range from 66 m2 to 9093 m2(1635 m2on average) reaching a scour depth of 3.6 m.
Ridge-like features typically occur to the south of the mounds (Fig. 2) and have an area from 70 m2to 6075 m2reaching a height of up to 3.4 m. They typically occur in groups of 3 to 5, decreasing in size away from the mounds, with an east-west orientated long-axis. Sinuous mega-ripples (sediment waves) exist in the medium backscatter, off-mound area (Fig. 2c). These have a wavelength of approximately 10 m and a wave height of 20 cm to 75 cm, with a steepened, north-facing lee slope. Fig. 2b shows seabed slope angles relative to this data set with green characterising relatively flat seabed slopes whereas red and yellow characterises the steep seabed slopes. Features (mounds, scour, and ridges) are most easily identified on the maps of relative slope (Fig. 2b), acoustic backscatter (Fig. 2c) or bathymetry (Figs. 2a &3). Acoustic backscatter is relatively constant throughout the area (Fig. 2c) with a slightly higher backscatter to the north, reflecting changing seabed properties (grainsize and roughness).
3.2. Geomorphological features and mound density
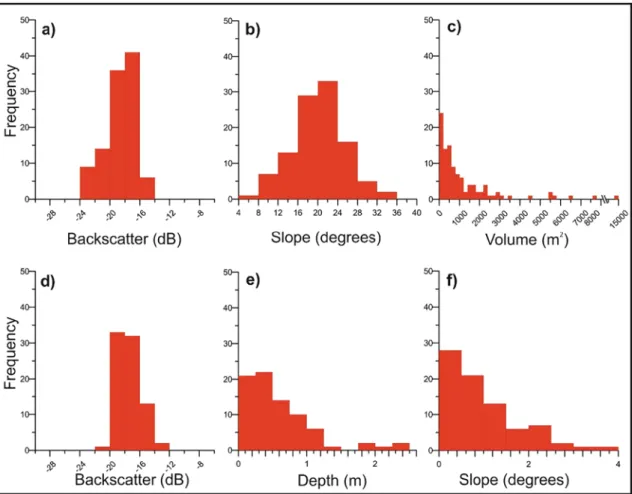
The three geomorphological features identified and measured are positive mounds, negative scours and positive ridge-forms (Fig. 3). Mounds are typically clustered across the study site. Scour and ridge features occur only with mounds. Mounds can occur without scour (Fig. 3a), with poorly-developed scour (Fig. 3b and c) or with well-developed scour (Fig. 3d). Ridge-like features occur within the scour pits (Fig. 3d). As summarised inFig. 4, mound backscatter ranges from −15 dB to −23 dB and scour backscatter ranges from −13 dB to −20 dB. Mound slope ranges from 7 to 32° and scour slope ranges from 0.1 to 9°. Mound volume ranges from 8 to 14,872 m3while scour depth ranges from 0.1 to 3.6 m.
The most obvious morphological distinction between mounds is presence/absence and degree of scour (poorly developed to well-de-veloped). As such, three types of Moira Mounds are defined based on this morphological distinction (Fig. 5).
Type I mounds are defined based on their lack of scour (e.g.Fig. 3a). They are typically the smallest in volume (305 m3 average, 247 m3
median) (Fig. 5), predominantly occurring where other mounds are most dense (Fig. 6b). They are the least common mound type in the study area (22.6%). They have the lowest slope (average 17°) and backscatter (average −19.1 dB) of the three mound types (Fig. 4). Ridge-like features rarely occur with these mounds (only 4 Type I mounds occur with ridges) (Fig. 5c).
Type II mounds are defined based on their poorly-developed scour that has formed along one sector of the mounds base (e.g.Fig. 3b and c). They are moderate in volume (1240 m3average, 748 m3median), more than twice the volume of most Type I mounds. They exist clus-tered throughout the study area (Fig. 6a) and are the most common mound type (50%). The scour that develops around these mounds covers an average area of 1038 m2 with an average depth of 0.5 m.
These mounds have an average slope of 21° and an average backscatter
of−18.5 dB; 45% of these mounds exist with ridges.
Type III mounds have well-developed scour, encircling all or most of the mound base (e.g.Fig. 3d). They are the largest in volume (2064 m3 average, 1532 m3 median), almost double the volume of Type II
mounds. They exist throughout the study area but their highest density is to the immediate south of Type I and Type II mounds. They comprise 27.4% of the mounds in the study area. The scour that develops around these mounds covers an average area of 2766 m2with an average depth
of 0.9 m. These mounds have an average slope of 21° and an average backscatter of −18.8 dB; 66% of these mounds typically exist with ridge-like features within their scour pit (e.g.Fig. 4D).
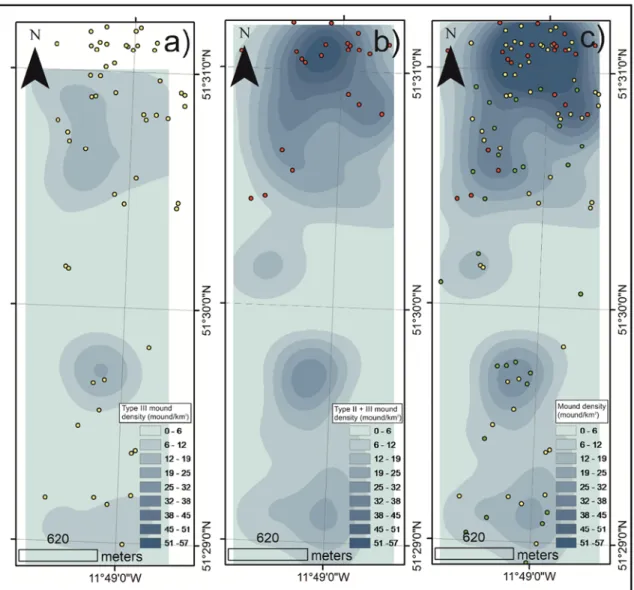
Mounds exist throughout the surveyed study site. However, the highest density of mounds, > 50 mounds/km2, occurs in the largest
cluster at the north of the study area (Fig. 6). The lowest density of mounds (< 10 mounds/km2) typically exists outside these mound clustering areas.
3.3. ROV-mounted video
ROV-mounted video data (Fig. 2a) covers a total transect length of 8.7 km, crossing 17 mounds, scour and ridge-like features. Video ob-servations confirm that the mounds and ridge-like features are covered by coral while the scour pits are not. The mounds are dominated by coral framework: Lophelia pertusa predominantly with Madrepora ocu-lata in places (Fig. 7a, b and c). The coral frameworks are typically 0.5 m to 1 m in height, protruding from the mound surface. Live coral is more common near the mound summit while dead coral frameworks occur mainly near the moundflanks.
The scour pits are sandy with some exposed dropstones and no coral present (Fig. 7d and f). Ridge-like features exist within some scour pits, adjacent to the mounds (Fig. 7d). Coral grows at and near the summit of all observed ridge-like features, here called“coral ridges”, while some coral rubble exists in troughs between ridges.
The off-mound areas are dominated by rippled sands with occa-sional gravel lags and dropstones (Fig. 7e). The asymmetrical ripple crests are sinuous to lingoidal with a steepened north-facing slope in-dicating a northerly-directedflow.
3.4. Current velocity
The average erosional current velocity threshold for transporting the sand in the study area is 36 cm s−1(Table 1). Similarly, a current velocity of 35–40 cm s−1was obtained by using the bedform-velocity
matrix with high-sinuousity megaripples and lingoidal megaripples and a mean grain size of 235μm.
4. Discussion 4.1. Currents
The estimated sediment-derived current velocity of 36 cm s−1and the bedform-derived current velocity of 35–40 cm s−1 are coincident
with each other as well as with direct current velocity measurements close to our study area (34 cm s−1) (Dorschel et al., 2007). The bed-forms observed here (megaripples/sandwaves) form over days to even weeks (Stow et al., 2009) which, coupled with their persistence and common occurrence, suggests they reflect a long-term, net effect of the current in shaping the seabed. As such, the steepened lee slope of these megaripples indicates that the prevailing current is from south to north. Thisflow is typical within the Porcupine Seabight (Pingree and LeCann, 1990;White, 2007).
However, the large scour pits, predominantly developed around the south-facing side of these mounds suggest a north-to-southflow direc-tion. Given the prevailing current is south-to-north, the high energy required to form the scour pits and similarity of our independent cur-rent velocity estimates to nearby direct measurements, it is more likely
that these scour pits are the result of high-magnitude, low-frequency current events. Furthermore, with the occurrence of dense water cas-cades reported previously from the Irish Margin (Hill et al., 1998) and the location of the study site within a south-north blind channel on the shelf break, we suggest that the low-frequency, high-magnitude events that form the scours may be dense water cascadesflowing down the blind channel. Dense water cascades have been noted elsewhere reaching velocities up to 250 cm s−1(Wilber et al., 1993).White et al. (2005)previously put forward the idea of dense water cascades in a CWC habitat in the NE Atlantic.Hill et al. (1998)also suggest that these dense waterflows can be seasonal. Although no definitive explanation can be put forward for the mound encircling nature of some of the scour pits, this could be related to the pit becoming further shaped by the strong residual current or tidal influences in the area.
4.2. Mound morphology
The downslope Moira Mounds show typically developed conical to elongate downstream morphology. The three different morphological
types (I, II and III) we describe require further examination and may reflect evolutionary development stages.
Type I mounds are relatively small, with an average volume of ap-proximately 300 m3 and do not have scour or ridge-like features, whereas the much larger Type III mounds with an average volume of approximately 2000 m3typically have well-developed scour and
ridge-like features. There is a developmental trend of scour and ridge-ridge-like features with increasing mound volume from Type I to Type II through to Type III mounds. Scour pits and ridge-like features are exclusively found in association with the mounds suggesting that a) the scour and ridges form under the influence of the mounds and b) that both features develop progressively with the increasing size of the mounds. A similar process has been observed and modelled around various other marine obstacles such as shipwrecks (Quinn, 2006;Smyth and Quinn, 2014) with the size of the obstacle influencing the hydrodynamic perturbation and, therefore the size of scour and drifts. As such, the mounds have a progressive influence on their local environment as they grow larger. These stages of development and influence are summarised inFig. 8.
Cold-water coral mounds with scoured bases are relatively common,
Fig. 3. a) Bathymetric data showing a small Moira Mound approx. 3 m in height with no scouring, surrounded by a megarippled seabed; b) bathymetric data showing 2 small Moira Mounds with scour developing at 1 sector of the mound perimeter, surrounded by a megarippled seabed; c) bathymetric data showing a moderately-sized Moira Mound where the mound base has been scoured; d) bathymetric data showing a large Moira Mound with well-developed scour encircling the mound base with ridge-like features formed within the scour pit.
Fig. 4. a) Backscatter histogram for the downslope Moira Mounds; b) slope histogram for the downslope Moira Mounds; c) mound volume histogram for the downslope Moira Mounds; d) backscatter histogram for the scour pits; e) depth histogram of the scour pits and; f) slope histogram for the scour pits.
Fig. 5. Box & whiskers plots showing the distribution of the minimum, maximum, 1st quartile, 3rd quartile and mean values of Type I, II and III mounds for a) slope; b) volume; c) bar chart of percentage that occur with ridge-like features; d) scour area; e) scour depth and; f) slope. Outliers symbolised by“+” symbol.
for example in the Straits of Florida (Correa et al., 2012) and the Hedge Mounds, northwest Porcupine Bank, NE Atlantic (Dorschel et al., 2009). Of particular note are the Magellan Mounds which are an order of magnitude larger than the Moira Mounds but have moats that are en-igmatically elongated and in some cases extended around the mounds (Huvenne et al., 2007). However, unlike other coral mounds with scour, coral ridges have developed in the scour pits of the Moira Mounds. This relationship has not been reported elsewhere. Since the ridges exist only within the main depressions of large, well-developed scour pits sur-rounding the mounds (typically Type III mounds), it appears that they develop after the scour formed and are potentially related to hydro-dynamic effects as the mounds increase in size. While increased tur-bulence occurs within the main body of a scour pit around marine obstacles (Quinn and Smyth, 2017), Davies et al. (2009) show that turbulence induced by mound topography may account for enhanced delivery of food particles suspended in deeper waters. The increased turbulence means there can be concentration of suspended material which includes coral larvae can settle and grow given the availability of suitable substrate. In addition, the concentration of coarser materials (e.g. exposed dropstones) in the bottom of the scour may be this sui-table substrate for the coral to settle and grow upon. Moira Mounds further south of the study area have been previously described as
“substrate restricted”, where the environmental conditions and current speeds are favourable but there is a lack of hard substrate (Lim, 2017). In terms of dimension, Type II and III mounds are typical of those described for the Moira Mounds in the mid-slope, up-slope and northern areas (Wheeler et al., 2011). Both of these mound types are large en-ough to be imaged in pre-existing map coverage (mapped using deep-towed 30 kHz TOBI side scan sonar; seeHuvenne et al. (2005)). How-ever, the Type I mounds are too small to be imaged by lower resolution pre-existing map coverage and do notfit previous morphological de-scriptions of the other Moira-type Mounds (Huvenne et al., 2005;Lim et al., 2017;Wheeler et al., 2005;Wheeler et al., 2011). Interestingly, Type I Moira Mounds are similar in dimension (near circular, ~5 m in height) to the nearby Macnas Mounds, which also occur on the eastern flank of the Porcupine Seabight but further up-slope at water depths of 300 to 500 m (Wilson et al., 2007). Like the Type I Moira Mounds, the Macnas Mounds occur within an eastern Porcupine Seabight channel, are notably small, have gentle slopes and appear to be devoid of scour. Although speculative, their similarities and proximity could suggest that the Macnas Mounds and the Type I Moira Mounds may have some similarities in terms of their initiation and development.
Fig. 6. Mound density maps a) Type III mound density raster with Type II mound points overlaid (yellow); b) Type III and type II mound density raster with Type I mound points overlaid (red); c) all mound density raster overlaid by the distribution of all mounds in the study area (yellow = Type II; red = Type I and; green = Type III). Density is expressed as number of mounds per km2over a neighbourhood of 460 m. (For interpretation of the references to colour in thisfigure
legend, the reader is referred to the web version of this article.)
4.3. Mound density
The overall density of the downslope mounds in the study site is 22.9 mounds/km−2(106 mounds in 4.64 km2). The Moira Mounds and
the Darwin Mounds in the northern Rockall Trough, UK waters were thought to be comparable in size and distribution (Huvenne et al., 2016;Huvenne et al., 2009a;Lim, 2017;Wheeler et al., 2011) although in our study area spatial density shows over an order of magnitude in difference. The NE Darwin Mounds have a spatial density of 1.28 mounds/km−2(150 mounds per 117 km2) and the NW Darwin mounds have a spatial density of 1.44 mounds/km−2(75 mounds per 52 km2) (http://jncc.defra.gov.uk). In comparison with other provinces
of small mounds, the Atlantic-Moroccan margin has a low mound
spatial density of 0.43 mounds/km−2 (781 mounds in 1800 km−2) (Vandorpe et al., 2017), the Santa Maria di Leuca (SML) mound pro-vince in the northern Ionian Sea has 9.7 mounds/km−2(5820 mounds in 600 km−2) (Savini et al., 2014), the interfluves between the Dan-geard and Explorer Canyons, NE Atlantic, which also has“minimounds” has 7.2 mounds/km−2 (400 mounds in approx. 55 km−2) (Stewart et al., 2014) and coral mounds in the Straits of Florida on the Great Bahama Bank slope have 14 mounds/km−2, which was subsequently described as a major mound region (Correa et al., 2012). As such, the downslope Moira Mounds may be described as a major and unique coral mound habitat given the high-spatial density of coral mounds of small sizes (~10 m in height), and even potentially the highest recorded density of coral mounds to date. It is worth noting that the coral
Fig. 7. a) Surface of a Moira Mound; b) close up image of large and densely-packed coral colonies, mostly Lophelia pertusa; c) a small (Type I) Moira Mound showing sparse coral colonies; d) coral ridge within a scour pit; e) off-mound sinuously rippled sands; f) scouring around perimeter of mound.
Table 1
showing sediment sample grain size characteristics and erosional velocities afterSoulsby, 1997.
Sample ID BC_23 BC_28 BC_21 BC_33 BC_31 BC_25 BC_26
Mean grain size (μm) 267.8 441.3 215.4 111.8 209.5 225 176
Textural group Muddy sand Sand Sand Muddy sand Sand Sand Sand
Erosional Velocity cm s−1(Soulsby, 1997) 36 39 36 34 36 36 36
mounds compared here vary in size and geographic range and therefore the total number of mounds occurring across the total geographic range of occurrence are compared.
4.4. The influence of mound density on mound development
In terms of distribution, Type III mounds exist throughout the study area (Fig. 6). Assuming Type III mounds developed before Type II mounds, based on their size (approx. twice the volume of Type II mounds;Fig. 8), it appears that Type II mounds occur where Type III mounds are most densely distributed (Fig. 6). Similarly, assuming Type I mounds are younger than Type II and III, it appears that Type I mounds typically occur in the areas of highest mound density, as evi-dent in the northern sector of the studied region (Fig. 6). This mound distribution can be compared with the distribution, at a smaller scale, of CWC isolated colonies and colonial aggregations in relation to dense and large CWC frameworks. Isolated colonies and coral aggregations (up to 2–3 m in extension) are typically observed in the basal part of the flanks of some Mediterranean and North Atlantic mounds (Rosso et al., 2010;Vertino et al., 2010;Wienberg et al., 2008) around larger and
dense CWC frameworks. The initial settlement of coral larvae on sui-table hard substrates generates new colonies that, growing on each other, tend to develop both vertically and laterally forming colonial aggregations. In turn, their neighbouring colonial aggregations can increase in size and, when in contact, merge to create dense and large coral frameworks. Similarly, younger type I mounds seem to occur at the periphery of larger ones supporting the idea of mound coalescence as a mechanism to propagate the development of giant mounds. The mound clusters studied herein have a comparable diameter and elon-gation as the surrounding“giant” Belgica coral mounds (Wheeler et al., 2011).Huvenne et al. (2009b)outline a model which can be applied for clusters of small mounds to grow into large mound bases where a limitation of sedimentation is required to not bury potential substrate, coral growth can keep up with sedimentation and, once they grow develop high enough, they escape continuous burial in the benthic boundary layer. As such, given their notably high spatial density, continued development of Moira Mounds could lead to them coalescing into larger mounds (Beyer et al., 2003;Huvenne et al., 2005;Wheeler et al., 2005).
It is thought that the distribution of the Moira Mounds is related to
Fig. 8. a) Schematic of Type I mound local sedimentary environment where the mounds are 3 m in height, with a relatively gentle slope and no scouring; 8b) schematic of Type II mound local sedimentary environment where the mound has now developed to 6 m in height, poorly developed scour occurs at the base of the mounds and the slope has steepened; 8c) schematic of Type III mound local sedimentary environment where the mound has now developed to 10 m in height, the scour is well-developed, encircling the mound and coral ridges have developed within this scour pit.
pre-existing topographic features and suitable substrates such as cur-rent-aligned furrows and ridges as well as dropstones (Foubert et al., 2011;Kozachenko, 2005;Wheeler et al., 2005). Presumably, larvae of coral colonies have originally settled on these seafloor features gen-erating isolated colonies that, in favourable conditions, have evolved into loosely-packed coral aggregations and then into dense frameworks. The lateral and vertical accretion of a CWC framework is highly in flu-enced by combined biological and sedimentological factors, such as the colony growth rate, the generation of new corals through asexual and sexual reproduction (Brooke and Järnegren, 2013;Dahl et al., 2012;Le Goff-Vitry, 2004;Waller and Tyler, 2005) and the stabilising action of the sediment that accumulates at the coral base (Hebbeln et al., 2016). Though recent studies on CWC larvae have highlighted the longevity and high dispersal potential of Lophelia planulae (Strömberg and Larsson, 2017), it seems that there is a significant retention of coral larvae within natal CWC sites (Le Goff-Vitry, 2004; Morrison et al., 2011;Ross et al., 2017). The preferential coral larval settlement on suitable substrates (such as tissue-barren skeletons of pre-existing co-lonies, coral rubble or other biogenic and lithic surfaces) within natal reefs and/or in the surrounding areas may increase the potential ac-cretion of a single mound and favour the formation of densely packed mound clusters.
The dense mound distribution of the northern sector of the studied area could be linked to favourable environmental conditions that lead coral larvae to preferentially settle in the vicinity of the natal sites. However this observation must be corroborated by genetic studies on coral colonies from the three different mound types. The preferential nucleation of coral mounds in the surroundings of older ones, could also be favoured by the effects generated by mound clustering. As suggested byVandorpe et al. (2017), mound clustering can intensify local bottom currents, thus improving food and sediment supply to mounds. 5. Conclusions
We conclude from estimations that a northerly-directed prevailing current of between 36 and 40 cm s−1 exists at the Moira Mounds, a current similar to direct current measurements obtained nearby. On the other hand, distinct scour features that have developed around the larger Moira Mounds suggest an opposingflow direction and may be the result of sporadic dense water cascades, common on continental slopes and previously observed on the Irish-Atlantic margin. Based on the presence/absence and degree of development of the scours, the downslope Moira Mounds can be classed into three types: Type I (small mounds with no scour); Type II (medium-sized mounds with poorly-developed scour) and; Type III (large mounds with well-poorly-developed scour and coral-ridges). Given their proximity and based on their size, it is likely that these mound types represent different ages where the smallest are the youngest. Ridge-like features occur within the large scour pits of the oldest (Type III) mounds. Unlike other mounds which form sediment tails (often called“comet marks”), this is the first case where such features are observed.
In addition, the downslope Moira Mounds represent the highest density of small-sized coral mounds recorded (22.9 per km2). Previous
studies have suggested that mound clustering has resulted in higher particle delivery to mounds (e.g. food and sediment) as a result of in-creased turbulence. Coincidently, the suggested younger Moira Mounds appear to preferentially develop within areas of highest mound density, supporting the idea that these mounds may eventually coalesce, de-veloping into the surrounding giant coral carbonate mounds in the Belgica Mound Province.
Acknowledgements
The authors thank Dr. Mohit Tunwal and Nidia Alvarez (UCC) for mathematical proofing, Nicoletta Fusi (Uni. Milano-Bicocca) for gui-dance in laser granulometry, Dr. Boris Dorschel for comments on an
earlier version of this manuscript, Ms. Zoë O' Hanlon and Ms. Kim Harris for proof-reading. We are also very grateful to Gary Greene and one anonymous reviewer for their supportive and constructive com-ments. Authors would like to thank all cruise crew and scientific parties on RV Belgica (cruise number Belgica 12/18) and RV Celtic Explorer (cruise numbers CE15009 and CE11009) with Holland 1 ROV. RV Celtic Explorer cruises were grant aided by the Marine Institute under the Ship Time Programme of the National Development Plan, Ireland. The RV Belgica during the “Moira Mound cruise” was funded by the European Union Seventh Framework Programme (FP7/2007–2013), under the Eurofleets grant agreement n° 228344. This publication has emanated from research supported in part by a research grant from Science Foundation Ireland (SFI) under Grant Number 13/RC/2092 (co-funded under the European Regional Development Fund and by PIPCO RSG and its member companies) and 16/IA/4528 (co-funded by the Irish Marine Institute and the Geological Survey, Ireland) and by the Irish Research Council Graduate of Ireland Scholarship programme (grant number GOIPG/2015/2700).
References
Beyer, A., Schenke, H.W., Klenke, M., Niederjasper, F., 2003. High resolution bathymetry of the eastern slope of the Porcupine Seabight. Mar. Geol. 198, 27–54.
Blott, S.J., Pye, K., 2001. GRADISTAT: a grain size distribution and statistics package for the analyses of unconsolidated sediments. Earth Surf. Process. Landf. 26, 1237–1248.
Brooke, S., Järnegren, J., 2013. Reproductive periodicity of the scleractinian coral Lophelia pertusa from the Trondheim Fjord, Norway. Mar. Biol. 160, 139–153.
Correa, T.B.S., Grasmueck, M., Eberli, G.P., Reed, J.K., Verwer, K., Purkis, S.A.M., 2012. Variability of cold-water coral mounds in a high sediment input and tidal current regime, Straits of Florida. Sedimentology 59, 1278–1304.
Cyr, F., van Haren, H., Mienis, F., Duineveld, G., Bourgault, D., 2016. On the influence of cold-water coral mound size onflow hydrodynamics, and vice versa. Geophys. Res. Lett. 43, 775–783.
Dahl, M.P., Pereyra, R.T., Lundälv, T., André, C., 2012. Fine-scale spatial genetic structure and clonal distribution of the cold-water coral Lophelia pertusa. Coral Reefs 31, 1135–1148.
Davies, A.J., Guinotte, J.M., 2011. Global habitat suitability for framework-forming cold-water corals. PLoS One 6, e18483.
Davies, A.J., Duineveld, G.C., Lavaleye, M.S., Bergman, M.J., van Haren, H., Roberts, J.M., 2009. Downwelling and deep-water bottom currents as food supply mechanisms to the cold-water coral Lophelia pertusa (Scleractinia) at the Mingulay Reef complex. Limnol. Oceanogr. 54, 620.
De Mol, B., Henriet, J.-P., Canals, M., 2005. Development of coral banks in Porcupine Seabight: do they have Mediterranean ancestors? In: Freiwald, A., Roberts, J.M. (Eds.), Cold-water Corals and Ecosystems. Springer, Berlin, Heidelberg, New York, pp. 515–533.
De Mol, B., Kozachenko, M., Wheeler, A.J., Alvares, H., Henriet, J.-P., Olu-Le Roy, K., 2007. Thérèse Mound: a case study of coral bank development in the Belgica Mound Province, Porcupine Seabight. Int. J. Earth Sci. 96, 103–120.
Dorschel, B., Hebbeln, D., Foubert, A.T.G., White, M., Wheeler, A.J., 2007.
Hydrodynamics and cold-water coral facies distribution related to recent sedimentary processes at Galway Mound west of Ireland. Mar. Geol. 244, 184–195.
Dorschel, B., Wheeler, A.J., Huvenne, V.A.I., de Haas, H., 2009. Cold-water coral mounds in an erosive environmental setting: TOBI side-scan sonar data and ROV video foo-tage from the northwest Porcupine Bank, NE Atlantic. Mar. Geol. 264, 218–229.
Douarin, M., Elliot, M., Noble, S.R., Sinclair, D., Henry, L.-A., Long, D., Moreton, S.G., Murray Roberts, J., 2013. Growth of north-east Atlantic cold-water coral reefs and mounds during the Holocene: a high resolution U-series and 14C chronology. Earth Planet. Sci. Lett. 375, 176–187.
Edinger, E.N., Sherwood, O.A., Piper, D.J.W., Wareham, V.E., Baker, K.D., Gilkinson, K.D., Scott, D.B., 2011. Geological features supporting deep-sea coral habitat in Atlantic Canada. Cont. Shelf Res. 31, S69–S84.
Eisele, M., Hebbeln, D., Wienberg, C., 2008. Growth history of a cold-water coral covered carbonate mound - Galway Mound, Porcupine Seabight, NE-Atlantic. Mar. Geol. 253, 160–169.
Folk, R.L., Ward, W.C., 1957. Brazos River bar: a study in the significance of grain size parameters. J. Sediment. Res. 27.
Fonseca, L., Brown, C., Calder, B., Mayer, L., Rzhanov, Y., 2009. Angular range analysis of acoustic themes from Stanton Banks Ireland: a link between visual interpretation and multibeam echosounder angular signatures. Appl. Acoust. 70, 1298–1304.
Foubert, A.T.G., Beck, T., Wheeler, A.J., Opderbecke, J., Grehan, A., Klages, M., Thiede, J., Henriet, J.-P., Polarstern ARK-XIX/3a shipboard party, 2005. New view of the Belgica Mounds, Porcupine Seabight, NE Atlantic: preliminary results from the Polarstern ARK-XIX/3a ROV cruise. In: Freiwald, A., Roberts, J.M. (Eds.), Deep-water Corals and Ecosystems. Springer-Verlag, Berlin Heidelberg, pp. 403–415.
Foubert, A.T.G., Huvenne, V.A.I., Wheeler, A.J., Kozachenko, M., Opderbecke, J., Henriet, J.-P., 2011. The Moira Mounds, small cold-water coral mounds in the Porcupine Seabight, NE Atlantic: part B - evaluating the impact of sediment dynamics through high-resolution ROV-borne bathymetric mapping. Mar. Geol. 282, 65–78.
Frank, N., Ricard, E., Lutringer-Paquet, A., van der Land, C., Colin, C., Blamart, D., Foubert, A.T.G., Van Rooij, D., Henriet, J.-P., de Haas, H., van Weering, T.C.E., 2009. The Holocene occurrence of cold water corals in the NE Atlantic: implications for coral carbonate mound evolution. Mar. Geol. 266, 129–142.
Freiwald, A., Wilson, J.B., 1998. Taphonomy of modern, deep, cold-temperate water coral reefs. Hist. Biol. 13, 37–52.
Freiwald, A., Fosså, J.H., Grehan, A., Koslow, T., Roberts, J.M., 2004. Cold-water Coral Reefs, NEP-WCMC, Cambridge, UK, p. 88.http://hdl.handle.net/20.500.11822/ 8727http://www.unep-wcmc.org/resources/publications/UNEP_WCMC_bio_series/ 22.htm.
Hargrave, B.T., Kostylev, V.E., Hawkins, C.M., 2004. Benthic epifauna assemblages, biomass and respiration in The Gully region on the Scotian Shelf, NW Atlantic Ocean. Mar. Ecol. Prog. Ser. 270, 55–70.
Hebbeln, D., Van Rooij, D., Wienberg, C., 2016. Good neighbours shaped by vigorous currents: cold-water coral mounds and contourites in the North Atlantic. Mar. Geol. 378, 171–185.
Henriet, J.-P., Hamoumi, N., Da Silva, A.-C., Foubert, A., Lauridsen, B.W., Rüggeberg, A., Van Rooij, D., 2014. Carbonate mounds: from paradox to world heritage. Mar. Geol. 352, 89–110.
Hill, A.E., Souza, A.J., Jones, K., Simpson, J.H., Shapiro, G.I., McCandliss, R., Wilson, H., Leftley, J., 1998. The Malin cascade in winter 1996. J. Mar. Res. 56, 87–106.
Huvenne, V.A., Tyler, P.A., Masson, D.G., Fisher, E.H., Hauton, C., Huhnerbach, V., Le Bas, T.P., Wolff, G.A., 2011. A picture on the wall: innovative mapping reveals cold-water coral refuge in submarine canyon. PLoS One 6, e28755.
Huvenne, V.A.I., Beyer, A., de Haas, H., Dekindt, K., Henriet, J.-P., Kozachenko, M., Olu-Le Roy, K., Wheeler, A.J., Participants, T.P.C., Participants, C.C., 2005. The seabed appearance of different coral bank provinces in the Porcupine Seabight, NE Atlantic: results from sidescan sonar and ROV seabed mapping. In: Freiwald, A., Roberts, J.M. (Eds.), Cold-water Corals and Ecosystems. Springer-Verlag, Berlin Heidelberg, pp. 535–569.
Huvenne, V.A.I., Shannon, P.M., Naeth, J., di Primio, R., Henriet, J.-P., Horsfield, B., de Haas, H., Wheeler, A.J., Olu-Le Roy, K., 2007. The Magellan mound province in the Porcupine Basin. Int. J. Earth Sci. 96, 85–101.
Huvenne, V.A.I., Masson, D.G., Wheeler, A.J., 2009a. Sediment dynamics of a sandy contourite: the sedimentary context of the Darwin cold-water coral mounds, Northern Rockall Trough. Int. J. Earth Sci. 98, 865–884.
Huvenne, V.A.I., Van Rooij, D., De Mol, B., Thierens, M., O'Donnell, R., Foubert, A.T.G., 2009b. Sediment dynamics and palaeo-environmental context at key stages in the Challenger cold-water coral mound formation: clues from sediment deposits at the mound base. Deep-Sea Res. I 56, 2263–2280.
Huvenne, V.A.I., Bett, B.J., Masson, D.G., Le Bas, T.P., Wheeler, A.J., 2016. Effectiveness of a deep-sea cold-water coral Marine Protected Area, following eight years of fish-eries closure. Biol. Conserv. 200, 60–69.
Kozachenko, M., 2005. Present and Past Environments of the Belgica Mounds (Deep-water Coral Carbonate Mounds) Eastern Porcupine Seabight, North East Atlantic. unpublished PhD Thesis. Department of Geography and Geology. University College Cork, Cork, pp. 221.
Le Goff-Vitry, M.C., 2004. A deep-sea slant on the molecular phylogeny of the Scleractinia. Mol. Phylogenet. Evol. 30, 167–177.
Lim, A., 2017. Spatio-temporal patterns and controls on cold-water coral reef develop-ment: the Moira Mounds, Porcupine Seabight, NE Atlantic, School of Biological, Earth and Environmental Sciences. University College Cork, Cork Open Research Archive, p. 221.http://hdl.handle.net/10468/4031.
Lim, A., Wheeler, A.J., Arnaubec, A., 2017. High-resolution facies zonation within a cold-water coral mound: the case of the Piddington Mound, Porcupine Seabight, NE Atlantic. Mar. Geol. 390, 120–130.
McCave, I.N., Manighetti, B., Robinson, S.G., 1995. Sortable silt andfine sediments size/ composition slicing: parameters for paleocurrent speed and palaeoceanography. Paleoceanography 10, 593–610.
Messing, C.G., Neumann, A.C., Lang, J.C., 1990. Biozonation of deep-water lithoherms and associated hardgrounds in the northeastern Straits of Florida. PALAIOS 5, 15–33.
Mienis, F., de Stigter, H.C., White, M., Duineveld, G., de Haas, H., van Weering, T.C.E., 2007. Hydrodynamic controls on cold-water coral growth and carbonate-mound development at the SW and SE Rockall Trough Margin, NE Atlantic Ocean. Deep-Sea Res. I 54, 1655–1674.
Mienis, F., De Stigter, H.C., De Haas, H., Van der Land, C., Van Weering, T.C.E., 2012. Hydrodynamic conditions in a cold-water coral mound area on the Renard Ridge, southern Gulf of Cadiz. J. Mar. Syst. 96-97, 61–71.
Mohn, C., Rengstorf, A., White, M., Duineveld, G., Mienis, F., Soetaert, K., Grehan, A., 2014. Linking benthic hydrodynamics and cold-water coral occurrences: a high-re-solution model study at three cold-water coral provinces in the NE Atlantic. Prog. Oceanogr. 122, 92–104.
Morrison, C.L., Ross, S.W., Nizinski, M.S., Brooke, S., Järnegren, J., Waller, R.G., Johnson, R.L., King, T.L., 2011. Genetic discontinuity among regional populations of Lophelia pertusa in the North Atlantic Ocean. Conserv. Genet. 12, 713–729.
Murphy, P., Wheeler, A.J., 2017. A GIS-based application of drainage basin analysis and geomorphometry in the submarine environment: the Gollum Canyon System, North-east Atlantic. In: Bartlett, D., Celliers, L. (Eds.), Geoinformatics for Marine and Coastal Management. CRC Press, Taylor & Francis Group, Boca Raton, USA.
Pingree, R.D., LeCann, B., 1990. Structure, strength and seasonality of the slope current in the Bay of Biscay region. J. Mar. Biol. Assoc. U. K. 70, 857–885.
Pirlet, H., Colin, C., Thierens, M., Latruwe, K., Van Rooij, D., Foubert, A., Frank, N., Blamart, D., Huvenne, V.A., Swennen, R., 2011. The importance of the terrigenous fraction within a cold-water coral mound: a case study. Mar. Geol. 282, 13–25.
Quinn, R., 2006. The role of scour in shipwreck site formation processes and the pre-servation of wreck-associated scour signatures in the sedimentary record– evidence
from seabed and sub-surface data. J. Archaeol. Sci. 33, 1419–1432.
Quinn, R., Smyth, T.A.G., 2017. Processes and patterns offlow, erosion, and deposition at shipwreck sites: a computationalfluid dynamic simulation. Archaeol. Anthropol. Sci. 1–14.http://dx.doi.org/10.1007/s12520-017-0468-7.
Rice, A.L., Billett, D.S.M., Thurston, M.H., Lampitt, R.S., 1991. The Institute of Oceanographic Sciences Biological Programme in the Porcupine Seabight: back-ground and general introduction. J. Mar. Biol. Assoc. U. K. 71, 281–310.
Roberts, J.M., Wheeler, A.J., Cairns, S., Freiwald, A., 2009. Cold-water Corals: The Biology and Geology of Deep-sea Coral Habitats. Cambridge University Press.
van Rooij, D., De Mol, B., Huvenne, V.A.I., Ivanov, M.K., Henriet, J.-P., 2003. Seismic evidences of current-controlled sedimentation in the Belgica mound province, upper Porcupine slope, southwest of Ireland. Mar. Geol. 195, 31–53.
Ross, R.E., Nimmo-Smith, W.A.M., Howell, K.L., 2017. Towards‘ecological coherence’: assessing larval dispersal within a network of existing Marine Protected Areas. Deep-Sea Res. I Oceanogr. Res. Pap. 126, 128–138.
Rosso, A., Vertino, A., Di Geronimo, I., Sanfilippo, R., Sciuto, F., Di Geronimo, R., Violanti, D., Corselli, C., Taviani, M., Mastrototaro, F., Tursi, A., 2010. Hard- and soft-bottom thanatofacies from the Santa Maria di Leuca deep-water coral province, Mediterranean. Deep-Sea Res. II 57, 360–379.
Savini, A., Vertino, A., Marchese, F., Beuck, L., Freiwald, A., 2014. Mapping cold-water coral habitats at different scales within the Northern Ionian Sea (Central Mediterranean): an assessment of coral coverage and associated vulnerability. PLoS One 9, e87108.
Smyth, T.A.G., Quinn, R., 2014. The role of computationalfluid dynamics in under-standing shipwreck site formation processes. J. Archaeol. Sci. 45, 220–225.
Soulsby, R., 1997. Dynamics of Marine Sands, a Manual for Practical Applications. Thomas Telford, London.
Stewart, H.A., Davies, J.S., Guinan, J., Howell, K.L., 2014. The Dangeard and Explorer canyons, South Western Approaches UK: geology, sedimentology and newly dis-covered cold-water coral mini-mounds. Deep-Sea Res. II Top. Stud. Oceanogr. 104, 230–244.
Stow, D.A.V., Hernández-Molina, F.J., Llave, E., Sayago-Gil, M., Díaz del Río, V., Branson, A., 2009. Bedform-velocity matrix: the estimation of bottom current velocity from bedform observations. Geology 37, 327–330.
Strömberg, S.M., Larsson, A.I., 2017. Larval behavior and longevity in the cold-water coral Lophelia pertusa indicate potential for long distance dispersal. Front. Mar. Sci. 4.
Thierens, M., Titschack, J., Dorschel, B., Huvenne, V.A.I., Wheeler, A.J., Stuut, J.-B.W., O'Donnell, R., 2010. The 2.6 Ma depositional sequence from the Challenger cold-water coral carbonate mound (IODP Exp. 307): sediment contributors and hydro-dynamic palaeo-environments. Mar. Geol. 271, 260–277.
Van Rooij, D., 2004. An Integrated Study of Quaternary Sedimentary Processes on the Eastern Slope of the Porcupine Seabight, SW of Ireland. Ghent University (1854/ 10815).
Vandorpe, T., Wienberg, C., Hebbeln, D., Van den Berghe, M., Gaide, S., Wintersteller, P., Van Rooij, D., 2017. Multiple generations of buried cold-water coral mounds since the Early-Middle Pleistocene Transition in the Atlantic Moroccan Coral Province, southern Gulf of Cádiz. Palaeogeogr. Palaeoclimatol. Palaeoecol. 487, 293–304 (1 November).
Vertino, A., Savini, A., Rosso, A., Di Geronimo, I., Mastrototaro, F., Sanfilippo, R., Gay, G., Etiope, G., 2010. Benthic habitat characterization and distribution from two re-presentative sites of the deep-water SML Coral Province (Mediterranean). Deep-Sea Res. II Top. Stud. Oceanogr. 57, 380–396.
Victorero, L., Blamart, D., Pons-Branchu, E., Mavrogordato, M.N., Huvenne, V.A.I., 2016. Reconstruction of the formation history of the Darwin Mounds, N Rockall Trough: how the dynamics of a sandy contourite affected cold-water coral growth. Mar. Geol. 378, 186–195.
Waller, R.G., Tyler, P.A., 2005. The reproductive biology of two deep-water, reef-building scleractinians from the NE Atlantic Ocean. Coral Reefs 24, 514.
Wheeler, A.J., shipboard party, 2011. Vents & Reefs Deep-sea Ecosystem Study of the 45° North MAR Hydrothermal Vent Field and the Cold-water Coral Moira Mounds, Porcupine Seabight. Cruise Reportpp. 160.
Wheeler, A.J., Kozachenko, M., Beyer, A., Foubert, A.T.G., Huvenne, V.A.I., Klages, M., Masson, D.G., Olu-Le Roy, K., Thiede, J., 2005. Sedimentary processes and carbonate mounds in the Belgica Mound province, Porcupine Seabight, NE Atlantic. In: Freiwald, A., Roberts, J.M. (Eds.), Cold-water Corals and Ecosystems. Springer-Verlag, Berlin Heidelberg, pp. 533–564.
Wheeler, A.J., Beyer, A., Freiwald, A., de Haas, H., Huvenne, V.A.I., Kozachenko, M., Olu-Le Roy, K., Opderbecke, J., 2007. Morphology and environment of cold-water coral carbonate mounds on the NW European margin. Int. J. Earth Sci. 96, 37–56.
Wheeler, A.J., Kozachenko, M., Masson, D.G., Huvenne, V.A.I., 2008. Influence of benthic sediment transport on cold-water coral bank morphology and growth: the example of the Darwin Mounds, north-east Atlantic. Sedimentology 55, 1875–1887.
Wheeler, A.J., Kozachenko, M., Henry, L.A., Foubert, A., de Haas, H., Huvenne, V.A.I., Masson, D.G., Olu, K., 2011. The Moira Mounds, small cold-water coral banks in the Porcupine Seabight, NE Atlantic: part A—an early stage growth phase for future coral carbonate mounds? Mar. Geol. 282, 53–64.
Wheeler, A.J., Capocci, R., Crippa, L., Connolly, N., Hogan, R., Lim, A., McCarthy, E., McGonigle, C., O'Donnell, E., O'Sullivan, K., Power, K., Ryan, G., Vertino, A., Holland 1 ROV Technical Team, Officers and Crew of the RV Celtic Explorer, 2015. Cruise Report: Quantifying Environmental Controls on Cold-water Coral Reef Growth (QuERCi). University College Cork, Ireland.
White, M., 2007. Benthic dynamics at the carbonate mound regions of the Porcupine Sea Bight continental margin. Int. J. Earth Sci. 96, 1–9.
White, M., Dorschel, B., 2010. The importance of the permanent thermocline to the cold water coral carbonate mound distribution in the NE Atlantic. Earth Planet. Sci. Lett. 296, 395–402.
White, M., Mohn, C., de Stigter, H.C., Mottram, G., 2005. Deep-water coral development as a function of hydrodynamics and surface productivity around the submarine banks of the Rockall Trough, NE Atlantic. In: Freiwald, A., Roberts, J.M. (Eds.), Cold-water Corals and Ecosystems. Springer, Berlin, Heidelberg, New York, pp. 503–514.
Wienberg, C., Titschack, J., 2017. Framework-forming scleractinian cold-water corals through space and time: a Late Quaternary North Atlantic perspective. In: Rossi, S., Bramanti, L., Gori, A., Orejas, C. (Eds.), Marine Animal Forests: The Ecology of Benthic Biodiversity Hotspots. Springer International Publishing, Cham, pp. 699–732.
Wienberg, C., Beuck, L., Heidkamp, S., Hebbeln, D., Freiwald, A., Pfannkuche, O., Monteys, F.X., 2008. Franken Mound: facies and biocoenoses on a newly-discovered
“carbonate mound” on the western Rockall Bank, NE Atlantic. Facies 54, 1–24.
Wilber, R.J., Whitehead, J., Halley, R.B., Milliman, J.D., Wilson, P.A., Roberts, H.H., 1993. Carbonate-periplatforrn sedimentation by densityflows: a mechanism for rapid off-bank and vertical transport of shallow-water fines: comment and reply. Geology 21, 667–669.
Wilson, M.F.J., O'Connell, B., Brown, C., Guinan, J.C., Grehan, A.J., 2007. Multiscale terrain analysis of multibeam bathymetry data for habitat mapping on the continental slope. Mar. Geod. 30, 3–35.
Zibrowius, H., 1980. Les Scléractiniaires de la Méditerranée et de l'Atlantique nord-or-iental. Mémoires de l'Institut océanographique, Monaco.