Remote sensing of cropping practice in Northern Italy using time-series from
Sentinel-2
Thor-Bjørn Ottosen
a,⁎, Suzanne T.E. Lommen
b, Carsten Ambelas Skjøth
aaSchool of Science and the Environment, University of Worcester, Henwick Grove, WR2 6AJ Worcester, United Kingdom bDepartment of Biology, University of Fribourg, Chemin du Musée 10, 1700 Fribourg, Switzerland
A R T I C L E I N F O Keywords: NDVI Time-series analysis Clustering Phenology Weed infestation A B S T R A C T
Maps of cropping practice, including the level of weed infestation, are useful planning tools e.g. for the as-sessment of the environmental impact of the crops, and Northern Italy is an important example due to the large and diverse agricultural production and the high weed infestation. Sentinel-2A is a new satellite with a high spatial and temporal resolution which potentially allows the creation of detailed maps of cropping practice including weed infestation. To explore the applicability of Sentinel-2A for mapping cropping practice, we analysed the Normalised Differential Vegetation Index (NDVI) time series from five weed-infested crop fields as well as the areas designated as non-irrigated agricultural land in Corine Land Cover, which also contributed to an increased understanding of the cropping practice in the region. The analysis of the case studies showed that the temporal resolution of Sentinel-2A was high enough to distinguish the gross features of the cropping practice, and that high weed infestations can be detected at this spatial resolution. The analysis of the entire region showed the potential for mapping cropping practice using Sentinel-2. In conclusion, Sentinel-2A is to some extent applicable for mapping cropping practice with reasonable thematic accuracy.
1. Introduction
Precise information about the cropping practice in a specific region
is important for a range of scientific and planning purposes including
assessing the environmental consequences of the crops (Leff et al.,
2004). In the following a cropping practice is defined in line withBégué
et al. (2018)as the“planting arrangement in time and space on a piece of land, and associated crop management techniques”. One commonly applied approach to obtain this information is through satellite remote sensing.
Satellite remote sensing has been used in agriculture since thefirst
Landsat satellite in the 1970s. Compared to ground surveys or ques-tionnaires, remote sensing has the advantage to be able to quickly cover a large area, monitor temporal changes and require less manual labour. In recent years, in line with increasing computer power, agricultural mapping approaches have progressed from single image towards
multi-temporal approaches using satellites such as AVHRR (e.g.Jakubauskas
et al. (2002)), MODIS (e.g.Estel et al. (2016)), and SPOT VEGETATION (Nguyen et al., 2012). This has spurred a development towards in-creasingly detailed agricultural maps moving from traditional land
cover maps towards maps of cropping practice (Bégué et al., 2018). One
commonly applied method is using time series of vegetation indices as
input to the classification, which has been applied in e.g. China (Chen
et al. (2014),Zhang et al. (2008)), Vietnam (Nguyen et al., 2012), USA (Zhang and Hepner, 2017), and Northern Italy (Villa et al., 2015).
Northern Italy, the Po Valley in particular, is one of the few regions in Europe with a consistent high agricultural production in a large number of sectors such as cereals, vegetables, wine, poultry and
asso-ciated animal production (e.g.Olsen (2010)).
Villa et al. (2015)mapped seven crop types, using Landsat 8 and COSMO-SkyMed, in Northern Italy in near real-time for mid-season and showed an improved thematic accuracy when combining radar satellite data with optical satellite data.
Weeds are a major agricultural problem causing an estimated 34%
of global crop losses (Oerke, 2006). Some agricultural weeds; such as
common common ragweed, Ambrosia artemisiifolia L. common ragweed constitute invasive species and also have negative impact on the public
health (e.g.Smith et al. (2013)). Knowledge of the spatial and temporal
distribution of such weeds is therefore essential to better monitor their
spread and to target areas for management (Latombe et al., 2017).
Northern Italy is characterized by high densities of common ragweed (Smith et al., 2013) especially on stubblefields after the harvest of
cereals typically early July (e.g. Lehoczky et al. (2013)). The high
temporal and spatial variability of this phenomenon makes remote
⁎Corresponding author.
E-mail address:Suzannelommen@hotmail.com(S.T.E. Lommen).
http://doc.rero.ch
Published in "Computers and Electronics in Agriculture 157(): 232–238, 2019"
which should be cited to refer to this work.
sensing a natural choice of study method. This region is also largely affected by Johnson grass (Sorghum halepense) and velvetleaf (Abu-tilon theophrasti) (Francesco Vidotto, personal communication). Map-ping cropMap-ping practice, including weed infestation, is expected to im-prove mitigation of weeds including common ragweed.
Remote sensing of weed infestation has hitherto been hampered by
the small size and patchiness (Müllerová et al., 2017). For common
ragweed,Ngom and Gosselin (2014)mapped the likelihood of common
ragweed presence in Quebec, Canada andAuda et al. (2008a)mapped
the common ragweed cover in the Rhone-Alpes region of France.
Rakotoniaina et al. (2009) compared two methods for mapping
common ragweed and Auda et al. (2008b)applied a non-parametric
classification, founded on the maximum likelihood classification, to
multi-temporal images. Studies on other weeds are rather scarce. Most of these studies used a classification approach based on a single image (or a few closely dated images). Identifying specific herbaceous plants,
from single images is a challenge, however, due to the difficulty to
distinguish them from other vegetation (Laba et al., 2005, Müllerová
et al., 2017), and the possibility of using a time series approach for detection has thus received less attention.
The Sentinel-2A satellite was launched in 2015 and has a spatial resolution (in four bands) of up to 10 m × 10 m and a temporal
re-solution of approximately 10 days (Drusch et al., 2012). The spatial
resolution is thus higher than satellites such as MODIS and SPOT VEGETATION, at the expense of a lower temporal resolution. Given that
this is a new satellite, the sufficiency of the spatial and temporal
re-solution of this satellite for mapping cropping practice, including weed infestation, has yet to be determined.
To explore the applicability of Sentinel-2A for mapping cropping
practice, wefirst analysed the Normalised Differential Vegetation Index
(NDVI) time series from five crop fields, infested with common
rag-weed, in Northern Italy, using in situ observations and the corre-sponding RGB (red, green, blue) images from Sentinel-2. Subsequently, to form a better view of the cropping practice in Northern Italy, and at the same time gain further insight into the applicability of Sentinel-2 for
mapping cropping practice; we classified the time series from Sentinel-2
for the entire region, and assessed the accuracy of the resulting land cover map.
2. Methods 2.1. Study area
The study area, mainly located in the Piedmont region of Italy
in-clude parts of the Italian Po plain, which is mostlyflat and intensively
cultivated. The two Sentinel-2 tiles (T32TMR and T32TLQ,Fig. 1) cover
a total area of 2.38 · 104km2. The administrative centre is the city of
Turin and according to Harris et al. (2014), the annual mean
tem-perature is 12.3 °C with monthly means varying from 2.2 °C in the winter to 22.1 °C in the summer. The annual precipitation is 1016 mm, peaking in late spring and autumn and with a relatively dry winter
period (40–50 mm/month) within the months December-February.
According to Eurostat (http://ec.europa.eu/eurostat/web/agriculture/
data/database) (2013 numbers, tables named ef_mainfarm and ef_lan-duse), the agricultural land is mainly used for permanent grassland (38%), permanent crops (9%) and cereals (40%). Minor crops including legumes, root crops and industrial crops account for 10% of the area. The cereals are dominated by common wheat (9%), barley (1%), maize (17%) and rice (12%) (all percentages are of total area). The
distribu-tion between spring crops and winter crops is, according toLeff et al.
(2004), generally not recorded systematically and thus not part of the
Eurostat databases. However,Leff et al. (2004)also records, that the
main wheat variety in Europe is winter wheat with a typical harvest time in June-August, while maize is considered a spring crop with a later harvest time. Barley, a minor crop in this region, is in Europe used both as a spring crop and as a winter crop.
2.2. Selection of case studies
Common ragweed, originating from North America, is one of the
important weeds in the area. It was first recorded in the west of
Piedmont in 1902 (Ciappetta et al., 2016) and then spread across the
entire Po Plain. In Piedmont, local authorities promote the management of common ragweed before the end of August, when it emits highly
allergenic pollen adversely affecting human health. Non-grassy weeds
are commonly suppressed during cropping by the use of general her-bicides acting against grasses. Although common ragweed is a non-grassy weed, it is hard to completely eliminate due to its large capacity
for regrowth after the application of herbicides (Sölter et al., 2016).
Moreover, due to its long germination period, it can still germinate later
in summer (Kazinczi et al., 2008) and then quickly grow when
com-petition from cereals is eliminated by the harvest. This can result in near-monocultures of common ragweed with high density sometimes
resulting in a carpet-like cover (Lehoczky et al., 2013). Typically, the
fields remain unused until sowing in late autumn (pers. comm. Fran-cesco Vidotto). Since a few years common ragweed in this area is also heavily attacked by the ragweed leaf beetle, Ophraella communa. This is a natural enemy from the native range of the plant that is thought to
have been accidentally introduced into Europe (Müller-Schärer et al.,
2014). Defoliation of the plants typically increases rapidly in the second
half of August turning green plants brown within one to two weeks (personal observation Lommen et al.).
Within the two tiles, we selectedfive stubble fields in Northern Italy
in the summer of 2016 (Table 1,Fig. 1, and the attached Google Earth
file) with variable levels of common ragweed infestation. The fields where identified as having been used for cereal production (excluding
maize). We visited thefields in August, visually estimated which
per-centage of thefield was infested by common ragweed and recorded the
visual impact of Ophraella communa. 2.3. Data
All 291 Level 1C images that partly or fully cover the two tiles
(T32TMR and T32TLQ,Fig. 1) during 2016 were downloaded without
further preprocessing (Drusch et al., 2012). Detailed RGB-images were
Fig. 1. Map of the two Sentinel-2 tiles and thefive case study sites. Numbers correspond to the numbers inTable 1. Cities are marked as the city centre. The colours represent height above mean sea level (MSL). Country boundaries and cities source: Esri (www.arcgis.com), elevation: Reuter et al., (2007).
produced from band 4, 3 and 2 from the Sentinel-2 satellite by selecting
a 1000 m circle of the image around the selectedfield. This allowed to
visually assess if thefield was influenced by e.g. clouds or shadows and
at the same time allowed a visual assessment of the vegetation cover on
thefield.
2.4. Remote sensing data and cropping practice mapping
Before we calculated vegetation indices from the images, we re-moved clouds and other artefacts from the images using the
accom-panying maskfiles for each image. We selected the pixels corresponding
to each of thefive case study fields. Following the approach of e.g.Chen
et al. (2014), Estel et al. (2016), Nguyen et al. (2012), Zhang and Hepner (2017), we calculated the NDVI value for each pixel (corre-sponding to 10 m × 10 m), since the geometric accuracy is at subpixel
level (Clerc and MPC Team, 2017). For the analysis of the case study
fields, data points influenced by clouds and shadows that had not been removed by the accompanying cloud mask were removed manually
based on a visual inspection of the RGB-images. For each of thefive
fields, we subsequently plotted and visually analysed the time series
based on the knowledge from the in situ observations of thefields along
with the corresponding RGB images.
In order to map the cropping practice in the two Sentinel tiles
(to-talling 2.38 · 108 pixels) the area classified as “non-irrigated arable
land” from Corine Land Cover (Bossard et al., 1994) was selected from
the images and the NDVI time series for each pixel was calculated. This yielded approximately 35 million time series. Given the limited amount of training data in the present study, we have used unsupervised
clas-sification using similar principles asDe Alwis et al. (2007) and Langley
et al. (2001). Due to the large number of time series, the classification
had to be done using the K-means procedure from Intel Data Analytics
Abstraction Library (DAAL) (
https://software.intel.com/en-us/intel-daal). The clustering procedure was applied in two steps.
(1) All 35 million time series were classified into six clusters. This
number was determined, following the approach of Estel et al.
(2016), by calculating the Davies-Bouldin index (Davies and Bouldin, 1979) for 2–40 clusters where six clusters had one of the lowest values. We labelled the classes based on plots of the cluster centroid time series compared with the classified map overlaid on WorldView 2 RGB images obtained from DigitalGlobe. The three general classes (fields, broadleaved trees and non-vegetation) could
easily be determined from the WorldView 2 images, and thefield
data was used to further subclassify the pixels classified as fields.
The visual inspection of the resulting map showed thatfield # 1, 2,
3 and 5 were in a class dominated byfields, whereas field #4 was
classified in another class dominated by non-vegetation pixels.
Apart from fields with training data and non-vegetation, three
classes representedfields where no training data was available for
the present study these were labelled as unclassified fields.
(2) To separatefield #4 from the non-vegetation pixels, this class was
further subdivided using the k-means clustering algorithm. Since these time series cover an approximately continuous region in NDVI, using the Davies-Bouldin index again yielded no useful re-sults. By gradually increasing the number of clusters it was evident
that 10 clusters were needed to separatefield #4 and similar fields
from the non-vegetation pixels. The remaining 9 classes, where we had no training data was then added to the class of unclassified fields or to the non-vegetation class based on a visual inspection of
the classification overlaid on the WorldView-2 images. Similarly,
the class with field #1, 2, 3 and 5 were divided into three
sub-classes using the k-means clustering, with the results representing gradually increased weed infestation, which could easily be inter-preted from the plot of the cluster centroids and supported by the field observations.
2.5. Accuracy assessment
The accuracy assessment follows the procedure described in a
concurrent study by some of the authors (Ottosen et al., in
preparar-tion). Due to the limited amount of ground truth data in the present
study, the accuracy assessment was done using Google Earth using
si-milar procedures as e.g.Benza et al. (2016), Wickham et al. (2017),
where ground truth is visually assessed from Google Earth. As the cropping practice is not directly detectable from Google Earth, only the land-use classification (fields, broadleaved trees, non-vegetation) was
used similarly to the approach ofZhang et al. (2008). A stratified
random sampling of 100 points in each land use class was used for the
classification following the recommendation of Stehman (2001). The
results were reported in the form of a confusion matrix including the
user’s and producer’s accuracy (Congalton and Green, 2009).
3. Results and discussion
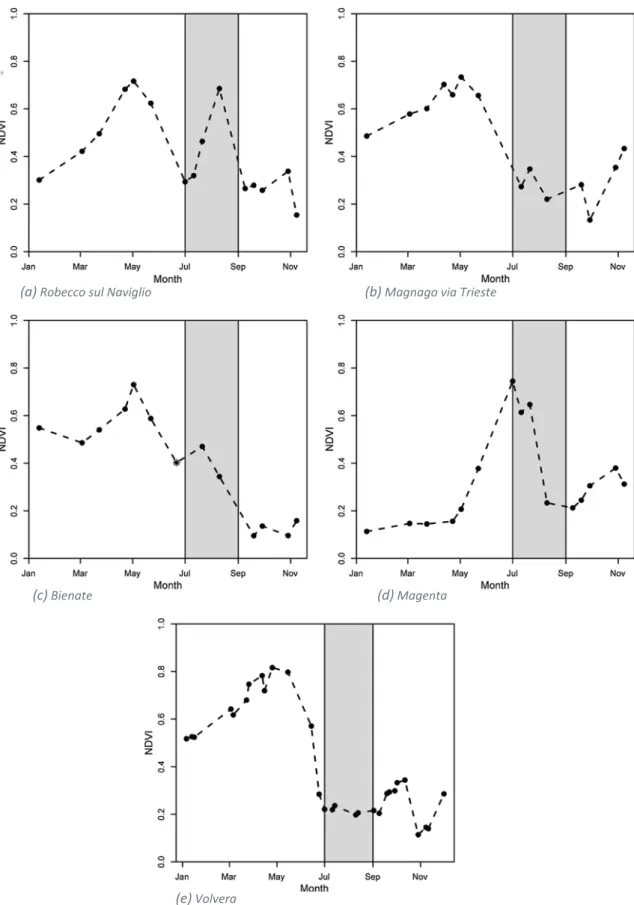
3.1. NDVI patterns in case studyfields
The NDVI time series for the five case study fields are shown in
Fig. 2. Allfive cases show a distinct phenological peak related to crop
growth. Robecco sul Naviglio (Fig. 2a), Magnago via Trieste (Fig. 2b),
Bienate (Fig. 2c) and Volvera (Fig. 2e) show a peak NDVI value around
1 May and a harvest date before 1 July, which indicates that thesefields
are winter crops. This interpretation is supported by Eurostat which
states that wheat is very common and, according toLeff et al. (2004),
wheat is mainly grown as a winter crop in Europe. Due to cloud cover in June 2016, it is not possible to determine the harvest date with greater
precision. Magenta (Fig. 2d) shows a different pattern, with the field
being practically bare until 1 May, hereafter thefield turns green
ra-pidly with a harvest date between 21 July and 10 August. This indicates
that this field is an example of a spring crop, which according to
Eurostat, is likely barley in this region. In summary, this means that the temporal resolution of Sentinel-2 is on the limit of being high enough for detecting the phenological characteristics of crop growth in this type
offields. It is evident that one or two cloud-covered images makes it
difficult to detect features such as harvest date for single fields. Re-peating the analysis after the launch of Sentinel-2B will yield a higher temporal resolution, which may alleviate this problem.
With respect to weed growth, in this case common ragweed, it can be seen that Robecco sul Naviglio shows a distinct peak NDVI value after the cropping season. Magnago via Trieste and Bienate show smaller peaks in the common ragweed growth season corresponding
Table 1
Overview offield sites.
Nr Name Size (m2) Description situation 2016
1 Robecco sul Naviglio 49,365 Very heavily infested with common ragweed, no other vegetation, common ragweed completely destroyed by Ophraella by 25 August 2 Magnago 9899 High infestation of common ragweed among other vegetation, common ragweed completely destroyed by Ophraella by 25 August 3 Bienate 14,138 High infestation of common ragweed dominating the vegetation, common ragweed completely destroyed by Ophraella by 25 August 4 Magenta 9179 Some infestation of common ragweed, making up about half of the vegetation common ragweed completely destroyed by Ophraella after
25 August
5 Volvera 16,420 Medium infestation of common ragweed, attacked by Ophraella but period of destruction unknown
(a)
Robecco sul Naviglio
(b)
Magnago via Trieste
(c)
Bienate
(d)
Magenta
(e)
Volvera
Fig. 2. Time series plots of the median value of NDVI for thefive test sites. Spikes caused by clouds/shadows that have not been removed by the mask have subsequently been removed manually. The grey shaded area indicates roughly the period from wheat harvest (and appearing visibility of common ragweed plants) until the disappearance of common ragweed. The data point for 21 June for Bienate is marked with an asterisk since the image is influenced by a thin cloud cover.
Fig. 3. Map of cropping practice for the two Sentinel-2 tiles.
Table 2
Area covered by the different classes. The percentages are of total agricultural land (total area minus non-vegetation and broadleaved trees (2769 km2). The numbers
from Eurostat are shown for comparison and corresponds to the region of Piedmont.
Class Area (km2) Percentage (%) Percentage Eurostat (%)
Unclassified fields 2136 77.1 71
Broadleaved trees 604
Non-vegetation 202
Spring cereal (excl. maize) 15 0.5
Winter crops,– high weed infestation 164 5.9
Winter crops– medium weed infestation 251 9.1
Winter crops– no weed infestation 203 7.3
Total winter crops 618 22.3 26
Other (e.g. durum wheat and oats) 3
Total 3575
with the lower infestation levels observed in thefield. From the RGB
images for these twofields it can be seen, that although large parts of
thefields are infested with weeds – in this case common ragweed – the
density is not very high, which yields smaller peaks in the NDVI curves.
Since thefields are reasonably homogeneous, dividing the fields into
smaller areas would yield similar results. The pattern in Magenta is in line with the hypothesis that this land had been cropped with a spring crop, in which common ragweed will grow simultaneously with the crop. The second small peak in August may represent the regrowth of common ragweed after harvest (as observed on the ground), but could also be caused by the crop itself. For Volvera, the infestation level has probably been below the detection limit. In summary, this shows that
weeds, in this case common ragweed, that grows onfields after harvest
can be detected from NDVI time series from Sentinel-2, if present in
sufficiently high densities. It is evident fromFig. 2that the spatial
re-solution of Sentinel-2 is high enough to detect high weed infestations, whereas it is less applicable to lower infestation levels.
3.2. Mapping cropping practice
The map of the cropping practice of the region is shown inFig. 3
and the area covered by the different classes is tabulated inTable 2. The
table shows that 77% of the investigated area is agricultural land while 22% is non-agricultural areas. It is evident that the region is dominated
byfields with a different phenology compared to the case studies. It is
likewise evident that only a small fraction of the area shows the
phe-nological signal of spring crops.Villa et al. (2015)clearly demonstrates
that the spring crop maize has a very different phenological signal
compared to the spring crops observed in our study. This suggest that the observed spring crops are mainly barley and our results of only
15 km2correspond well with the fact that only 1% of the area is used
for barley (both winter and spring barley).
22% of the entire crop area has a phenological signal that corre-sponds to winter crops. This matches very well the data from Eurostat as about 26% of all cereals can be expected to be common wheat, hence winter crops, within this geographical region. Of these, approximately two thirds show some degree of weed infestation which must be con-sidered a high number. The fact that the region is heavily infested with common ragweed means that a large part of this will be common
rag-weed. It is evident fromFig. 3that especially the south-western part of
the region is influenced by fields with high weed infestation. In this
way, an increased understanding of the cropping practice, including the level of weed infestation, has been achieved for this region.
Assuming that the selection process using Corine Land Cover does not select most regions covered with rice, permanent crops and grass-land, then the regions we have studied will be, according to Eurostat,
mainly covered by cereals. This suggests that the unclassified field
section inTable 2is mainly maize as this is the majority of the crop that
is not considered a winter crop.
The fact that seven phenological classes has been distinguished in
Fig. 3, shows the potential for mapping cropping practice using
Sentinel-2. With a spatial resolution of 10 m × 10 m, the present map has a higher spatial resolution compared to previous maps of cropping practice.
3.3. Accuracy assessment
The results of the accuracy assessment of the land-use map are
shown inTable 3. The overall accuracy for all three land-use classes
(correctly classified points divided by total number of points) is 69%. It
is evident fromTable 3that the thematic accuracy forfields and
non-vegetation are much higher than for broadleaved trees, which explains the slightly low overall accuracy. As can be seen, the number of broadleaved trees is overestimated and the confusion is mainly with fields. The reason is that certain fields show a phenological signal
strongly resembling broadleaved trees. Samples from this type offields
were not collected for the present study, and future work should aim at
distinguishing these. Given the high thematic accuracy offields and
non-vegetation, it is however the authors opinion that the results pre-sented in the section on mapping of cropping practice are still valid. 4. Conclusions
Sentinel-2A is to some extent applicable for mapping cropping practice. The high spatial resolution of this satellite means that small and patchy elements, such as weed infestation, can be mapped in
spe-cific situations, where densities are sufficiently high. This shows the
advantage of using a time series approach for the detection of weeds, in this case common ragweed. The temporal resolution of this satellite is high enough to detect some phenological features (growth of plants, harvest, weed growth and destruction by the Ophraella communa), however not high enough to detect other phenological elements such as harvest date, due to the presence of cloud cover in that period.
A more detailed understanding, as well as a map, of the cropping practice in Northern Italy has been obtained through the present study. This demonstrates that reasonable accurate maps of cropping practice can be produced from Sentinel-2A time series.
One remaining question is whether a better map of the cropping practice, including low ragweed infestations, could be obtained in si-tuations with a lower cloud cover. It is also possible that a better map could be achieved after the launch of Sentinel-2B, which would increase the temporal resolution of the satellite to approximately 5 days or through using a combination of Sentinel-1, which is not influenced by cloud cover, and Sentinel-2.
Acknowledgements
We are thankful for contributed observations in thefield by Benno
Augustinus and Francesco Vidotto, and for discussions on the phe-nology of weeds with Francesco Vidotto, Gerhard Karrer, and Bruno
Chauvel. We acknowledge financial support from the Swiss State
Secretariat for Education, Research and Innovation (C13.0146), the
COST Action FA1203‘Sustainable management of Ambrosia
artemisii-folia in Europe (SMARTER)’, and the project “New approaches for the early detection of tree health pests and pathogens” funded by BBSRC (ProjectID: BB/L012286/1)
Appendix A. Supplementary material
Supplementary data to this article can be found online athttps://
doi.org/10.1016/j.compag.2018.12.031. References
Auda, Y., Déchamp, C., Dedieu, G., Blasco, F., Duisit, D., Pontier, E.J.L., 2008a. Détection des plantes envahissantes par télédétection : un cas d'étude, l'ambroisie en région Rhône-Alpes, France. Int. J. Remote Sens. 29, 1109–1124.
Table 3
Confusion matrix for the comparison between the land-use map and reference data generated from Google Earth including total accuracy (Total), user’s ac-curacy (User), producer’s accuracy (Prod) and number of pixels in each class (N).
Map
Reference Fields Broadleaved Non-vegetation Total: Prod: N Fields 31.3 18.7 6.0 56.0 56.0 168 Broadleaved 1.3 11.3 0.7 13.3 85.0 40 Non-Vegetation 0.7 3.3 26.7 30.7 87.0 92 Total 33.3 33.3 33.3 100.0 User 94.0 34.0 80.0 N 100 100 100 300
http://doc.rero.ch
Auda, Y., Hagolle, O., Gastellu-Etchegorry, J.-P., Rakotoniaina, S., Roux, R., Meon, H., Dechamp, C., 2008b. Contribution of multi-temporal very high resolution images to Ambrosia Artemisiifolia L. remote sensing. Allergo J. 17, 380.
Bégué, A., Arvor, D., Bellon, B., Betbeder, J., de Abelleyra, D.P.D., Ferraz, R., Lebourgeois, V., Lelong, C., Simões, M., Verón, R., S., 2018. Remote sensing and cropping prac-tices: a review. Remote Sens. 10.
Benza, M., Weeks, J.R., Stow, D.A., López-Carr, D., Clarke, K.C., 2016. A pattern-based definition of urban context using remote sensing and GIS. Remote Sens. Environ. 183, 250–264.
Bossard, M., Feranec, J. & Otahel, J., 1994. CORINE Land Cover. Technical Guide.
Chen, L., Jin, Z., Michishita, R., Cai, J., Yue, T., Chen, B., Xu, B., 2014. Dynamic mon-itoring of wetland cover changes using time-series remote sensing imagery. Ecol. Inf. 24, 17–26.
Ciappetta, S., Ghiani, A., Gilardelli, F., Bonini, M., Citterio, S., Gentili, R., 2016. Invasion of Ambrosia artemisiifolia in Italy: Assessment via analysis of genetic variability and herbarium data. Flora– Morphol., Distrib., Functional Ecol. Plants 223, 106–113. Clerc, S., & MPC Team, 2017. Sentinel 2 Data Quality Report.
Congalton, R.G., Green, K., 2009. Assessing the Accuracy of Remotely Sensed Data: Principles and Practices. CRC Press/Taylor & Francis.
Davies, D.L., Bouldin, D.W., 1979. A cluster separation measure. IEEE Trans. Pattern Anal. Mach. Intell., PAMI-1, pp. 224–227.
de Alwis, D.A., Easton, Z.M., Dahlke, H.E., Philpot, W.D., Steenhuis, T.S., 2007. Unsupervised classification of saturated areas using a time series of remotely sensed images. Hydrol. Earth Syst. Sci. 11, 1609–1620.
Drusch, M., del Bello, U., Carlier, S., Colin, O., Fernandez, V., Gascon, F., Hoersch, B., Isola, C., Laberinti, P., Martimort, P., Meygret, A., Spoto, F., Sy, O., Marchese, F., Bargellini, P., 2012. Sentinel-2: ESA's optical high-resolution mission for GMES op-erational services. Remote Sens. Environ. 120, 25–36.
Estel, S., Kuemmerle, T., Levers, C., Baumann, M., Hostert, P., 2016. Mapping cropland-use intensity across Europe using MODIS NDVI time series. Environ. Res. Lett. 11 024015–024015.
Harris, I., Jones, P.D., Osborn, T.J., Lister, D.H., 2014. Updated high-resolution grids of monthly climatic observations - the CRU TS3.10 Dataset. Int. J. Climatol. 34, 623–642.
Jakubauskas, M.E., Legates, D.R., Kastens, J.H., 2002. Crop identification using harmonic analysis of time-series AVHRR NDVI data. Comput. Electron. Agric. 37, 127–139.
Kazinczi, G., Béres, I., Novák, R., Bíro, K., Pathy, Z., 2008. Common ragweed Ambrosia artemisiifolia: a review with special regards to the results in Hungary. I. Taxonomy, origin and distribution, morphology, life cycle and reproduction strategy. Herbologia 9, 55–91.
Laba, M., Tsai, F., Ogurcak, D., Smith, S., Richmond, M.E., 2005. Field determination of optimal dates for the discrimination of invasive wetland plant species using deriva-tive spectral analysis. Photogramm. Eng. Remote Sens. 71, 603–611.
Langley, S.K., Cheshireb, H.M., Humes, K.S., 2001. A comparison of single date and multitemporal satellite image classifications in a semi-arid grassland. J. Arid Environ. 49, 401–411.
Latombe, G., Pyšek, P., Jeschke, J.M., Blackburn, T.M., Bacher, S., Capinha, C., Costello, M.J., Fernández, M., Gregory, R.D., Hobern, D., Hui, C., Jetz, W., Kumschick, S., McGrannachan, C., Pergl, J., Roy, H.E., Scalera, R., Squires, Z.E., Wilson, J.R.U., Winter, M., Genovesi, P., McGeoch, M.A., 2017. A vision for global monitoring of
biological invasions. Biol. Conserv. 213, 295–308.
Leff, B., Ramankutty, N., Foley, J.A., 2004. Geographic distribution of major crops across the world. Global Biogeochem. Cycles 18, 18.
Lehoczky, É., Busznyák, J., Gólya, G., 2013. Study on the spread, biomass production, and nutrient content of ragweed with high-precision GNSS and GIS device system. Commun. Soil Sci. Plant Anal. 44, 535–545.
Müller-Schärer, H., Lommen, S.T.E., Rossinelli, M., Bonini, M., Boriani, M., Bosio, G., Schaffner, U., Hatcher, P., 2014. Ophraella communa, the ragweed leaf beetle, has successfully landed in Europe: fortunate coincidence or threat? Weed Res. 54, 109–119.
Müllerová, J., Brůna, J., Bartaloš, T., Dvořák, P., Vítková, M., Pyšek, P., 2017. Timing is important: unmanned aircraft vs. satellite imagery in plant invasion monitoring. Front. Plant Sci. 8, 1–13.
Ngom, R., Gosselin, P., 2014. Development of a remote sensing-based method to map likelihood of common ragweed (ambrosia artemisiifolia) presence in urban areas. IEEE J. Sel. Top. Appl. Earth Obs. Remote Sens. 7, 126–139.
Nguyen, T.T.H., de Bie, C.A.J.M., Ali, A., Smaling, E.M.A., Chu, T.H., 2012. Mapping the irrigated rice cropping patterns of the Mekong delta, Vietnam, through hyper-tem-poral SPOT NDVI image analysis. Int. J. Remote Sens. 33, 415–434.
Oerke, E.C., 2006. Crop losses to pests. J. Agric. Sci. 144, 31–43.
Olsen, O., 2010. Agriculture andfisheries A regional picture of farming in Europe — what, where and how much? Eurostat Statistics in focus.
Ottosen, T.-B., Petch, G., Hanson, M., Skjøth, C. Accuracy assessment of high resolution maps of European conifer and broadleaved trees based on Sentinel-2. Remote Sensing of Environment (in preparation).
Rakotoniaina, S., Auda, Y., Blasco, F., Déchamp, C., 2009. Comparaison Des Méthodes de Classification Non Paramétrique (k-NN) et Contextuelle (ICM) Appliquées à La Cartographie Par Télédétection Du Niveau d’ Infestation Par l ’ Ambroisie Comparison of the k-NN Nonparametric and the ICM Contextual Classification Methods Applied to the Remote Sensing Detection of Ragweed. Ambroisie, First Int. Ragweed Rev. 26, 77–87.
Smith, M., Cecchi, L., Skjøth, C.A., Karrer, G.,Šikoparija, B., 2013. Common ragweed: A threat to environmental health in Europe. Environ. Int. 61, 115–126.
Sölter, U., Mathiassen, S., Verschwele, A., 2016. Combining cutting and herbicide ap-plication for Ambrosia artemisiifolia control. In: 27th German Conference on Weed Biology and Weed Control.
Stehman, S.V., 2001. Statistical rigor and practical utility in thematic map accuracy as-sessment. Photogramm. Eng. Remote Sens. 67, 727–734.
Villa, P., Stroppiana, D., Fontanelli, G., Azar, R., Brivio, P., 2015. In-season mapping of crop type with optical and X-band SAR data: a classification tree approach using synoptic seasonal features. Remote Sens. 7, 12859–12886.
Wickham, J., Stehman, S.V., Gass, L., Dewitz, J.A., Sorenson, D.G., Granneman, B.J., Poss, R.V., Baer, L.A., 2017. Thematic accuracy assessment of the 2011 National Land Cover Database (NLCD). Remote Sens. Environ. 191, 328–341.
Zhang, X., Sun, R., Zhang, B., Tong, Q., 2008. Land cover classification of the North China Plain using MODIS_EVI time series. ISPRS J. Photogramm. Remote Sens. 63, 476–484.
Zhang, Y., Hepner, G.F., 2017. The Dynamic-Time-Warping-based k-means++ clustering and its application in phenoregion delineation. Int. J. Remote Sens. 38, 1720–1736.