HAL Id: tel-01751432
https://hal.univ-lorraine.fr/tel-01751432
Submitted on 29 Mar 2018
HAL is a multi-disciplinary open access archive for the deposit and dissemination of sci-entific research documents, whether they are pub-lished or not. The documents may come from teaching and research institutions in France or abroad, or from public or private research centers.
L’archive ouverte pluridisciplinaire HAL, est destinée au dépôt et à la diffusion de documents scientifiques de niveau recherche, publiés ou non, émanant des établissements d’enseignement et de recherche français ou étrangers, des laboratoires publics ou privés.
induced by a collapsing solution mining cavity: A
contribution for progress in hazard assessment of
underground cavities
Jannes Lennart Kinscher
To cite this version:
Jannes Lennart Kinscher. The analysis and interpretation of microseismicity induced by a collapsing solution mining cavity: A contribution for progress in hazard assessment of underground cavities. Earth Sciences. Université de Lorraine, 2015. English. �NNT : 2015LORR0022�. �tel-01751432�
AVERTISSEMENT
Ce document est le fruit d'un long travail approuvé par le jury de
soutenance et mis à disposition de l'ensemble de la
communauté universitaire élargie.
Il est soumis à la propriété intellectuelle de l'auteur. Ceci
implique une obligation de citation et de référencement lors de
l’utilisation de ce document.
D'autre part, toute contrefaçon, plagiat, reproduction illicite
encourt une poursuite pénale.
Contact : ddoc-theses-contact@univ-lorraine.fr
LIENS
Code de la Propriété Intellectuelle. articles L 122. 4
Code de la Propriété Intellectuelle. articles L 335.2- L 335.10
http://www.cfcopies.com/V2/leg/leg_droi.php
Ecole Nationale Sup´erieure des Mines de Nancy Laboratoire GeoRessources
´
ECOLE DOCTORALE : RP2E TH`ESE
pr´esent´ee en vue de l’obtention du grade de :
DOCTEUR DE L’UNIVERSIT´E DE LORRAINE en M´ecanique - G´enie Civil
par :
Jannes Lennart Kinscher
The analysis and interpretation of
microseismicity induced by a collapsing
solution mining cavity
A contribution for progress in hazard assessment of
underground cavities
Soutenu publiquement le 30 Janvier 2015 devant le jury compos´e de: Judith SAUSSE Professeur, Ecole des Mines de Nancy Pr´esident du jury
Aldo ZOLLO Professeur, Universit´e de Naples Rapporteur
Thorsten DAHM Professeur, Universit´e de Potsdam Rapporteur
Herve CUCHE Ing´enieur, SOLVAY Examinateur
Pascal DOMINIQUE Ing´enieur, BRGM Examinateur
Jack-Pierre PIGUET Professeur,Universit´e de Lorraine Directeur de th`ese
Isabelle CONTRUCCI Ing´enieur, INERIS Co-Directeur de th`ese
Pascal BERNARD Professeur, IPGP Paris Co-Directeur de th`ese
Jean Baptiste Joseph Fourier (21 March 1768 – 16 May 1830) The Analytical Theory of Heat, 1878
La r´ealisation de cette th`ese n’aurait jamais ´et´e possible sans le grand soutien, le conseil, et la patience de Jack-Pierre Piguet, Isabelle Contrucci, Pascal Bernard et Anne Mangeney. Merci Jack-Pierre : tu m’as permis de conserver un œil objectif sur les travaux de th`ese ! Merci Isabelle : je n’oublierai pas ton int´erˆet, tes suggestions, et ta motivation et tous tes efforts pour m’int´egrer dans la vie fran¸caise et dans le monde d’une entreprise ! Merci Pascal : si tu n’as rien compris, demande `a Pascal ! Tu m’as appris beaucoup! Anne : merci de m’avoir aid´e `a garder les pieds sur terre et de m’avoir appris la peinture.
My special thanks go to Thorsten Dahm and Aldo Zollo for their interest and review of this thesis. Mes remerciements vont ´egalement `a Judith Sausse, `a Pascal Dominique et `a Herve Cuche pour leur int´erˆet et leur participation dans le jury de cette th`ese. Je souhaiterais exprimer ma gratitude `a Pascal Bigarr´e, Christophe Didier et Xavier Daupley pour leurs participations et conseils dans plusieurs COPIL de th`ese. Je tiens `a remercier l’INERIS pour le financement de cette th`ese. Je remercie ´egalement le GISOS et SOLVAY pour la mise en place de ce projet extraordinaire qui m’a plu ´enorm´ement. Egalement un grand merci `a toute l’´equipe et les th´esards de l’INERIS, l’´ecole des mines, GEORESSOURCE et plus particuli`erement Virginie qui m’a soutenu beaucoup dans une situation compliqu´ee. Je remercie sinc`erement Alain Thoraval, Marwan Al Heib, Armand Lizeur et Moutaka Souley pour leur soutien, leur int´erˆet et leurs renseignements. Merci `a Phillipe Jousset pour la r´evision du Chapitre 2. I owe much gratitude to Simone Cesca for discussing, reading and reviewing Chapter 3 of this thesis. For many processing and imaging steps, the KIWI tools (Heimann et al., 2014) and the OBSPY tools (Beyreuther et al., 2010) were used. You guys did really an incredible good job!
Meine lieben Eltern, ich hoffe ihr wisst, dass diese Arbeit ausschließlich euer Werk ist. Danke auch an den Rest der Familie, und diejenigen, die mir von oben herab Gl¨uck gew¨unscht haben. Danke meine lieben Freunde f¨ur die vielen Besuche in Nancy: Henry, Otti, Hagen, Fabse, Hannes, Till, Malte, Suse, und alle weiteren die zur Hochzeit kamen. Merci beaucoup `
a mes amis nanc´eiens: Babel, Olivier, Romain, Julien, Bastian, Guillaume, Brice, Nadia et toutes les personnes que j’aurais obli´ees. Al final, agradezco mucho a mi esposa Pilar por
su amor, apoyo y por haber cargado mi cabezoncito que me hizo sentir mucho m´as ligero. Gracias, abrazos y besos tambi´en a mi familia en el otro lado del atl´antico.
Ground failures, caving processes and collapses of large natural or man-made underground cavities can produce significant socio-economic damages and represent a serious risk envis-aged by the stakeholders and municipalities. In order to improve our understanding of the mechanisms governing such a geohazard and to test the potential of geophysical methods to prevent them, the development and collapse of a salt solution mining cavity was moni-tored. This experiment was conducted by the research “Groupement d’Int´erˆet Scientifique sur l’impact et la S´ecurit´e des Ouvrages Souterrains” (GISOS), at the SOLVAY exploitation site of Cerville-Buissoncourt (Lorraine basin, France). The potential to create large- scale, shallow cavity structure at the study site is suggested from the presence of a stiff Dolomite layer, acting as a beam that keeps the overburden stable, and thus retards its collapse. During the experiment, an important catalogue (∼ 50, 000 event files) was recorded by a local high frequency microseismic network, installed by INERIS, which provides a unique opportunity to study in detail the microseismic response of a caving and collapsing underground cavity. However, ∼ 80% of the data comprised unusual swarming sequences with complex clusters of superimposed microseismic events. These waveforms could not be processed through au-tomatic standard, body wave phase based detection, location and source analysis routines. Further problems in signal processing arise from the limited network station coverage, short hypocentral recording distances and propagation and near-field effects. This thesis presents a detailed analysis and interpretation of this unique microseismic data base, using and adapting innovative methods proposed from tectonic, volcanic and mining seismic swarm studies. In the first part of this thesis, a probabilistic, automatic detection location design has been developed, able to resolve the spatio-temporal characteristics of microseismic swarms in a first order. In this approach, mainly signal polarization attributes were used to identify P wave phases. Event locations were then obtained by using the information of the corresponding polarization angles, as well as signal amplitudes, enabled by a detailed study of the attenua-tion characteristics, describing the amplitude decay with distance. Moreover, seismic source mechanisms and standard source parameters were investigated by comparing observed and synthetic wave forms, amplitude spectra and peak-to-peak amplitude ratios, assuming differ-ent standard source models. Within this source study, it was possible to assess the common
source mechanisms of many swarming events at once, using the observation from only one single three component station.
The second part of this thesis summarizes and discusses the results obtained by the devel-oped methods, as well as by detailed statistical analysis of the spatio-temporal and energetic microseismic attributes. The principal results are summarized as follows:
(i) microseismic events are comparable to small natural tectonic earthquakes, demonstrate a self- similar scaling behavior and are associated with moment magnitudes MW ranging
from around −3 to 1;
(ii) the entirety of microseismic sources represents dominant shear faulting (standard double-couple shear model) at the cavity roof, in the Dolomite layer and in the overburden. The presence of tensile faulting could not be observed from the dataset, but cannot be completely excluded;
(iii) this observation contradicts geomechanical models predicting a dominant mode of trac-tion failure in the center of the Dolomite layer;
(iv) source mechanisms for most microseismic events are remarkable stable and demonstrate a predominant thrust faulting regime with faults similarly oriented NW-SE, dipping around 35◦ − 55◦ , what might be related to the presence of systematically arranged pre-existing fractures;
(v) similar to tectonic earthquake swarms, the origin of microseismic swarming is suggested in an incapacity to sustain larger strains and to release larger stresses, what seems to be related to the mechanical constitution of the rock strata overlying the cavity (i.e. low strength materials);
(vi) caving and collapsing periods at the cavity roof are associated with systematic, self-reinforcing dynamics and have a distinct microseismic response, clearly observable from statistical analysis;
The performed analysis and interpretation of the microseismicity at Cerville-Buissoncourt has shown that microseismic monitoring is a useful tool to constrain the mechanical and dy-namical characteristics of an evolving and collapsing hazardous underground cavity. The here documented observations and trends provide new important constraints for the design of ad-equate geomechanical models that will improve hazard assessment at underground openings.
In future research, further investigation will assess the relationship between microseismic emissions and observed in-situ deformation including observations from seismic broadband data.
Les cavit´es souterraines d’origine naturelle ou anthropique, comme les mines actives ou aban-donn´ees, peuvent provoquer des affaissements importants et des effondrements qui peuvent avoir des cons´equences catastrophiques au niveau humain comme ´economique. Pour am´eliorer notre compr´ehension des m´ecanismes qui r´egissent ces risques g´eologiques, l’effondrement provoqu´e d’une cavit´e saline, cr´e´ee par dissolution, a ´et´e instrument´ee par diff´erentes m´ethodes g´eophysiques afin d’en tester l’efficacit´e. Cette exp´erimentation a ´et´e men´ee dans le cadre du ≪Groupement d’Int´erˆet Scientifique sur l’impact et la S´ecurit´e des Ouvrages Souterrains ≫(GISOS) sur le site de Cerville- Buissoncourt (Lorraine, France), exploit´e par SOLVAY. La cr´eation de cavit´es de grandes dimensions sur le site est suppos´ee possible grˆace `a la pr´esence d’un banc raide (banc de Dolomite) qui jouerait le rˆole d’une poutre soutenant le recou-vrement et retardant ainsi son effondrement. Pendant l’exp´erience, un vaste ensemble de donn´ees microsismiques (∼ 50.000 fichiers d’´ev´enements) a ´et´e enregistr´e par le r´eseau haute fr´equence install´e par l’INERIS. Cela constitue une occasion unique d’´etudier en d´etail la r´eponse microsismique du d´eveloppement d’une cavit´e souterraine jusqu’`a son effondrement. Toutefois, la majeure partie (∼ 80%) de ces ´ev´enements microsismiques sont non-isol´es, de type rafale, c’est-`a-dire constitu´es par des superpositions complexes de groupes d’´ev´enements. Le traitement de ces signaux particuliers n’est pas possible par des approches conventionnelles de d´etection, localisation (bas´e sur les temps d’arriv´ee des ondes de volume) et d’analyse `a la source. D’autres difficult´es sont apparues dans le traitement des donn´ees, `a cause de la r´esolution limit´ee du r´eseau `a courtes distances hypocentrales et des effets de propagation et de champ proche. La th`ese pr´esente une analyse et une interpr´etation d´etaill´ee de cette base de donn´ees microsismiques grˆace `a l’adaptation de m´ethodologies de traitement originales, issues des ´etudes d’essaims sismiques d’origine tectonique, volcanique et mini`ere.
La premi`ere partie de la th`ese a ´et´e consacr´ee au d´eveloppement d’une m´ethodologie de d´etection et localisation probabiliste automatique des ´ev´enements en rafale. La d´etection des ondes P dans les s´equences de rafales est r´ealis´ee grˆace `a une analyse automatique de la polarisation du signal, dans une bande de fr´equence donn´ee o`u les ondes S ne sont pas dominantes. Puis la localisation du signal est obtenue en combinant les informations des angles de polarisation et de d´ecroissance de l’amplitude du signal avec la distance. Cette
approche n´ecessite d’abord une calibration de l’att´enuation ´elastique et an´elastique du site, r´ealis´ee grˆace `a l’analyse d’un jeu de donn´ee de r´ef´erence. En outre, les m´ecanismes `a la source et leurs param`etres ont ´et´e ´etudi´es en comparant les formes d’ondes, les spectres en amplitude et les rapports d’amplitude observ´es et synth´etiques, en testant des mod`eles classiques de source sismique. D’autre part dans cette ´etude, il a ´et´e possible de contraindre le m´ecanisme `a la source commun d’essaims d’´ev´enements microsismiques en utilisant une unique sonde 3 composantes.
La deuxi`eme partie de la th`ese a ´et´e consacr´ee `a l’interpr´etation des r´esultats obtenus, compl´et´es par une analyse statistique d´etaill´ee des attributs des essaims microsismiques d’un point de vue spatio- temporel et ´energ´etique. Cette interpr´etation s’est appuy´ee ´egalement sur les autres donn´ees g´eophysiques et g´eom´ecaniques disponibles sur le site. Les r´esultats obtenus sont les suivants :
(i) les ´ev´enements microsismiques sont comparables `a des petits s´eismes tectoniques ayant un comportement auto-similaire et des magnitudes de moment variant entre -3 et 1;
(ii) l’ensemble des ´ev´enements microsismiques montre un m´ecanisme unique en cisaillement (double-couple) au toit de la cavit´e, dans la couche de Dolomite et dans le recouvrement. Le m´ecanisme en traction, bien qu’il n’ait pas ´et´e observ´e dans les donn´ees, ne peut pas ˆetre totalement exclu;
(iii) cette observation contredit les mod`eles m´ecaniques qui proposent une d´eformation domin´ee par les modes en traction dans la couche de Dolomite;
(iv) le m´ecanisme de cisaillement est remarquablement stable et est associ´e `a un r´egime en faille inverse d’orientation NO - SE, plongeant `a environ 35◦– 55◦. Ce ph´enom`ene est
probablement li´e `a la pr´esence de fractures pr´eexistantes sur le site;
(v) l’origine des essaims microsismiques est certainement due `a l’incapacit´e du syst`eme `a cr´eer des fractures de grandes dimensions capables de lib´erer des contraintes tr`es im-portantes. Cela est probablement li´e aux propri´et´es m´ecaniques du toit de la cavit´e;
(vi) les p´eriodes d’effondrements du toit de la cavit´e sont associ´ees `a une dynamique de for¸cage syst´ematique et montrent une r´eponse microsismique particuli`ere, qui peut-ˆetre d´ecrite par des lois statistiques.
Les travaux de recherche de cette th`ese confirment, que la surveillance microsismique peut ˆetre un outil puissant pour ´etudier les processus d’instabilit´e des cavit´es souterraines, mˆeme avec un nombre r´eduit de capteurs si des outils d’analyse adapt´es sont utilis´es. Ces r´esultats apportent des contributions importantes pour l’´elaboration de mod`eles m´ecaniques, qui per-mettront l’am´elioration de l’´evaluation des risques d’instabilit´es de cavit´es souterraines. Les travaux `a venir porteront sur des investigations d´etaill´ees des relations entre ´emissions micro-sismiques et mesures de d´eplacements in-situ (GPS, extensom`etres et tach´eom`etre) incluant des observations sismologiques large bande.
Summary vii
R´esum´e xi
List of Tables xix
List of Figures xxi
1 Introduction 1
1.1 Routine microseismic monitoring in mines . . . 2
1.2 Challenges and achievements of microseismic monitoring of inaccessible underground cavities 6 1.3 The Cerville-Buissoncourt project . . . 9
1.3.1 Geological, mechanical setting and cavity structure . . . 11
1.3.2 Local monitoring systems . . . 12
1.3.3 Monitoring data and different cavity evolution and mining stages . . . 13
1.3.3.1 Microseismic crisis 2008 (cavity roof growth) . . . 15
1.3.3.2 Microseismic crisis 2009 (induced cavity collapse) . . . 17
1.3.4 Challenges in analysis and interpretation of microseismicity . . . 19
1.3.4.1 Characteristics and classification of microseismic events . . . 19
1.3.4.2 Significant propagation effects (attenuation, refraction) . . . 23
1.4 Motivation, strategy and structure of this thesis . . . 28
2 Semi-automatic event detection and location 31 2.1 Classical location of a training set . . . 32
2.1.1 Probabilistic inversion procedure . . . 32
2.1.2 Results and discussion . . . 36
2.2 Detection and location using signal polarization characteristics . . . 38
2.2.1 Estimating the degree of linearly polarized energies . . . 39
2.2.2 P wave phase identification . . . 40
2.2.3 Probabilistic location based on polarization angles . . . 44
2.3 Location of microseismicity using amplitudes and an attenuation law . . . 47
2.3.1 Attenuation model . . . 47
2.3.2 Constraints on the attenuation parameters and propagation effects . . 48
2.3.2.1 Attenuation and scattering effects for differing source-receiver positions 48 2.3.2.2 Seismic velocities and Q factors . . . 49
2.3.2.3 Determination of the theoretical coefficient of geometric spreading 54 2.3.3 Amplitude calculation, correction, and distribution . . . 55
2.3.4 Calibration of an attenuation law (probabilistic forward model) . . . . 57
2.3.5 Probabilistic location based on amplitudes . . . 61
2.4 Re-location of the training set . . . 62
2.5 Detection and location in dense microseismic swarms . . . 65
2.6 A Semi-automatic detection and location design . . . 69
2.6.1 Detection and signal characterization using a spectral envelope . . . . 70
2.6.2 First application to the 2008 microseismic crisis: detection results . . 71
2.6.3 First application to the 2008 microseismic crisis: location results . . . 73
2.6.4 First application to the 2008 microseismic crisis: preliminary interpretation 76 3 Microseismic source characteristics 79 3.1 Previous microseismic source studies at near underground openings . . . 80
3.1.1 Seismic source models and challenges . . . 80
3.1.2 Solution mining and block caving . . . 82
3.1.3 Karst cavitation processes . . . 83
3.2 Cerville-Buissoncourt: evidence for consistent shear source mechanics . . . 84
3.2.1 Synthetic calculations . . . 86
3.2.2 Spectral characteristics . . . 88
3.2.3 Peak-to-peak amplitude characteristics . . . 90
3.2.4.1 Inversion approach 1: conventional use of amplitude spectra 98
3.2.4.2 Inversion approach 2: reverse source-receiver setting . . . 101
3.2.4.3 Inversion approach 3: using peak-to-peak amplitudes . . . . 105
3.2.5 Synthesis and discussion . . . 111
3.3 Re-consideration of the detection and location results . . . 115
3.3.1 Polarization-based detection . . . 115
3.3.2 Amplitude-based location . . . 117
3.4 Source scaling . . . 121
3.4.1 Method . . . 122
3.4.2 Results and discussion . . . 126
4 On the origin of swarming 131 4.1 Spatio-temporal evolution . . . 133
4.2 Classification from inter-event time distribution . . . 138
4.2.1 Higher recurrence mode: Internal collapsing dynamics . . . 141
4.2.1.1 Temporal energetic constitution . . . 141
4.2.1.2 Embedded fore- and aftershocks . . . 145
4.2.1.3 Discussion . . . 150
4.2.2 Lower recurrence mode: caving evolution and dynamics . . . 154
4.2.2.1 Comparison to strain in-situ data . . . 154
4.2.2.2 Temporal-energetic distribution . . . 155
4.3 Summary and outlook . . . 159
5 Microseismic evolution 163 5.1 Principal observations . . . 163
5.1.1 Presence of microseismic swarms . . . 165
5.1.2 Spatio-energetic distribution and attenuation changes . . . 167
5.1.3 Temporal-energetic distribution . . . 172
5.1.4 Source mechanism . . . 175
6 General conclusion and outlook 185
6.1 Analysis of microseismicity . . . 186 6.2 Characterization and interpretation of microseismicity . . . 188
6.3 Implications for hazard assessment and outlook . . . 191
7 Conclusion et perspectives g´en´erales 195
7.1 Analyse de la microsismicit´e . . . 196
7.2 Caract´erisation et interpr´etation de la microsismicit´e . . . 198
7.3 Implications pour l’´evaluation des risques et les perspectives . . . 201
Bibliography 203
A Glossary 229
B Supplementary Tables and Figures 231
C Theoretical seismic source theory 239
C.1 Equivalent body forces . . . 239 C.2 Characterization of the moment tensor . . . 242
C.3 Far-field approximation . . . 245
D Calculation of synthetic seismograms 247
D.1 Cylindrical symmetric media approximation . . . 247 D.2 Readjustment of the velocity model at Cerville-Buissoncourt . . . 249
2.1 Elastic characteristics for the major geological units . . . 35 2.2 Estimated velocities and Q-factors . . . 54
3.1 Readjusted velocity model . . . 88
B.1 Training set of 54 located events . . . 232
B.2 Training set of 20 located events . . . 233 B.3 P wave travel time difference for the 20 event training set . . . 234
B.4 90 events used for inversion approach 2 . . . 235
B.5 Source parameters for well located events . . . 236
D.1 Comparison to previous velocity models . . . 250
D.2 Parameter space for grid search on the velocity structure . . . 250
1.1 Study site location of the Cerville-Buissoncourt experimental project . . . 2 1.2 Microseismcity in mines . . . 4
1.3 Caving processes . . . 8
1.4 Monitoring instrumentation and mining exploitation method . . . 11 1.5 Microseismic network and installed extensometers . . . 14
1.6 Monitored data in the period February 2008 to February 2009 . . . 15 1.7 Monitored data in the period March to May 2008 . . . 16
1.8 Monitored data in the period 10th to 13th February 2009 . . . 18
1.9 Microseismic swarm example . . . 20
1.10 Precursor, doublet and multiplet phenomena . . . 22 1.11 ”Cigar” shaped events . . . 22
1.12 Resonance phenomena . . . 23 1.13 Difficulties in P wave phase picking . . . 25
1.14 Refraction effects . . . 26
2.1 Microseismic waveform example . . . 33 2.2 2-D velocity model . . . 34
2.3 Classical location for the training set . . . 36
2.4 Example of classical event location . . . 37 2.5 Travel times and polarization angles . . . 37
2.6 S and P wave amplitude ratios . . . 39
2.7 Example of P wave polarization analysis . . . 40 2.8 Distribution of linearity and polarization angles . . . 42
2.9 Mean spectral signal characteristics . . . 49
2.10 Cross-correlation example . . . 50 2.11 Seismic velocities from cross-correlation . . . 52
2.12 Q-factor determination . . . 53
2.13 Refraction related coefficient of geometric spreading . . . 56
2.14 Effects of attenuation on amplitudes . . . 57
2.15 Probabilistic estimates of n and Q . . . 60
2.16 Probability density functions for location . . . 64
2.17 Statistics of location errors . . . 65
2.18 Location of an isolated event swarming sequence . . . 67
2.19 Location of a tremor-like swarming sequence . . . 67
2.20 Location results for swarming sequence example 2 . . . 68
2.21 Location results for swarming sequence example 3 . . . 68
2.22 Spectral envelope function . . . 72
2.23 Spectral envelope detection in swarms . . . 72
2.24 Detection results of all used approaches in 2008 . . . 74
2.25 Spatio-energetic distribution of the 2008 microseismic crisis . . . 76
3.1 Source models for induced seismicity in underground mines . . . 81
3.2 Seismic source model for karst processes . . . 84
3.3 Typical short, pulse-like shaped event . . . 85
3.4 Setting and source-receiver configurations for used source inversion approaches 87
3.5 Station’s Z-component average spectra . . . 88
3.6 Inter-event spectral fit . . . 90
3.7 Observed T /ZR peak-to-peak amplitude ratios . . . 92
3.8 Radiation pattern for four potential source models . . . 92
3.9 Observed and synthetic T /RZ amplitude ratios . . . 94
3.10 SV/P and SV/SH wave amplitude ratios . . . 96
3.11 Results for inversion approach 1 . . . 99
3.12 Observed and synthetic amplitude spectra and waveforms . . . 101
3.13 91 selected events used for inversion approach 2 . . . 102
3.15 Observed and synthetic amplitude spectra and waveforms . . . 105
3.16 Observed amplitude ratios for station 62 . . . 106
3.17 Results for inversion approach 3 . . . 108
3.18 Comparison of observed and synthetic amplitude ratios for station 62 . . . . 109
3.19 Comparison of observed and synthetic amplitude ratios for station 63 . . . . 110
3.20 Simplified fault model at Cerville . . . 112
3.21 Comparison to ANDRA study site . . . 114
3.22 Comparison of detection capability and radiation coefficients . . . 116
3.23 Amplitude ratios and radiation coefficients . . . 118
3.24 Original and source effect corrected amplitude-based location results . . . 120
3.25 Pre-processing procedure before P waves spectrum calculation . . . 122
3.26 Examples of automatic fc and M0 determination . . . 124
3.27 Results of source parameter estimation . . . 127
3.28 Errors in source parameter determination . . . 128
4.1 Location results and migrations of the microseismic crisis in 2008 . . . 134
4.2 Migration trends within the microseismic crisis in 2008 . . . 135
4.3 Spatial distribution of seismic moment . . . 136
4.4 Simplified scenario of the cavity roof evolution in 2008 . . . 137
4.5 Probability density of inter-event times . . . 139
4.6 Temporal distribution of inter-event times in 2008 . . . 139
4.7 Inter-event distances . . . 140
4.8 Temporal distribution of the swarming sequence duration . . . 142
4.9 Swarm duration and sub-event number . . . 144
4.10 Swarm duration and seismic moment . . . 144
4.11 Embedded fore- and aftershocks . . . 146
4.12 Spatial extent of embedded aftershocks . . . 147
4.13 Spatial and energetic characteristics of embedded fore- and aftershocks . . . . 149
4.15 Cavity roof collapsing dynamics . . . 152
4.16 Extensometer data and low recurrence mode in 2008 . . . 156 4.17 Cumulative frequency - magnitude distribution for the crisis in 2008 . . . 157
4.18 The cumulative seismic moment release for the crisis in 2008 . . . 158
4.19 Short-term and long-term aftershock periods . . . 159
5.1 Data of cavity collapsing period in 2009 . . . 164
5.2 Spectrograms of swarming sequences in 2009 . . . 166 5.3 Epicenter location of swarming sequences in 2009 . . . 167
5.4 Location results for the collapsing period in 2009 . . . 168 5.5 Amplitude ratios of stations 62 and 63 . . . 170
5.6 Sesimic velocity and Q factor evolution . . . 171 5.7 Inter-event times of the collapsing period in 2009 . . . 172
5.8 Frequency-Magnitude distribution of the collapsing period in 2009 . . . 174
5.9 Cumulative seismic moment of the collapsing period in 2009 . . . 175 5.10 P, SV and SH wave ratios of the collapsing period in 2009 . . . 176
5.11 P, SV and SH wave ratios before the Dolomite failure . . . 177 5.12 P, SV and SH wave ratios during the Dolomite failure . . . 178
5.13 T /ZR amplitude ratios during the Dolomite failure . . . 179 5.14 Apparent stress evolution . . . 180
5.15 Schematic illustration of the cavity collapse evolution . . . 182
B.1 Amplitude ratios for major swarming sequences in 2008 . . . 231
C.1 The general dislocation model . . . 242
C.2 The nine force-couples of the moment tensor . . . 244 C.3 MT component orientation for DC, CLVD and ISO portions . . . 245
Introduction
Natural or man-made underground cavities, particularly when they are shallow, can provoke large-scale land subsidence and collapses accompanied by catastrophic social-economic im-pacts. The potential of passive microseismic monitoring to prevent such disasters is world widely discussed. Microseismic monitoring comprises the recording of seismic waves origi-nating from small-sized (< 100 m) perturbations within an elastic medium associated with magnitudes M ≤ 2 that usually cannot be felt. An evolving, ”pone to collapse” underground cavity environment is supposed to incorporate significant local stress changes (e.g. ruptures, block falls etc.) which generate microseismic sources. Supposing these microseismic sources are quantitatively recorded and understood, it might be possible to identify hazardous mech-anisms of the evolving underground cavity (precursor phenomena), which might allow for reliable collapsing risk assessment.
However, in practice the unambiguous identification of these precursors and reliable hazard assessment from recorded microseismic data are still far from being straightforward and rep-resents a major topic in recent research and technology development. In the following, the potential and shortcomings of microseismic monitoring of hazardous underground cavities are introduced by reviewing fundamental contributions of more than 20 years of experience from the mining sector (Section 1.1). Then, recent attempts and challenges of microseismic moni-toring about ”prone-to-collapse” scenarios are introduced (Section 1.2) including studies on hazardous, inaccessible cavities produced from natural and man-made dissolution processes and abandoned mine workings. By the documentation of these two groups of microseismic studies it is aimed to demonstrate that monitoring conditions can considerably differ, and how these conditions can affect the ability to quantify and interpret microseismic signals. In mines, microseismicity is widely induced and correlated with mining activity, and therefore the potential locations and mechanisms of the microseismic sources are relatively well known and often accessible what significantly facilitate the design of efficient microseismic network configurations. In the studies presented in Section 1.2, the monitored hazardous
ena and governing trigger mechanisms can be generally poorly predicted in space and time so that the design of efficient network configurations, data processing and interpretation of microseismic signals are often more complicated and partially ambiguous.
In this thesis, the potential and shortcomings of the microseismic monitoring technique are evaluated as part of the experimental project Cerville-Buissoncourt, east of Nancy, France (Fig. 1.1), as presented in Section 1.3. This experiment comprised continuous (5 years) multi parameter geophysical monitoring of the evolution and final collapse of single salt cavern, cre-ated from salt solution mining. In contrast to mines, at Cerville, microseismicity is supposed to be rather indirectly induced from steady continual fresh water injection so that the moni-tored caving processes and associated hazardous mechanisms are probably comparable with many other natural and man-made underground cavity environments as karst cavities or inac-cessible post-mining district. As a result, this specific exploitation method provide an unique opportunity to study the microseismic signatures of an continuously evolving hazardous un-derground cavity by means of a local microseismic network, whose results can be evaluated from other recorded geophysical parameters and geo-mechanical modeling back-analysis.
N
Nancy
France
100 m
Figure 1.1: Study site location of the Cerville-Buissoncourt experimental project. (Major panel) SOLVAY solution mining site. (Right upper panels) Geographic location in France.
1.1
Routine microseismic monitoring in mines
In mines microseismic monitoring was first applied in the early sixties (Cook, 1963) and has grown to a routine tool in daily mining hazard assessment (e.g. Ge, 2005). There is a vast
quantity of scientific literature of microseismic monitoring in mines and it is beyond of this thesis to review them all here, so only major general aspects of current research in this area are presented in the following. The success of the microseismic monitoring originates from favorable conditions for this technique as provided in most mining districts:
1. Microseismicity is often strongly correlated with the ongoing mining activity what is probably the result of mining induced changes in the local stress field (e.g. newly created excavation, fluid injection) leading to readjustments of the rock mass by elas-tic (e.g. elaselas-tic convergence of the stope) and inelaselas-tic deformation (seismic rupture) (e.g. Boettcher et al., 2009, Cook, 1963, Gibowicz and Kijko, 1994, McGarr, 1971a,b, Spottiswoode and Milev, 1998)
2. The origin of microseismicity and the interpretation of microseismic data are often definite, since microseismic sources are often directly accessible and can be com-pared with geological and petrological or other geophysical in-situ measurements (e.g. Hudyma and Potvin, 2010) (Fig. 1.2).
3. Mining seismicity show similar characteristics as natural earthquakes so that data pro-cessing tools and quantitative description of the mining events can be widely adapted from global seismological research (Mendecki, 1996).
Based on these favorable conditions it is often feasible to clearly discriminate and interpret the microseismic data and to develop appropriate seismic hazard assessment strategies that significantly reduced the rate of human and economical fatalities (Gibowicz, 2009). Most of these strategies are based on the statistical analysis of the microseismic catalog where mining events are quantitatively fully described by its source location, origin time and at least two other independent source parameters (Mendecki, 1996). These statistical analysis are usually based on Gutenberg-Richter (GR) frequency-magnitude relationships (adapted from global seismology), which predict the probability that a specific value of magnitude of a seismic event will exceed during the next specific number of time units (e.g. Kijko et al., 2001, Potvin and Hudyma, 2001).
One interesting example of such efficient mining hazard assessment comprises microseismic monitoring in block or panel caving mine operations (Fig. 1.2). This mining method take advantage of the gravitational potential of a naturally fractured rock (Brady, 2004) where blasts are used to initiate caving processes arising from induced changes in the local stress
regime, stress redistribution processes and gravity cause fracturing (e.g. Simpson, 1986). In this context, microseismic monitoring is conventionally used for tracking the cave propagation and identification of abnormally fractured, or highly stressed hazardous zones in the over-burden (e.g. Duplancic et al., 1999, Glazer and Hepworth, 2005, Hudyma et al., 2010, 2008). Such successful monitoring and hazard analysis is generally enabled by the installation of a comprehensive, high quality microseismic network comprising numerous stations installed in the overburden of the operation site. Thanks to these favorable monitoring conditions,
Block/panel caving Excavation mining g h i j
Figure 1.2: Microseismcity in mines. (left panels) (a)-(f) Example of successful microseismic event (black circles) discrimination and association with different source origins in an excavation mining environment, taken from Hudyma and Potvin (2010). (a) fault movement; (b) stress change causing rockmass fracturing near excavations; (c) stope overbreak; (d) contrast in rockmass material properties causing strain-bursting; (e) crushing of mine pillars; and (f) stress increase causing rockmass deformation. (right panels) (g)-(j) Cartoon of production and fracture evolution in the block caving Northparkes Mine, Australia, taken from Wuestefeld et al. (2011). (g) few events occur at new production tunnel; (h) tensile failure and horizontal fractures in early excavation stages; (i) tensile failure in the roof is accompanied by shear failure in the cave wall during breakthrough of the crown pillar; (j) large shear failures after production.
microseismic events can be precisely quantified in location and by their source parameters using simple traditional seismic processing methods as adapted from earthquake seismology. Based on such a high quality data set and a somewhat more advanced automatic shear wave splitting approach, it was even possible to monitor the spatio-temporal evolution of fracture orientations (Wuestefeld et al., 2010, 2011), which can provide very useful informations when analyzing the orientation and the current state of principal stresses in the overburden. On the other hand, the seismic response and signature in mines is generally unique and depends on the quantity and geometry of mining, the mining method, geological setting, and tectonic stress field (Milev and Spottiswoode, 2002, Spottiswoode and Milev, 1998). As a result, monitoring operators from different mining districts often use different seismic hazard assessment procedures what often lead to the question of general reliability. Indeed, mining induced microseismicity show partially different behaviors compared to natural earthquakes so that universal seismic hazard procedures as developed in earthquake seismology cannot always be adapted straightforward.
One of these different behaviors is that microseismicity is often non-uniformly distributed in space and time, forms nests and swarms and partially occur in from of doublet and multiplet events (Gibowicz, 2006, Phillips et al., 1996, Riemer, 2005). Next to these particularities, a major controversy in recent research concerns the ability of appropriate source scaling of mining induced events, which is one of the major requirements for efficient and adequate hazard assessment. In this context, many studies document a breakdown in source scaling for smaller earthquakes as for examples observed from bimodal GR frequency-magnitude distributions (e.g. Gay and Ortlepp, 1979, Gibowicz and Kijko, 1994, McGarr et al., 1989, Richardson and Jordan, 2002, Spottiswoode, 1989, Syratt, 1990). These authors suggest that smaller microseismic sources in mines, often called fracture-dominated events, deviate signifi-cantly in their rupture process as compared to larger friction-dominated events (e.g. shearing on pre-existing geological structures) where stress drops are observed to be independent of the seismic event size (seismic moment M0) (self-similarity, e.g. Aki and Richards, 2002, Scholz,
2002). In contrast, other studies found evidence that the GR-frequency-magnitude distri-bution holds even for nanoseismic and picoseismic mining induced events (M ∼ −4 to 0) (Kwiatek et al., 2011, Plenkers et al., 2010). In these studies, apparent deviations from self-similar scaling are not suggested in different source characteristics, but in the presence of blasting in the data, limitations of the instrumental recording bandwidth, and detection
ca-pability of the recording system and from wave propagation effects (e.g. Boettcher et al., 2009, Collins and Young, 2000, Ide et al., 2003, Ortlepp et al., 2005, Oye et al., 2005). For a further review of studies concerning the characteristics of microseismic sources in mines see Section 3.1.
1.2
Challenges and achievements of microseismic monitoring
of inaccessible underground cavities
A world wide topic in geohazard research concerns cavity environments formed by karstic or evaporitic dissolution processes which comprise a considerable hazard to produce large scale subsidence and sinkhole phenomena (e.g. Waltham et al., 2005), which can be of natural (e.g. Arkin and Gilat, 2000, Caramanna et al., 2008, Gutierrez et al., 2008, Johnson, 2005, Wachs et al., 2000) or man-made origin as commonly observed in former or active evaporite or carbonate mines (for a review see Whyatt and Varley, 2008), during salt solution min-ing and salt withdrawal operations (e.g. Barla et al., 1991, Ege, 1984, Mancini et al., 2009, Raucoules et al., 2003, Zamfirescu et al., 2003), as well as in artificial channel constructions (e.g. Fidelibus et al., 2011). These often catastrophic events are generally preceded by a progressively upward growing underground cavity structure, which then partially or totally collapse depending on the strength limit of the overlying rocks (Fig. 1.3a). The upward growth of the cavity is generally associated with a wide range of possible mechanisms that strongly depend on the geological setting and geochemical compositions, so that rates of cavity growth and subsidence vary significantly at each study site.
In this context, microseismic monitoring might be an attractive tool in order to detect dif-ferent evolution stages of the growing cavity structure which might be interpreted in terms of collapsing hazard. Indeed, a few studies reported precursor phenomena in form of mi-croseismic crisis before sinkhole formations (Land, 2009, Malovichko et al., 2009, Neunhofer, 1997). However, with exception of these studies, the potential of microseismic monitoring as a routine hazard assessment tool is still not sufficiently well evaluated and require further experience. It is still not well known which of the accompanying caving processes are visible or invisible for a microseismic monitoring system. Microseismic sources generated by upward migrating cavity structures are generally expected to be rather small and only detectable at rather short recording distances. In addition, some of the governing deformation processes are probably aseismic nature, especially when the cavity is progressing through unconsolidated
soils at lower depths associated with very weak elastic strengths.
In a theoretical and experimental study Malovichko et al. (2010) stated that microseismic emissions can be expected from larger rock detachment processes at the cavity roof and block falls on the cavity bottom. In their results, the authors further showed that microseismic recording and discrimination of these mechanisms is generally feasible also when accounting for significant contributions of stationary background noise. Indeed, the feasibility of measur-ing microseismicity apparently originatmeasur-ing from roof fracturmeasur-ing, block falls, and dissolution processes in karst and evaporite environments was already demonstrated by some few studies that used standard monitoring tools (Balland et al., 2009, Dahm et al., 2011, Hardy et al., 1986, Malovichko et al., 2009). In addition, the study of Wust-Bloch and Joswig (2006) pro-vides a good example of demonstrating the fact that the design of innovative networks, as small seismic array groups, and newly adapted processing tools can significantly help to achieve reliable recordings of pre-collapsing evolution stages of a cavity system situated in unconsolidated media. Thanks to these innovative tools and calibration experiments in the field, the authors were able to detect, locate and discriminate microseismic signals associated with different types of block falls in salt karst cavities the Dead Sea region (Fig. 1.3b). Some more monitoring experience of dissolution and caving processes was gained during ac-tive salt solution mining operations. Microseismic monitoring was already found to be an efficient tool in cases, where the dissolution processes and the formation of solution cavities was more difficult to predict, baring the risk of ground water contamination and subsidence phenomena (Bergery and Nayman, 2007, Guarisco, 1987, Maisons et al., 1997). For this re-spect, generally standard detection and location procedures were applied. Interestingly, at the Arkema-Vauvert salt field, Godano et al. (2009) demonstrated that from the usage of a sparse number of three component deeper bore hole stations they were able to retrieve reliable fault plane solutions (see also Section 3.1).
Another interesting microseismic data set was recorded during down shutting of the Ocnele Mari salt solution mine in Romania. In this study, similar to Cerville-Buissoncourt, a con-trolled collapse was initiated by brine pumping and sterile backfilling operations of the salt caverns in order to eliminate the collapsing hazard, threatening a near densely inhabited area (e.g. Zamfirescu et al., 2003). As the concerned collapsing area was relatively well known, an efficient microseismic monitoring network was installed beforehand to survey these op-erations (Trifu and Shumila, 2010). By subsequent evaluation of the obtained microseismic
(b) Detection, location and spectral classi cation of microseismic karst events after Wust-Bloch and Joswig (2006) Upward progressing cavity and subsequent sinkhole formation (a)
Figure 1.3: Caving processes. (a) Simplified illustration of an upward growing cavity into the overbur-den. (b) Qualitative spectral classification of seismic signal originating from karst processes, taken from Wust-Bloch and Joswig (2006).
data (2, 392 detected events) it was stated that the results from conventional microseismic monitoring and data analysis consistently reflected the expected trends in a collapsing salt mine environment. Accordingly, the spatial distribution of estimated source mechanisms, and deformation rates showed very characteristic pattern of a typical sinkhole formation (see also Section 3.1). Furthermore, the authors outlooked that further analysis with respect to the temporal contribution might allow to detect the initiation of the expected collapsing processes which could allow for better control of the present engineering activities.
Beside these rather encouraging monitoring examples, Branston (2003) reported significant challenges of local microseismic monitoring during salt solution operations of salt cavities in the United Kingdom. By using high frequency instruments, and short recording distances, the author documented the presence of unusually strong swarming activities what caused sig-nificant problems in standard processing steps as detection and location. Similar observations of such intensive microseismic swarming sequences were also reported from salt solution
min-ing operations in Italy (Emmanuelle Nayman, pers. communication). In addition, Branston (2003) stated that also rather more simple, isolated microseismic events showed signatures that significantly differ to usual seismograms of natural earthquakes what impeded the appli-cation conventional data processing tools. For instance, body wave phases as usually used for location were apparently affected by stronger attenuation effects induced by the brine filled cavity structure. In this respect, P wave onsets were often observed to be emergent and S wave even partially absent.
Such shortcomings in local microseismic recording are widely observed in monitoring stud-ies of dangerous rock slopes where often only a minor portion of the entire microseis-mic dataset can be successfully treated using routine analysis tools (e.g. L´evy et al., 2010, Mertl and Br¨uckl, 2007, Spillmann et al., 2007). General problems of accurate body wave phase picking are related to high attenuation effects, partial lack of S wave phases due to unusual source characteristics or near-field effects, P to S wave conversions associated with strong velocity contrasts, emergent P wave onsets, and precursory signals ahead of impulsive P waves. Next to these particularities, also intensive swarming sequences, called “multiple events” (Mertl and Br¨uckl, 2007, Spillmann et al., 2007), are frequently observed where P wave onsets are often covered by the coda of the preceding events.
1.3
The Cerville-Buissoncourt project
Recently, research started to focus on the survey of post-mining districts that represent risks to near inhabited areas, using of microseismic monitoring. Research and experi-ence in this respect was gained among others in the United States (Miller et al., 1988, 1989, Richards and Miller, 1988), Japan (Ogasawara et al., 2002a,b), Korea (Waltham et al., 2011), United Kingdom (Toon and Styles, 2004) but mainly in France (Bigarr´e et al., 2011, Contrucci et al., 2010, Couffm and Bigarr´e, 2003, Didier, 2008, Senfaute et al., 2000, 2008). In France, investigations in risk and hazard assessment of active and closed mining districts have been intensified since the 90’s, when these areas attract attention by causing ground failures and subsidence with fatal social consequences as building damages or catastrophic changes in the ground water constitution. Several of these catastrophic events occurred in the iron-ore basin in the Lorraine region, France, where decades of intensive excavation mining activity have been stopped and left old vast underground rooms and pillars beneath urban areas (e.g. Deck, 2002, Didier, 2008). The origin of these significant surface subsidence and
collapse events are generally related to a progressive rise of the ground water level into the abandoned excavated zones since water pumping was stopped with mine closure as well as to the failure of residual abandoned underground pillars.
In order to prevent these disasters, the French government initiated a post-mining risk man-agement including in-situ monitoring in urban regions based on geodetic and microseismic networks. The efficiency of these monitoring networks for hazard assessment is generally characterized by its detection capacity of dangerous failure mechanisms as well as its iden-tification. Current research aims continuously to improve this efficiency by studying the governing failure mechanisms and dynamics and its microseismic and geodetic signature in more detail (e.g. Didier et al., 2003). As an example, some of the governing failure mecha-nisms seem to be associated with aseismic deformation processes as it was observed above an abandoned mine in the town of Angevillers, NE France. A longer period of slow subsi-dence was detected by local geodetic measurements meanwhile no significant increase in the microseismic rate was observed (Isabelle Contrucci, pers. communication). Thus, in terms of efficient microseismic monitoring a better understanding of the recorded microseismic data is indispensable, what might be achieved by gaining more experience in its analysis and interpretation in similar environments.
In this context, microseismic and other geophysical monitoring tools were ap-plied to a salt cavity that was created by salt dissolution mining (a SOLVAY exploitation) as part of a large multi-parameter research project founded by the research “group for the impact and safety of underground works” (GISOS, http://gisos.ensg.inpl-nancy.fr/gisos-info-en/gisos-info-en/) at Cerville-Buissoncourt in Lorraine, France (Cao, 2011, Contrucci et al., 2011, Daupley et al., 2010, Klein et al., 2008, Lebert et al., 2011, Mercerat, 2007, Mercerat et al., 2010) (Fig. 1.1 and 1.4). The continuous growth of the cavity was monitored from 2004 until 2009, when the cavity reached its critical size and a “controlled” collapse was initiated by brine pumping. This experimental project provides a unique opportunity to evaluate the potential of microseismic monitoring and mechanical models with respect to a growing and collapsing cavity system in a salt solution mining environment (e.g. Daupley et al., 2005), as well as similar “prone to collapse” scenarios (Section 1.2).
Nancy Injection wells 2007-2009 Injection wells untill 2003 Contours:
outer cavity border 240 m depth (2004)
cavity geometry (2004)
collapsed zone (14th Feb 2009)
Marly sandy overburden Dolomite Anhydritic Marls Salt Cavity structure 2004-2007 Salt dissolution Geology and channel and drilling system
~50 m Pressurized
Brine ~200 m Moderate injection 2007-2009
Signi cant cavity roof growth in 2008
Induced collapse by brine pumping Feb 2009 Exploitation wells ~50 m Cummunication channel Fresh water Saturated brine (a) (b) (c) (d) (e) Collapsed Marls Brine 100 m PGR1 PGR2 PGR3 Cavity roof depth contours 190 m 195 m
Figure 1.4: Monitoring instrumentation and mining exploitation method. (a) Monitoring instrumentation and surface and underground extensions of the solution mined cavity structure, taken from Lebert et al. (2011). (b) Simplified illustration of local geology, the ”channel and dilling” technique and different evolution mining stages (c-f).
1.3.1 Geological, mechanical setting and cavity structure
At Cerville-Buissoncourt, the geology is formed by the Triassic salt formation (M´egnien, 1980), constituted of a sub-horizontal layered sub-marine sequences: a marly-sandy layer (0 to 119 m depth), a thin but competent (stiff) Dolomite layer known as the Beaumont
Dolomite (119 to 127.5 m depth), a poorly-consolidated layer of anhydritic Marls (127.5 to 183.5 m depth), and the salt deposit which reaches its final depth at 348 m (Fig. 1.4). During 1997–2003, mining was initiated using the channel and drilling technique where water was injected via two parallel, aligned well casings into the base of the salt deposit what caused significant dissolution processes that formed a cavity structure. In the beginning of monitoring in 2004, the cavity was located at a depth of around 250 m, within the salt layer. Its geometry was initially evaluated using sonar measurements obtained by SOLVAY (2004), revealing 150 – 200 m of lateral extensions and a maximum cavity height of around 50 m (Fig. 1.4). The shape of the cavity structure is rather asymmetric with smaller vertical extensions to the west and the highest extensions to the east.
By means of mechanical numeric modeling, it could be shown that the mechanical stability of the cavity and the overburden is mainly controlled by the elastic strength of the Dolomite layer (Daupley et al., 2005, 2013, Mercerat, 2007) (Fig. 1.4). This Dolomite layer is generally more stiff and competent compared to other stratigraphic units in the study area and generally enables the creation of larger underground cavity formations. Mercerat (2007) found critical value of maximal flexure (< 10 cm) for this layer that when overcome, would lead to its complete failure and a subsequent collapse of the overburden. In addition, the cavity is further stabilized by the pressurized brine, inducing a significant pressure on the cavity walls and on the overburden (∼ 2.0 MPa) (Mercerat, 2007).
1.3.2 Local monitoring systems
From 2005 to 2009 the evolution and final cavern collapse was monitored by a SYTGEM multi-parameter system (Klein et al., 2008) including a high-resolution microseismic network linked to a surface displacement measurement system (Fig. 1.4 and 1.5). Since March 2005, the microseismic network constituted three one component, plus two installed in 2008 (station 7 and 8; Fig. 1.5), and four 3-component 40 Hz geophones (GS-20DH, Geospace). The geophone’s frequency response is flat and clean up to 400 Hz, and declines towards lower frequencies below 40 Hz. Geophones were cemented into boreholes and equally distributed around the solution cavern where three geophones were installed in a single vertical bore hole directly at the center above the cavern.
Due to the considerable number of channels and the high sampling frequency, the acquisition system operated in a triggering mode adjusted to the static background noise level. Two data
sets, one consisting of triggered event files (1 s length and 10 kHz sampling before 12 February 2008 and 1.5 s and 5 kHz after 12 February 2008), and one consisting of continuous data with 200 Hz sampling was recorded in February 2009. In this thesis, temporally overlapping triggered event files were merged. In addition, later in summer 2008, three Guralp CMG40-TD broadband seismometer (0.016 to 50 Hz frequency band, 100 Hz sampling rate) have been installed in 1 m deep holes (Jousset and Rohmer, 2012).
A surface displacement monitoring system was installed in 2008 (Klein et al., 2008) (Fig. 1.4). The system constituted a high resolution infra-red tacheometer (±5 mm, vertical and horizontal) associated with a recording line (17 targets) across the expected collapse area and a high resolution GPS-Real Time Kinematic (RTK) instrument (1 measurement/second ; ±5 mm) to precisely monitor subsidence.
Deformation measurements at deeper levels were provided by a set of three extensometers installed in the same drill hole as microseismic station 62 and 63 which were placed above (113 m), inside (125 m), and below (129 m) the Dolomite layer (Fig. 1.4 and 1.5). In addition, also one gravimeter (15 s sampling rate), and hydro-mechanical measurements were obtained by means of three hydrophones (30 Hz to 3 kHz, 3 to 30 kHz, and 30 to 180 kHz frequency bands), and piezometers placed in the Rhaetian aquifer inside a sandstone at 60 m depth (Fig. 1.4).
1.3.3 Monitoring data and different cavity evolution and mining stages
The different mining and cavity evolution stages and the associated monitoring data is briefly introduced in the following sections. For a more detailed review of the entire project history, see Cao (2011).
The project history can be generally classified into three different periods. The first period of the project comprised a pressure transient experiment in 2005 and 2007 by partially lowering the brine in the cavity which was widely analyzed and modeled by Mercerat (2007). The second period comprised a major microseismic crisis recorded in 2008 where simultaneously a significant vertical growth of the cavity roof was monitored (Fig. 1.6 and 1.7). The third period comprised the major microseismic crisis in 2009 associated with the controlled cavity collapse (Fig. 1.6 and 1.8).
For the two latter major crises a total data set of around 50, 000 triggered event files was recorded while for the first project period only a minor amount of microseismicity was
Proile A Proile B
(d) Anchor borehole extensometer setting
Easting [m] 1-comp geoph. 3-comp geoph. Ref. point surface U1 (113 m) U2 (125 m) U3 (129 m) Pro le A Pro le B U 1-3
Figure 1.5: Microseismic network and installed extensometers. (a-c) The stations (triangles, named by numbers) of the microseismic network, cavity structure, and the major geologic layers. The border of the collapsed cavity area (dashed circle) in 2009 (a) is taken from Lebert et al. (2011). Northing and easting are given in meters relative to a reference point X = 892900 m and Y= 116000 m defined by the Lambert 1 Nord (NTF, Paris) coordinate system. (b,c) Sonar measurements (small circles) demonstrate the extension of the cavity roof (dotted lines) after the microseismic crisis in 2008, compared to the initial cavity roof extension in 2004 (thick black continuous lines). (d) Image of the used anchor borehole extensometer instrument type (left panel) and the illustration of the three anchor points fixed above, within and below the Dolomite layer measuring the displacement U relative to a reference point at the surface (right panel).
recorded. This thesis generally focused only on the last two periods in 2008 and 2009, when the monitoring network installation was completed. If interested in the first project period the reader is mainly referred to the study of Mercerat (2007), and Mercerat et al. (2010).
# tri g g er ed ev en t les Displace-ment [mm] Displace-ment [mm] Extenso-meter GPS
Altitude Northing Easting
U1 (113 m) U2 (125 m) U3 (129 m) (Dolomite 119 - 127 m) (a) (b) (c) Cu m. # tri g g er ed ev ten t ✁ les
Monitoring data set 2008-2009
Date-Time [yy/mm/dd] UTC Long apparent aftershock period
Major microseismic crisis 2008 (cavity roof growth)
Major microseismic crisis 2009 (induced collapse)
Minor microseismic crisis befor collapse
(Jan. 2009)
Figure 1.6: Monitored data in the period February 2008 to February 2009. (a) Number and cumulative number of recorded triggered event files. (b) Displacement recordings U of the anchors of the borehole extensometer installed above (U1), inside (U2), and below (U3) the Dolomite layer (e.g. Fig. 1.4 and 1.5). (c) Data of one GPS station placed above the center bore hole close to microseismic station 61 (Fig. 1.4). Negative displacement values in altitude (black points) indicate downward soil movements (subsidence).
1.3.3.1 Microseismic crisis 2008 (cavity roof growth)
After solution mining was placed in a standby mode from 2004 to 2007 (Mercerat, 2007, Mercerat et al., 2010), it was resumed in June 2007 by moderate water injections at well cases located 200 − 300 m further north of the cavity structure (Fig. 1.4 and 1.5). In the following period, between March and May 2008, a significant vertical development of the cavity height, of about 50 m, was recorded by periodic sonar measurements obtained along two profiles A and B (Fig. 1.5 and 1.7). This cavity growth was mainly associated with the caving processes and failures of the anhydrite Marl layer at the cavity roof located below the Dolomite layer (e.g. Fig. 1.4), striking an estimated volume of ∼ 500, 000 m3 of material
(Klein et al., 2008).
The ∼ 50 m heightening of the cavity roof in 2008 was accompanied by a clear cascade-like increase in the seismic activity of around 6, 000 event files recorded in March, 7, 000 files recorded in April, and around 1, 000 files recorded in May (Fig. 1.7) (Klein et al., 2008). The microseismic activity can be classified into three major periods with apparent continuously increasing microseismic activity while the third period can be interpreted as a mainshock as associated with two major seismic activity peaks on the 3rd and 4th of April 2008, at 9 p.m. and 8 a.m., respectively, which are then followed by an apparent aftershock sequence (Fig.
Figure 1.7: Monitored data in the period March to May 2008. (a)-(c) For data description see caption of Figure 1.6. (d)-(e) Vertical cavity roof growth (max. ∼ 50) observed from periodic sonar measurement along the exploitation profiles A and B (e.g. Fig. 1.4 and 1.5).
1.6 and 1.7).
It is very interesting to note that almost each major peak of apparent activity in each period correlated with a simultaneous increase in the brine level observed at the exploitation wells which are without any doubt related to massive block falls into the cavity. From this obser-vation it can be generally concluded that microseismicity has a clear relation to the governing caving processes.
In addition, also small magnitudes of surface subsidence (in the order of 1 cm) could be ob-served from the GPS curve, which become more important after the microseismic crisis (Fig. 1.6 and 1.7) (Klein et al., 2008). This observation already indicate that some deformation mechanisms in the overburden seem to be rather aseismic or dominated by lower frequen-cies, as not resolvable form the high frequency geophones. Contrastingly, smaller extensive deformation rates could be observed from the extensometer data (in the order of 1 cm) that seem to be roughly correlated with microseismic activity (Cao, 2011). This observation
fur-ther confirmed the idea that microseismicity is mainly related to failure processes at the cavity roof (Cao, 2011, Contrucci et al., 2011) which is followed by an elastic response of the Dolomite layer (possibly elastic flexure) which was consistently observed and modeled during the transient pressure experiments in 2005 and 2007 (Mercerat, 2007).
1.3.3.2 Microseismic crisis 2009 (induced cavity collapse)
In February 2009 the cavern reached its critical size which risked to provoke a gravity col-lapse from the load of the overburden so that finally the cavern colcol-lapse was induced by progressively lowering the brine level (Fig. 1.8). Before brine pumping started, a minor mi-croseismic crisis was recorded in January 2009 (Fig. 1.6). When brine pumping was initiated (10th February 2009 at 06:00 a.m.), more than 30.000 triggered event files were recorded dur-ing three days before the final occurrence of the surface collapse (13th of February) (Fig. 1.8). From the number of triggered event files, three major peaks in microseismic activity could be observed starting the 11th of February after the second pumping stage (11th February 2009 at 04:00 a.m.) (Contrucci et al., 2011). These three major episodes are also associated with clear increases in the subsidence rate with up to several meters per day (Fig. 1.8).
The first major peak of microseismic activity is considered to be due to massive marly cav-ern roof falls from below the Dolomite layer (Contrucci et al., 2011). In addition, this first peak in apparent microseismic activity was consistently observed from broadband records by Jousset and Rohmer (2012) and was interpreted to be triggered by Rayleigh wave trains generated from a distant large earthquake (M ∼ 7) in Indonesia. The most important factor in the causation of the induced collapse in February 2009 is seen in the failure of the Dolomite layer (Contrucci et al., 2011, Jousset and Rohmer, 2012). Its failure is probably associated with the second and highest peak in microseismic activity observed during the collapse ini-tiation (Fig. 1.8). Correspondingly, loud acoustic noises could be heard on the study site, which were followed by significant acceleration in the subsidence rate (e.g. GPS data Fig. 1.8), the breakdown of station 63, and a successive breakdown of the extensometer stations (Fig. 1.8). The third peak in microseismic activity, is marked by highest acceleration in the subsidence rate and represents the final ground surface collapse leaving a circular crater with a diamter of ≤ 150 m (Fig. 1.4).
As a general interpretation of the entire microseismic data set it was concluded that microseis-micity before the collapsing stage in 2005, 2007, 2008 and 2009 is related to rock falls, debris
flows, and dropped rocks from the cavern roof below the competent Dolomite layer (e.g. Cao, 2011, Contrucci et al., 2011, Klein et al., 2008, Mercerat et al., 2010). Data analysis of the collapsing period in 2009, somewhat surprisingly, did not indicate significant changes in the microseismic data characteristics and no precursor pattern could be identified (Cao, 2011, Contrucci et al., 2011). Most significant changes in the microseismic regime are mainly seen in the increasing amounts of cumulative energy, event number and partial rapid increases of the dominant frequency in the seismograms. However, such pattern have been also observed in microseismic crisis before the collapse period (Cao, 2011, Mercerat et al., 2010). This ob-servation is in contradiction with local mechanical models (Daupley et al., 2005, Mercerat, 2007), stating that the deformation and failure of the competent Dolomite layer should be clearly associated with brittle ruptures, and therefore significantly differ from deformation mechanisms expected in the less consolidated, fractures marls layers at the cavity roof.
Microseismic crisis 2009: Induced collapse
# tri g g er ed ev en t les Displace-ment [mm] Displace-ment [mm] Bri n e lev el [m] (s u rfa c e a t 230 m) Extenso-meter GPS Altitude Northing Easting U1 113 m U2 125 m U3 129 m (a) (b) (c) Normalized cum. # triggered event ✁les (A) 1st pumping (B) 2nd pumping (C) 3rd pumping (E)
brine eruption at surface (D) Dolomite failure pump. stop pump. start pump. stop pump. start Rayleigh waves Indonesian M~7 eartqhake (Jousset and Rohmer 2012)
breakdown station 63
sucessive extensometer breakdown (from below to above of the Dolomite)
GPS breakdown at surface
(A) - (B) well (C) (D) (E)
water level (d) Date-Time [mm/dd HH:MM] UTC artesian eruption
Figure 1.8: Monitored data in the period 10th to 13th February 2009. (a)-(c) For data description see caption of Figure 1.6. (a) the cumulative number of triggered event files is normalized (dashed line), while the brine level (blue line) is shown on the right Y axis. (d) simplified block model showing the different evolution stages of the induced collapse in February 2009, taken and modified from Daupley et al. (2010) and Lebert et al. (2011).
1.3.4 Challenges in analysis and interpretation of microseismicity
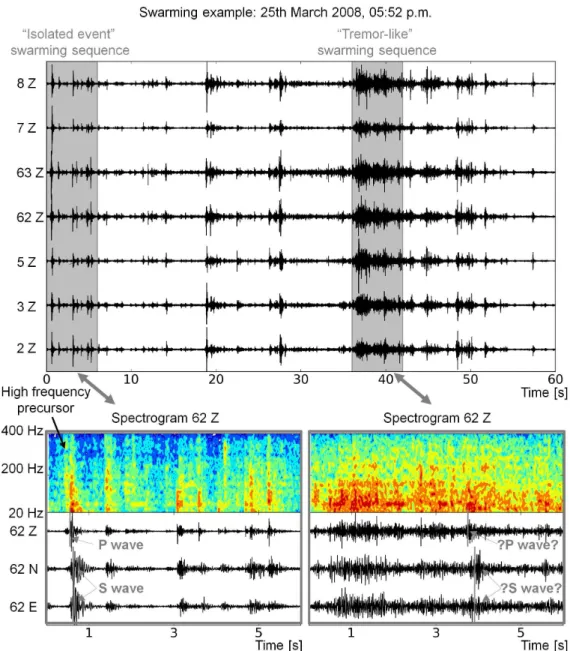
Initial analysis of the microseismic data set implied various applications of body wave phase-based detection and location routine tools as they are commonly used in mining and global seismology (Cao, 2011, Contrucci et al., 2011, Klein et al., 2008, Mercerat, 2007, Mercerat et al., 2010). Among others, these analyses comprised automatic P-wave phase picking approaches based on the STA/LTA technique by Allen (1982). In addition, several 1-D and also 3-D velocity models were developed to improve event location by means of calibration shots (Cao, 2011, Contrucci et al., 2011, Mercerat, 2007, Mercerat et al., 2010) , active seismic tomography (Kosecki et al., 2010, Piwakowski et al., 2006, Suffert, 2006), as well as constraints from other geophysical parameters (Coccia et al., 2013). For hypocenter determination, in all studies a probabilistic maximum likelihood inversion approach was ap-plied (Tarantola and Valette, 1982) by considering misfits (l2-norm but also the EDT-norm (Pinsky et al., 2008)) between observed and synthetic body wave arrival times (mostly P waves) and optionally of their polarization angles (Contrucci et al., 2010) that were mini-mized by means of the Oct-Tree nonlinear location method (Lomax and Curtis, 2001). However, similarly to the study of Branston (2003) (Section 1.2), only a minor portion of the entire microseismic dataset, approximatively 20%, could be successfully treated using these analysis tools. One major problem in this respect is the dominance of unusual swarming sequences (Fig. 1.9) which are alike to “multiple events” as observed in rock slope stud-ies (Mertl and Br¨uckl, 2007, Spillmann et al., 2007). These microseismic swarms are formed by dense and complex event clusters, where P wave onsets are often covered by the coda of the preceding events what impede the application of automatic body wave phase based detection and location tools. Next to microseismic swarming, also problematic event signa-tures, propagation effects (attenuation, refraction) and local monitoring conditions strongly hinder efficient automatic data processing which I will present and discuss in the following Sections 1.3.4.1 and 1.3.4.2, respectively. Therein, the discussion is generally based on basic spectro-temporal microseismic signal observations, partially located microseismic data sets (Cao, 2011) and synthetic seismogram calculations.
1.3.4.1 Characteristics and classification of microseismic events
Regardless of the considered periods of microseismic activity (Section 1.3.3), swarming se-quences represent around 80% of the recorded data with durations of the order of 5–200 s