HAL Id: hal-02384902
https://hal.archives-ouvertes.fr/hal-02384902
Submitted on 28 Nov 2019
HAL is a multi-disciplinary open access
archive for the deposit and dissemination of
sci-entific research documents, whether they are
pub-lished or not. The documents may come from
teaching and research institutions in France or
abroad, or from public or private research centers.
L’archive ouverte pluridisciplinaire HAL, est
destinée au dépôt et à la diffusion de documents
scientifiques de niveau recherche, publiés ou non,
émanant des établissements d’enseignement et de
recherche français ou étrangers, des laboratoires
publics ou privés.
Distinctive Representation of Mispredicted and
Unpredicted Prediction Errors in Human
Electroencephalography
Yi-Fang Hsu, Solène Le Bars, Jarmo Hämäläinen, Florian Waszak
To cite this version:
Yi-Fang Hsu, Solène Le Bars, Jarmo Hämäläinen, Florian Waszak. Distinctive Representation of
Mispredicted and Unpredicted Prediction Errors in Human Electroencephalography.
Journal of
Neuroscience, Society for Neuroscience, 2015, 35 (43), pp.14653-14660.
�10.1523/JNEUROSCI.2204-15.2015�. �hal-02384902�
Behavioral/Cognitive
Distinctive Representation of Mispredicted and Unpredicted
Prediction Errors in Human Electroencephalography
Yi-Fang Hsu,
1,2,3Solene Le Bars,
1,2Jarmo A. Ha¨ma¨la¨inen,
4and Florian Waszak
1,21Universite´ Paris Descartes, Sorbonne Paris Cite´, 75006 Paris, France,2Centre National de la Recherche Scientifique, Laboratoire Psychologie de la Perception, Unite´ Mixte de Recherche 8242, 75006 Paris, France,3Department of Educational Psychology and Counselling, National Taiwan Normal University, 10610 Taipei, Taiwan, and4Jyva¨skyla¨ Centre for Interdisciplinary Brain Research, Department of Psychology, University of Jyva¨skyla¨, 40014 Jyva¨skyla¨, Finland
The predictive coding model of perception proposes that neuronal responses are modulated by the amount of sensory input that the
internal prediction cannot account for (i.e., prediction error). However, there is little consensus on what constitutes nonpredicted
stimuli. Conceptually, whereas mispredicted stimuli may induce both prediction error generated by prediction that is not perceived and
prediction error generated by sensory input that is not anticipated, unpredicted stimuli involves no top-down, only bottom-up,
propa-gation of information in the system. Here, we examined the possibility that the processing of mispredicted and unpredicted stimuli are
dissociable at the neurophysiological level using human electroencephalography. We presented participants with sets of five tones in
which the frequency of the fifth tones was predicted, mispredicted, or unpredicted. Participants were required to press a key when they
detected a softer fifth tone to maintain their attention. We found that mispredicted and unpredicted stimuli are associated with different
amount of cortical activity, probably reflecting differences in prediction error. Moreover, relative to predicted stimuli, the mispredicted
prediction error manifested as neuronal enhancement and the unpredicted prediction error manifested as neuronal attenuation on the
N1 event-related potential component. These results highlight the importance of differentiating between the two nonpredicted stimuli in
theoretical work on predictive coding.
Introduction
The predictive coding model of perception postulates that
per-ception entails two distinct neurocomputational components,
the top-down propagation of prediction and the bottom-up
propagation of prediction error (
Rao and Ballard, 1999
;
Friston,
2005
,
2009
). Specifically, the flow of information takes place
be-tween multiple hierarchical levels harboring both
representa-tional units and error units (
Egner et al., 2010
;
Arnal and Giraud,
2012
). While the representational units encode prediction about
the causal structure of the environment and feed it backward to
the next lower level, the error units encode sensory input that
prediction fails to explain as prediction error and communicate it
forward to the next higher level. Such prediction error is believed
Received June 8, 2015; revised Sept. 16, 2015; accepted Sept. 26, 2015.
Author contributions: Y.-F.H., J.A.H., and F.W. designed research; S.L.B. performed research; Y.-F.H. and J.A.H. analyzed data; Y.-F.H., S.L.B., J.A.H., and F.W. wrote the paper.
This work was supported by the European Research Council under the European Union’s Seventh Framework Programme (Grant FP7/2007–2013/ERC Grant 263067). We thank the Paris Descartes Platform for Sensorimotor Studies (Universite´ Paris Descartes, Centre National de la Recherche Scientifique, INSERM, Re´gion Ile-de-France) for supporting the experimental work presented here.
The authors declare no competing financial interests.
Correspondence should be addressed to Yi-Fang Hsu, Laboratoire Psychologie de la Perception, 45 rue des Saints-Pe`res, 75006 Paris, France. E-mail:[email protected].
DOI:10.1523/JNEUROSCI.2204-15.2015
Copyright © 2015 the authors 0270-6474/15/3514653-08$15.00/0
Significance Statement
The current research seeks to dissociate the neurophysiological processing of two types of “nonpredicted” stimuli that have long
been considered interchangeable: mispredicted and unpredicted stimuli. We found that mispredicted stimuli, which violate
predictions, and unpredicted stimuli, which lack predictions, are represented distinctively in the brain. The results will influence
the design of experiments on the predictive coding mechanism, in which the contrast between predicted and “nonpredicted”
conditions should be specifically defined to reveal the prediction error proper. This is of general interest because it concerns the
logic of research investigating all levels of processing (including perceptual, motor, and cognitive processing) in many
neurosci-entific domains.
to modulate a range of neuronal responses
(
den Ouden et al., 2012
).
Within this framework, as recently
pointed out by
Arnal and Giraud (2012)
,
there is a conceptual difference between
mispredicted and unpredicted stimuli
(
Fig. 1
A). In particular, they proposed
that mispredicted stimuli are associated
with larger prediction error because
pre-diction fails to match with sensory input,
inducing both prediction error generated
by prediction that is not perceived and
prediction error generated by sensory
in-put that is not anticipated. Conversely,
unpredicted stimuli are associated with
smaller prediction error because there is
only the latter type of prediction error:
sensory input that is not anticipated.
Meanwhile, predicted stimuli are
associ-ated with minimum prediction error
be-cause prediction explains away sensory
input.
Note that this reasoning presupposes
that the representation of prediction is
discrete—that is, precisely defined. In
this case, a correct prediction perfectly
matches with the sensory input, canceling
out the bottom-up flow of information. However, it is possible
that prediction is not represented in an all-or-none manner.
In-stead of predicting exclusively the most likely upcoming event,
the brain is more likely to represent prediction as a probability
distribution (
Friston, 2009
) in one or both of the following ways.
First, the representation of prediction might be based on codes
that are to a certain degree imprecise in the sense that the
activa-tion in each representaactiva-tional unit is distributed over a set of a
continuum of predictions. This would be similar to the
popula-tion coding scheme involving neurons with a Gaussian tuning
curve in representing sensory input (
Bitterman et al., 2008
).
Here, predicted stimuli trigger prediction error to the extent that
the probability function representing the prediction is wider than
the probability function representing the sensory input (
Fig. 1
B).
Second, the representation of prediction might mimic the
regu-larities of the environment, which not only codes the most likely
upcoming event, but also other events to a lesser degree.
There-fore, when a “predicted” stimulus is presented, there is always
some amount of prediction error resulting from the unfulfilled
part of the prediction (
Fig. 1
C).
In both of the aforementioned scenarios, predicted stimuli
should trigger medium prediction error because prediction is
represented as a probability distribution that inevitably induces
some amount of prediction error. Therefore, although both
mis-predicted and unmis-predicted stimuli trigger prediction error, their
relation to predicted stimuli may be distinct. Compared with
predicted stimuli, mispredicted prediction error would manifest
as neuronal enhancement, whereas unpredicted prediction error
would manifest as neuronal attenuation given the absence of
pre-diction in this case.
Here, we presented participants with sets of five tones in
which the frequency of the fifth tones was predicted,
mispre-dicted, or unpredicted and assessed the ensuing prediction error
response with electroencephalography (EEG). If the processing
of mispredicted and unpredicted stimuli are indeed different,
they should be associated with different amount of cortical
activ-ity, particularly in relation to the N1 event-related potential
(ERP) component, which is typically considered an
electrophys-iological indicator for automatic predictive processing (for
re-view, see
Bendixen et al., 2012
). Moreover, if predictions are
represented in a probabilistic manner, the amount of cortical
activity triggered by predicted stimuli should be in between the
cortical activity to mispredicted and unpredicted stimuli.
Materials and Methods
Participants
Twenty-one healthy volunteers (average age 24; seven males; 15 right-handed) with no history of neurological, psychiatric, or visual/hearing impairments as indicated by self-report participated in the experiment. Participants gave written informed consent and were paid for participa-tion. Ethical approval was granted by the Comite´ de Protection des Per-sonnes Ile de France II. One participant was excluded from data analysis for having⬍50% artifact-free trials in any of the conditions of interest, leaving 20 participants in the final sample (average age 25; seven males; 14 right-handed).
Stimuli
Seven sinusoidal tones with a loudness of 80 phons (i.e., 80 dB for tones of 1000 Hz) were generated using MATLAB. The duration of each tone was 50 ms (including 5 ms rise/fall times). The frequency of each tone was within the range of 261.626 – 493.883 Hz, matching the absolute fre-quency of a series of seven natural keys on a modern piano (i.e., C4 D4 E4 F4 G4 A4 B4).
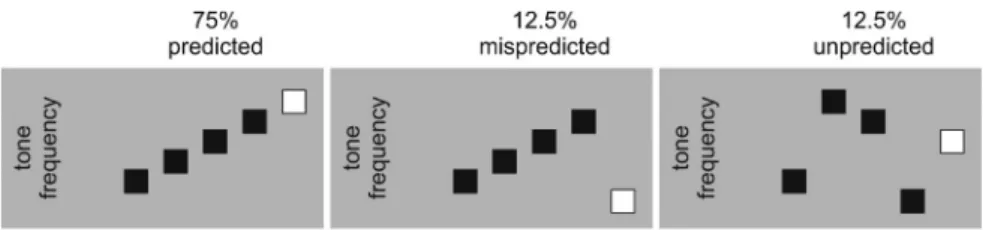
From the pool of seven tones, a total of 800 sets of five tones were created for the main experiment.Figure 2shows a schematic illustration of the design. In the predicted condition, which comprised 600 sets of tones, the frequency of the first four tones was ascending in steps of one natural key and the frequency of the fifth tone was one natural key higher than the fourth tone in the series (e.g., D4-E4-F4-G4-A4). That is, the fifth tone followed the ascending pattern. In the mispredicted condition, which comprised 100 sets of tones, the frequency of the first four tones was ascending in steps of one natural key and the frequency of the fifth tone was one natural key lower than the first tone in the series (e.g., D4-E4-F4-G4-C4); that is, the fifth tone violated the ascending pattern. In the unpredicted condition, which comprised 100 sets of tones, stimuli
Figure 1. Hypothesis concerning prediction error associated with predicted, mispredicted, and unpredicted stimuli. Boxes represent stimulus dimensions. Coloring of the box represents the intensity of representation. Length of the arrow represents the intensity of prediction error (i.e., the discrepancy between prediction and sensory input). A, Predicted stimuli trigger minimum prediction error because a fulfilled prediction can explain away all the prediction error (Arnal and Giraud, 2012). B, Predicted stimuli trigger medium prediction error because the representation of prediction is based on codes that are to a certain degree imprecise.
C, Predicted stimuli trigger medium prediction error because the representation of prediction mimics the regularities of the
environment. In this example, one stimulus is predicted to be the most likely, but two other stimuli are also considered to be possible with lower probabilities.
were created by randomly scrambling the order of the five tones in the predicted and mispredicted conditions. Here, the fifth tone cannot be predicted because the five tones in each sequence were selected from a population of seven tones.
To exclude the possibility that the findings in the main experiment simply reflect how much the tones of interest (i.e., the fifth tones) differ from their preceding tones (i.e., the fourth tones) in terms of frequency, a total of 160 sets of two tones were created for a control experiment. Half of the two-tone sets resemble the fourth and the fifth tones in the pre-dicted condition in the main experiment; that is, the second tones were always one natural key higher than the first tones (e.g., G4 –A4). The other half of the two-tone sets resemble the fourth and the fifth tones in the mispredicted condition in the main experiment; that is, the second tones were always four natural key lower than the first tones (e.g., G4 – C4). In other words, the frequency difference between the two tones in the control experiment was identical to the frequency difference between the fourth and the fifth tones in the main experiment. However, in the control experiment, the second tones being the one-natural-key-higher tones and the four-natural-key-lower tones are of equal probability and thus equal predictability.
E-prime version 2.0 (Psychology Software Tools) was used for stimu-lus presentation. The stimulation was randomized individually for each participant and delivered binaurally via headphones (Sennheiser PX200).
Procedures
In the main experiment, a total of 10 blocks of 80 trials were presented. A trial started with the presentation of a fixation cross, which remained on the screen for the duration of the trial. After 500 ms, a set of five tones were presented and each tone was followed by a 500 ms stimulus onset asynchrony (SOA). Ten percent of the fifth tones were of attenuated loudness by 20 dB in each condition. To maintain their attention, participants were required to press a key when they detected a softer fifth tone within a 700 ms long time window after the offset of the fifth tone. Each trial was followed by a jittered intertrial interval (ITI) of 700 – 800 ms.
In the control experiment, a total of two blocks of 80 trials were pre-sented. A trial started with the presentation of a fixation cross, which remained on the screen for the duration of the trial. After 500 ms, a set of two tones were presented in which each tone was followed by a 500 ms SOA. Ten percent of the second tones were of attenuated loudness by 20 dB in each condition. To maintain their attention, participants were required to press a key when they detected a softer second tone within a 700 ms long time window after the offset of the second tone. Each trial was followed by a jittered ITI of 700 – 800 ms.
To prevent the main experiment from influencing the control ex-periment, participants were presented with the control experiment first. The whole study took⬃60 min (i.e., 160 trials ⫻ 2500 ms ⫹ 800 trials⫻ 4000 ms).
Data recording and analysis
EEG recording and preprocessing. EEG was recorded with 64 active elec-trodes (actiCAP; Brain Products) conforming to the international 10 –10 system. The sampling rate was 500 Hz. No online/offline filter was used. The Cz served as the reference electrode online. The data were recom-puted to average reference offline. Target stimuli of attenuated loudness were removed. Epochs extended from⫺100 to 500 ms relative to the onset of the last stimulus in each trial (i.e., the fifth stimulus in the main
experiment and the second stimulus in the control experiment) using a 100 ms prestimu-lus baseline. Ocular artifact correction was conducted with independent component anal-ysis in EEGlab (Delorme and Makeig, 2004). Epochs containing voltage deviations exceed-ing⫾100V relative to baseline at any of the electrodes were rejected. The trial numbers af-ter artifact rejection in each condition are listed inTable 1.
ERP analysis. ERP analysis was based on a temporal principal component analysis (PCA) in SPSS 20. Since it was first introduced (Ruchkin et al., 1964;Donchin, 1966), PCA has been considered an effective linear reduction method for multivariate ERP data (Mo¨cks, 1988a,1988b;Duffy et al., 1992; Chap-man and McCrary, 1995;Dien, 1998;Picton et al., 2000;Dien and Frish-koff, 2005; for review, seeKayser and Tenke, 2003,Dien, 2012). PCA statistically decomposes the ERP waveforms into constituent building blocks, which affords objective, data-driven ERP component measures compared with other conventional methods (Kayser et al., 1998; Beau-ducel et al., 2000;Kayser and Tenke, 2006). Moreover, it is not as suscep-tible to the influences of high-frequency noises and low-frequency drifts in the data as other conventional methods (Luck, 2005). Covariance matrix and Promax rotation were used here. All components accounting for a total of 99% of the variance (maximum iterations for conver-gence⫽ 500) were included in the rotation (Promax kappa ⫽ 4). The decomposition provided a set of time-variant component loadings re-flecting the contribution of each temporal component to the voltage at each time point and a set of time-invariant component scores (calculated using Bartlett method) representing the contribution of each temporal component to the ERP waveforms which can be subject to inferential statistics (Van Boxtel, 1998). The components corresponding to the N1 (i.e., principal component 2 accounting for 15.59% of the variance), the N1/P2 transition in which a mismatch negativity (MMN) was seen in mispredicted condition but not in unpredicted condition (i.e., principal component 3 accounting for 6.01% of the variance), and the P2 (i.e., principal component 4 accounting for 2.87% of the variance) were iden-tified on the basis of the component loading latencies and the component score topographies.
The component scores were averaged across three electrodes showing the largest responses across all conditions independent of experimental manipulation (i.e., N1: F1, F4, FC3; N1/P2 transition: F3, F5, F4; P2: Pz, P2, CPz). Therefore, the averages of these electrodes can be considered as objective representatives of the components to serve as inputs for further statistical analyses. The advantage of averaging three maximum elec-trodes was twofold. First, it increased the signal-to-noise ratio of the components. Second, it avoided the problems inherited in the analysis of predefined areas that took an average of multiple electrodes over pre-defined regions, which might not correspond to the true topography in the experiment. Moreover, these electrodes representing the locations of maximum signals for each component corresponded to those reported in the literature (Na¨a¨ta¨nen and Picton, 1987).
To test for the prediction effects in the main experiment, a one-way repeated-measures ANOVA comparing the ERPs among the predicted, mispredicted, and unpredicted conditions was performed. To test whether the prediction effects in the main experiment simply reflect how much the tones of interest (i.e., the fifth tones) differ from their preced-ing tones (i.e., the fourth tones) in terms of frequency, a 2 (frequency distance: one-natural-key-higher/four-natural-key-lower conditions)⫻ 2 (predictive setting: main/control experiments) repeated-measures ANOVA was performed.
Descriptive source analyses of the N1 were performed in BESA Re-search 6.0 using equivalent current dipoles (ECDs) in a 4-shell ellipsoidal head model (Scherg and Von Cramon, 1986). For each condition, a time window at 92–112 ms (i.e.,⫾ 10 ms around the peak of the N1) that showed stable topography was chosen for analysis. Two ECDs were fitted without constraints separately for the grand average ERPs of each condi-tion, resulting in a good fit (residual variance for predicted: 1.67%, mis-predicted: 2.31%, and unmis-predicted: 3.52% conditions).
Figure 2. Schematic illustration of the design. In the experiment, 75% of the trials have a predicted fifth tone, 12.5% of the trials have a mispredicted fifth tone, and the last 12.5% of the trials have an unpredicted fifth tone.
Results
Behavioral results
Participants’ target detection performance was close to ceiling in
the main experiment [hit rate: mean
⫽ 0.97, SD ⫽ 0.04; false
alarm rate: mean
⬍ 0.001, SD ⱕ 0.001; reaction time (RT):
mean
⫽ 419.29, SD ⫽ 55.19] and in the control experiment (hit
rate: mean
⫽ 0.94, SD ⫽ 0.12; false alarm rate: mean ⫽ 0.05,
SD
⫽ 0.07; RT: mean ⫽ 404.49, SD ⫽ 71.70), indicating that they
concentrated on the stimuli as instructed.
ERP results
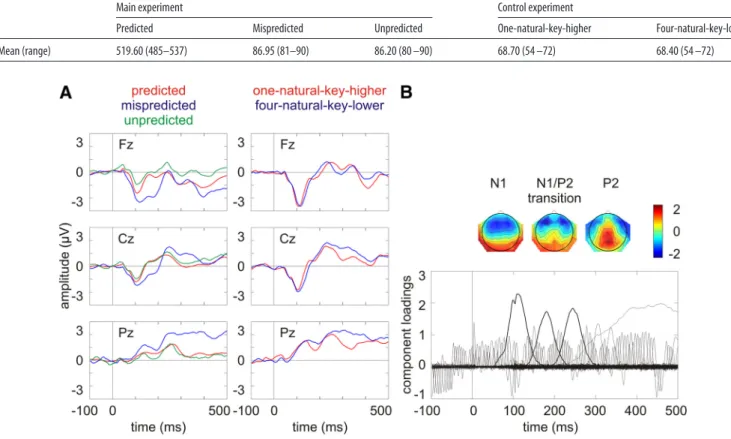
Figure 3
A shows the grand average ERPs on three midline electrodes
(i.e.,Fz,Cz,Pz).Thewaveformswerelow-passfilteredat30Hzforvisual
presentation purposes. There are evident N1 at
⬃100 ms with a
fronto-central distribution and P2 at
⬃250 ms with a centroparietal
distribu-tion.
Figure 3
B shows the component loadings of 122 components in
the temporal PCA. The components corresponding to the N1, the
N1/P2 transition, and the P2 in the grand average ERPs were identified
on the basis of the component loading latencies and the component
score topographies.
Comparisons among the predicted, mispredicted, and
unpredicted conditions
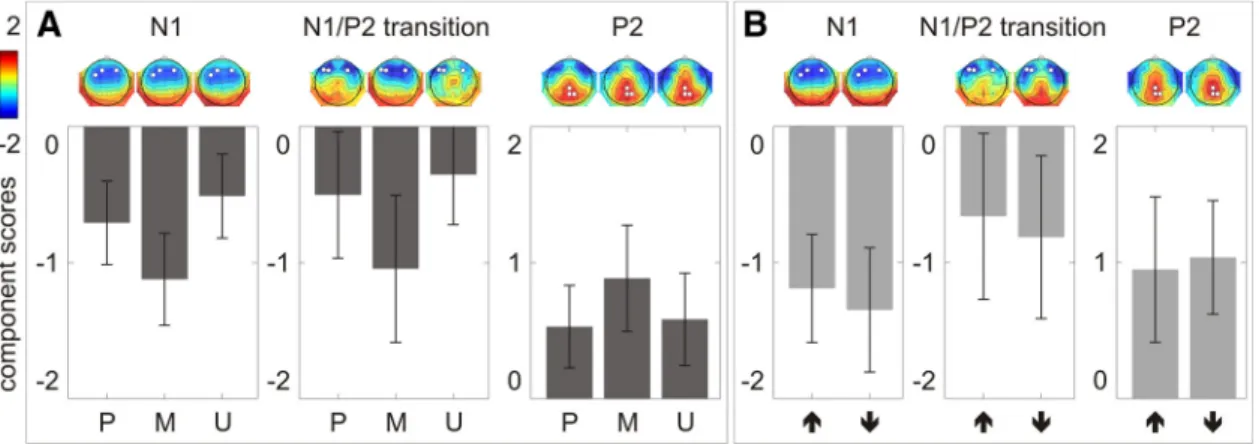
On the N1, there was a significant difference among the
pre-dicted, misprepre-dicted, and unpredicted conditions (F
(2,38)⫽
36.77, p
⬍ 0.001, partial
2⫽ 0.66). Post hoc pairwise
compari-sons with Sidak adjustment showed that the N1 was significantly
larger in the mispredicted than in the predicted condition (mean
difference
⫽ ⫺0.42; SE ⫽ 0.08; p ⬍ 0.001; 95% CI ⫽ ⫺0.62–
⫺0.22) and significantly smaller in the unpredicted than in the
predicted condition (mean difference
⫽ 0.20; SE ⫽ 0.07; p ⬍
0.025; 95% CI
⫽ 0.02–0.37) (
Fig. 4
A, left column).
Descriptive source analysis using ECDs showed that the
larg-est contribution to the N1 response in each condition originated
near the left and right auditory cortices (
Fig. 5
). No additional
cortical sources were identified with stable solutions.
On the N1/P2 transition, there was a significant difference
among the predicted, mispredicted, and unpredicted conditions
(F
(2,38)⫽ 15.37, p ⬍ 0.001, partial
2⫽ 0.45). Post hoc pairwise
comparisons with Sidak adjustment showed that the N1/P2
tran-sition was significantly larger in the mispredicted than in the
predicted condition (mean difference
⫽ ⫺0.54; SE ⫽ 0.14; p ⬍
0.01; 95% CI
⫽ ⫺0.92–⫺0.17), but did not differ between the
unpredicted and the predicted conditions (mean difference
⫽
0.15; SE
⫽ 0.11; p ⫽ 0.46; 95% CI ⫽ ⫺0.14–0.43;
Fig. 4
A, middle
column).
On the P2, there was a significant difference among the
pre-dicted, misprepre-dicted, and unpredicted conditions (F
(2,38)⫽ 4.51,
p
⬍ 0.05, partial
2⫽ 0.19). Post hoc pairwise comparisons with
Sidak adjustment showed that the P2 was marginally larger in the
mispredicted than in the predicted condition (mean difference
⫽
0.36; SE
⫽ 0.12; p ⫽ 0.026; 95% CI ⫽ 0.04–0.67), but did not
differ between the unpredicted and predicted conditions (mean
difference
⫽ 0.05; SE ⫽ 0.12; p ⫽ 0.96; 95% CI ⫽ ⫺0.25–0.36;
Fig. 4
A, right column).
Interactions between frequency distance and predictive setting
To test whether the prediction effects in the main experiment
simply reflect how much the tones of interest (i.e., the fifth tones)
differ from their preceding tones (i.e., the fourth tones) in terms
Table 1. Mean and range of trial numbers after artefact rejection in each condition
Main experiment Control experiment
Predicted Mispredicted Unpredicted One-natural-key-higher Four-natural-key-lower
Mean (range) 519.60 (485–537) 86.95 (81–90) 86.20 (80 –90) 68.70 (54 –72) 68.40 (54 –72)
Figure 3. A, Grand average ERPs on three midline electrodes (i.e., Fz, Cz, Pz). The waveforms were low-pass filtered at 30 Hz for visual presentation purposes. B, Component loadings of 122
components in the temporal PCA for the ERP data across all conditions. The component corresponding to the N1, the N1/P2 transition, and the P2 in the grand average ERPs (i.e., principal component 2, 3, and 4, respectively) are marked with thick lines with the component score topographies plotted on the top.
of frequency, data from the main experiment (
Fig. 4
A) and those
from the control experiment (
Fig. 4
B) were conjointly submitted
to a 2 (frequency distance:
one-natural-key-higher/four-natural-key-lower conditions)
⫻ 2 (predictive setting: main/control
ex-periments) repeated-measures ANOVA.
On the N1, there was a significant interaction between
fre-quency distance and predictive setting (F
(1,19)⫽ 6.26, p ⬍ 0.05,
partial
2⫽ 0.25). Post hoc t tests showed that there was a
signif-icant difference between frequency distance in the main
experi-ment (t
(19)⫽ 5.42, p ⬍ 0.001), but not in the control experiment
(t
(19)⫽ 1.74, p ⫽ 0.10).
On the N1/P2 transition, there was a significant interaction
between frequency distance and predictive setting (F
(1,19)⫽ 6.35,
p
⬍ 0.05, partial
2⫽ 0.25). Post hoc t tests showed that there was
a significant difference between frequency distance in the main
experiment (t
(19)⫽ 3.82, p ⱕ 0.001), but not in the control
ex-periment (t
(19)⫽ 0.85, p ⫽ 0.41).
On the P2, there was no significant interaction between
fre-quency distance and predictive setting (F
(1,19)⫽ 1.64, p ⫽ 0.22,
partial
2⫽ 0.08). Conversely, there was a significant main effect
of frequency distance in which the P2 was smaller in the
small-frequency-distance condition than in the
large-frequency-distance condition (F
(1,19)⫽ 4.95, p ⬍
0.05, partial
2⫽ 0.21) and a significant
main effect of predictive setting in which
the P2 was smaller in the main experiment
than in the control experiment (F
(1,19)⫽
6.90, p
⬍ 0.05, partial
2⫽ 0.27).
Overall, the significant interactions
be-tween frequency distance and predictive
setting on the N1 (and even the N1/P2
transition but not the P2) excludes the
possibility that the prediction effects in
the main experiment simply reflect how
much the tones of interest (i.e., the fifth
tones) differ from their preceding tones
(i.e., the fourth tones) in terms of
frequency.
Discussion
We presented participants with sets of five
tones, the last of which was predicted,
mispredicted, or unpredicted in terms of
frequency. We found that mispredicted
and unpredicted stimuli are associated
with different amounts of cortical activity, probably reflecting
differences in prediction error (
Friston, 2005
;
den Ouden et al.,
2012
). In particular, predicted stimuli did not trigger minimum,
but rather medium cortical activity. Relative to predicted stimuli,
mispredicted stimuli are associated with neuronal enhancement
and unpredicted stimuli are associated with neuronal attenuation
on the N1 ERP component. Source localization suggested that the
predictive model is generated near the auditory cortices.
First of all, our results demonstrate that the processing of
mispredicted and unpredicted stimuli are distinctive. The
disso-ciation conforms to previous research on the MMN reporting a
significant “surprise response” by contrasting between a deviant
embedded in a standard sequence (i.e., a mispredicted tone) and
a deviant embedded in an equiprobable sequence (i.e., an
unpre-dicted tone) (for review, see
Jacobsen and Schro¨ger, 2001
;
Na¨a¨ta¨nen et al., 2005
; but see
Ahmed et al., 2011
;
Astikainen et al.,
2011
;
Nakamura et al., 2011
vs
Farley et al., 2010
;
Fishman and
Steinschneider, 2012
;
Kaliukhovich and Vogels, 2014
for an
on-going debate in animal research). Importantly, in addition, our
results demonstrate how mispredicted and unpredicted
re-sponses are related to predicted response, which can help to
Figure 4. The N1, N1/P2 transition, and P2 component scores averaged across three electrodes showing the largest response (marked as white dots on the component score topographies) in each condition. A, In the main experiment, comparisons between predicted (P), mispredicted (M), and unpredicted (U) conditions are illustrated. B, In the control experiment, comparisons between one-natural-key-higher (upward arrow) and four-natural-key-lower (downward arrow) conditions are illustrated. Error bars depict one SD of the mean.
Figure 5. ECDs localization of the N1 cortical activity based on the grand average ERPs in the predicted, mispredicted, and unpredicted conditions.
explain the seemingly contradictory observations of
prediction-related effects in the literature. For example, although stimulus
repetition is believed to induce prediction (
Summerfield et al.,
2008
), the nonpredicted alternation of the familiar stimuli was
associated with neuronal enhancement, whereas the
nonpre-dicted alternation of the unfamiliar stimuli was associated with
neuronal attenuation (
Henson et al., 2000
;
Fiebach et al., 2005
;
Gagnepain et al., 2008
;
Soldan et al., 2008
;
Mu¨ller et al., 2013
;
Subramaniam et al., 2012
). Notably, familiar and unfamiliar
stimuli differ in whether there is a preexisting representation
(
Turk-Browne et al., 2008
), which might determine whether a
prediction can be encoded in the representational units
(
Grotheer and Kova´cs, 2014
). It might be that the nonpredicted
alternation of the familiar and unfamiliar stimuli were like the
mispredicted and unpredicted case, respectively. More closely
related to the current research,
Hsu et al. (2014a
,
2014b
) also
found seemingly contradictory patterns of activation in two
au-ditory studies using very similar designs. When pairs of two tones
were contrasted with each other, more enhanced N1 responses
were found for the alternated tones (i.e., the nonpredicted tones)
than the repeated tones (i.e., the predicted tones) (
Hsu et al.,
2014a
). Conversely, when pairs of random tones and pairs of
rising tones were contrasted, more attenuated N1 responses were
found for the random pairs (i.e., the nonpredicted tones) than
the rising pairs (i.e., the predicted tones) (
Hsu et al., 2014b
). The
two results seem incompatible when both alternated and random
tones are simply considered as “nonpredicted” stimuli. However,
the pattern can be explained if alternated and random tones are,
respectively, considered as mispredicted and unpredicted
stim-uli. Specifically, in the former study, alternated tones were
em-bedded in pairs of two identical tones in which there was
perceptual regularity. This might facilitate the brain’s attempt to
form prediction. In this case, alternated tones would be more like
mispredicted stimuli, which trigger larger cortical activity relative
to predicted stimuli. Conversely, in the latter study, random
tones were embedded in a stimulus stream without perceptual
regularity and there was little if any prediction involved. In
this case, random tones would be more like unpredicted
stim-uli, which trigger smaller cortical activity relative to predicted
stimuli.
The pattern of results is straightforward as concerns the
mis-predicted stimuli. Relative to mis-predicted stimuli, mismis-predicted
stimuli are associated with enhanced prediction error. This is
consistent with a range of findings showing that violation of
pre-diction triggers stronger cortical activity (for review, see
Ben-dixen et al., 2012
). The common explanation for this is that, for
mispredicted stimuli, prediction fails to match with sensory
in-put. This mismatch therefore induces both prediction error
gen-erated by prediction that is not perceived and prediction error
generated by sensory input that is not anticipated (
Arnal and
Giraud, 2012
). This idea was also used to explain why a decrease
of stimulus repetition probability reduces the size of adaptation
effect on hemodynamic responses (visual:
Summerfield et al.,
2008
;
Kova´cs et al., 2012
;
Grotheer and Kova´cs, 2014
;
May-rhauser et al., 2014
; auditory:
Andics et al., 2013
) and
electro-physiological responses (visual:
Summerfield et al., 2011
;
auditory:
Todorovic et al., 2011
). Specifically, it was proposed
that our perceptual apparatus generally predicts stimulation to be
consistent from moment to moment because our perceptual
con-text tends to remain stable across time scales (
Summerfield et al.,
2008
). In this manner, a decrease of stimulus repetition
proba-bility is considered a violation of prediction, which in turn elicits
stronger cortical activity.
A different pattern of results was observed for the unpredicted
stimuli. Relative to predicted stimuli, unpredicted stimuli are
associated with attenuated prediction error. This is incompatible
with the idea that predicted stimuli are associated with minimum
prediction error because a fulfilled prediction can explain away
all the prediction error (
Arnal and Giraud, 2012
). Rather,
pre-dicted stimuli are associated with some amount of prediction
error. This finding provides empirical support for the
neurocom-putational theory that, instead of encoding prediction in an
all-or-none manner, the brain seems to represent prediction as a
probability distribution (
Friston, 2009
) in one or both of the
following ways.
First, the representation of prediction might be based on
codes that are to a certain degree imprecise in the sense that the
activation in each representational unit is distributed over a set of
a continuum of predictions. With regard to continuous variables
such as frequency, the prediction of the “preferred” frequency
would be coded most strongly. This is done similarly to the
pop-ulation coding scheme involving neurons with a Gaussian tuning
curve in representing sensory input (
Bitterman et al., 2008
).
Here, predicted stimuli trigger prediction error to the extent that
the probability function representing the prediction is wider
than the probability function representing the sensory input.
Sec-ond, the representation of prediction might mimic the
regulari-ties of the environment. In the current research, participants
might learn that, after four ascending tones, the chance that the
step inertia will continue is 86% and the chance that the step
inertia will change is 14%. Although the former case is considered
the most likely upcoming event, the latter case is also coded in the
representational units, only to a lesser degree. Therefore, when a
“predicted” stimulus is presented, there is always some amount of
prediction error resulting from the unfulfilled part of the
predic-tion. In both of the aforementioned scenarios, which are not
mutually exclusive, predicted stimuli trigger some amount of
prediction error that is larger or at least equivalent to the
unpre-dicted prediction error.
Note that, in the current research, all stimuli were attended.
Can our result pattern be attributed to attention effect? It was
suggested the prediction mechanism dynamically interacts with
other cognitive operations, particularly attention (
Summerfield
and Egner, 2009
;
Segaert et al., 2013
). Specifically, the
engage-ment of attention may increase the weighting of sensory
infor-mation according to the precision of prediction, resulting in
heightened cortical activity to predicted relative to nonpredicted
stimuli (
Rao, 2005
;
Feldman and Friston, 2010
;
Kok et al., 2012
).
However, this idea cannot explain the distinct pattern of cortical
activity to mispredicted and unpredicted stimuli reported here,
both of which are supposed to be nonpredicted stimuli of low
precision of prediction. Conversely, the result pattern might be
interpreted in terms of how prediction error can be adjusted
depending on the predictability of the input (
Friston, 2009
).
Spe-cifically, prediction error evoked by stimuli occurring in more
predictable contexts can be weighted more strongly (
Schro¨ger et
al., 2015
). Here, because the preceding contextual stimuli were
more predictable for mispredicted stimuli than unpredicted
stimuli, neuronal responses were stronger in the former than the
latter. Altogether, the current research suggests that it is necessary
to differentiate between the two nonpredicted stimuli in
theoret-ical work on predictive coding.
To summarize, the predictive coding model of perception
proposes that neuronal responses reflect the sensory input that
the prediction cannot account for (
Rao and Ballard, 1999
;
Fris-ton, 2005
,
2009
). However, it remains unclear what constitutes
the nonpredicted stimuli. Although a conceptual difference
be-tween mispredicted and unpredicted stimuli was proposed (
Ar-nal and Giraud, 2012
), there is a lack of empirical investigation on
this issue. Here, we examined this possibility that the processing
of mispredicted and unpredicted stimuli are dissociable at the
neurophysiological level. We found that, compared with
pre-dicted stimuli, misprepre-dicted stimuli elicited neuronal
enhance-ment, whereas unpredicted stimuli elicited neuronal attenuation.
This pattern of results demonstrates the essentialness to
differen-tiate between mispredicted and unpredicted stimuli. Moreover, it
shows that predicted stimuli are not necessarily associated with
minimum cortical activity. We suggest that prediction is rather
represented as a probability distribution, resulting in partially
explained and unexplained sensory input and thus medium
pre-diction error.
References
Ahmed M, Ma¨llo T, Leppa¨nen PH, Ha¨ma¨la¨inen J, Ayra¨va¨inen L, Ruusuvirta T, Astikainen P (2011) Mismatch brain response to speech sound changes in rats. Front Psychol 2:283.Medline
Andics A, Ga´l V, Vicsi K, Rudas G, Vidnya´nszky Z (2013) fMRI repetition suppression for voices is modulated by stimulus expectations. Neuroim-age 69:277–283.CrossRef Medline
Arnal LH, Giraud AL (2012) Cortical oscillations and sensory predictions. Trends Cogn Sci 16:390 –398.CrossRef Medline
Astikainen P, Stefanics G, Nokia M, Lipponen A, Cong F, Penttonen M, Ruusuvirta T (2011) Memory-based mismatch response to frequency changes in rats. PLoS One 6(9).
Beauducel A, Debener S, Brocke B, Kayser J (2000) On the reliability of augmenting/reducing: peak amplitudes and principal components anal-ysis of auditory evoked potentials. Journal of Psychophysiology 14:226 – 240.CrossRef
Bendixen A, SanMiguel I, Schro¨ger E (2012) Early electrophysiological in-dicators for predictive processing in audition: a review. Int J Psycho-physiol 83:120 –131.CrossRef Medline
Bitterman Y, Mukamel R, Malach R, Fried I, Nelken I (2008) Ultra-fine frequency tuning revealed in single neurons of human auditory cortex. Nature 451:197–201.CrossRef Medline
Chapman RM, McCrary JW (1995) EP component identification and mea-surement by principal components analysis. Brain Cogn 27:288 –310.
CrossRef Medline
Delorme A, Makeig S (2004) EEGLAB: an open source toolbox for analysis of single-trial EEG dynamics including independent component analysis. J Neurosci Methods 134:9 –21.CrossRef Medline
den Ouden HE, Kok P, de Lange FP (2012) How prediction errors shape perception, attention, and motivation. Front Psychol 3:548.Medline
Dien J (1998) Addressing misallocation of variance in principal compo-nents analysis of event-related potentials. Brain Topography 11:43–55.
CrossRef Medline
Dien J (2012) Applying principal components analysis to event-related po-tentials: a tutorial. Dev Neuropsychol 37:497–517.CrossRef Medline
Dien J, Frishkoff GA (2005) Principal components analysis of event-related potential datasets. In: Event-related potentials: a methods handbook (Handy T, ed), pp 189 –208. Cambridge, MA: MIT.
Donchin E (1966) A multivariate approach to the analysis of average evoked potentials. IEEE Trans Biomed Eng 13:131–139.Medline
Duffy FH, Jones K, Bartels P, McAnulty G, Albert M (1992) Unrestricted principal components analysis of brain electrical activity: issues of data dimensionality, artifact, and utility. Brain Topography 4:291–307.
CrossRef Medline
Egner T, Monti JM, Summerfield C (2010) Expectation and surprise deter-mine neural population responses in the ventral visual stream. J Neurosci 30:16601–16608.CrossRef Medline
Farley BJ, Quirk MC, Doherty JJ, Christian EP (2010) Stimulus-specific ad-aptation in auditory cortex is an NMDA-independent process distinct from the sensory novelty encoded by the mismatch negativity. J Neurosci 30:16475–16484.CrossRef Medline
Feldman H, Friston KJ (2010) Attention, uncertainty, and free-energy. Front Hum Neurosci 4:215.Medline
Fiebach CJ, Gruber T, Supp GG (2005) Neuronal mechanisms of repetition
priming in occipitotemporal cortex: spatiotemporal evidence from func-tional magnetic resonance imaging and electroencephalography. J Neu-rosci 25:3414 –3422.CrossRef Medline
Fishman YI, Steinschneider M (2012) Searching for the mismatch negativity in primary auditory cortex of the awake monkey: deviance detection or stimulus specific adaptation? J Neurosci 32:15747–15758. CrossRef Medline
Friston K (2005) A theory of cortical responses. Philos Trans R Soc Lond B Biol Sci 360:815– 836.CrossRef Medline
Friston K (2009) The free-energy principle: a rough guide to the brain? Trends Cogn Sci 13:293–301.CrossRef Medline
Gagnepain P, Che´telat G, Landeau B, Dayan J, Eustache F, Lebreton K (2008) Spoken word memory traces within the human auditory cortex revealed by repetition priming and functional magnetic resonance imaging. J Neu-rosci 28:5281–5289.CrossRef Medline
Grotheer M, Kova´cs G (2014) Repetition probability effects depend on prior experiences. J Neurosci 34:6640 – 6646.CrossRef Medline
Henson R, Shallice T, Dolan R (2000) Neuroimaging evidence for disso-ciable forms of repetition priming. Science 287:1269 –1272.CrossRef Medline
Hsu YF, Ha¨ma¨la¨inen JA, Waszak F (2014a) Repetition suppression com-prises both attention-independent and attention-dependent processes. Neuroimage 98:168 –175.CrossRef Medline
Hsu YF, Ha¨ma¨la¨inen JA, Waszak F (2014b) Both attention and prediction are necessary for adaptive neuronal tuning in sensory processing. Front Hum Neurosci 8:152.Medline
Jacobsen T, Schro¨ger E (2001) Is there pre-attentive memory-based com-parison of pitch? Psychophysiology 38:723–727.CrossRef Medline
Kaliukhovich DA, Vogels R (2014) Neurons in macaque inferior temporal cortex show no surprise response to deviants in visual oddball sequences. J Neurosci 34:12801–12815.CrossRef Medline
Kayser J, Tenke CE (2003) Optimizing PCA methodology for ERP compo-nent identification and measurement: theoretical rationale and empirical evaluation. Clin Neurophysiol 114:2307–2325.CrossRef Medline
Kayser J, Tenke CE (2006) Consensus on PCA for ERP data, and sensibility of unrestricted solutions. Clin Neurophysiol 117:695–707.
Kayser J, Tenke CE, Bruder GE (1998) Dissociation of brain ERP topogra-phies for tonal and phonetic oddball tasks. Psychophysiology 35:576 – 590.CrossRef Medline
Kok P, Rahnev D, Jehee JF, Lau HC, de Lange FP (2012) Attention reverses the effect of prediction in silencing sensory signals. Cereb Cortex 22: 2197–2206.CrossRef Medline
Kova´cs G, Iffland L, Vidnya´nszky Z, Greenlee MW (2012) Stimulus repeti-tion probability effects on repetirepeti-tion suppression are posirepeti-tion invariant for faces. Neuroimage 60:2128 –2135.CrossRef Medline
Luck SJ (2005) An introduction to the event-related potential technique. Cambridge, MA: MIT.
Mayrhauser L, Bergmann J, Crone J, Kronbichler M (2014) Neural repeti-tion suppression: evidence for perceptual expectarepeti-tion in object-selective regions. Front Hum Neurosci 8(225).
Mo¨cks J (1988a) Decomposing event-related potentials: a new topographic components model. Biol Psychol 26:199 –215.CrossRef Medline
Mo¨cks J (1988b) Topographic components model for event-related poten-tials and some biophysical considerations. IEEE Trans Biomed Eng 35: 482– 484.CrossRef Medline
Mu¨ller NG, Strumpf H, Scholz M, Baier B, Melloni L (2013) Repetition suppression versus enhancement: it’s quantity that matters. Cereb Cortex 23:315–322.Medline
Na¨a¨ta¨nen R, Picton T (1987) The N1 wave of the human electric and mag-netic response to sound: A review and an analysis of the component structure. Psychophysiology 24:375– 425.CrossRef Medline
Na¨a¨ta¨nen R, Jacobsen T, Winkler I (2005) Memory-based or afferent pro-cesses in mismatch negativity (MMN): a review of the evidence. Psycho-physiology 42:25–32.CrossRef Medline
Nakamura T, Michie PT, Fulham WR, Todd J, Budd TW, Schall U, Hunter M, Hodgson DM (2011) Front Psychol 2:367.
Picton TW, Bentin S, Berg P, Donchin E, Hillyard SA, Johnson R Jr, Miller GA, Ritter W, Ruchkin DS, Rugg MD, Taylor MJ (2000) Guidelines for using human event-related potentials to study cognition: recording stan-dards and publication criteria. Psychophysiology 37:127–152.CrossRef Medline
Rao RP (2005) Bayesian inference and attentional modulation in the visual cortex. Neuroreport 16:1843–1848.CrossRef Medline
Rao RP, Ballard DH (1999) Predictive coding in the visual cortex: a func-tional interpretation of some extra-classical receptive-field effects. Nat Neurosci 2:79 – 87.CrossRef Medline
Ruchkin DS, Villegas J, John ER (1964) An analysis of average evoked po-tentials making use of least mean square techniques. Ann N Y Acad Sci 115:799 – 826.CrossRef Medline
Scherg M, Von Cramon D (1986) Evoked dipole source potentials of the human auditory cortex. Electroencephalogr Clin Neurophysiol 65:344 – 360.CrossRef Medline
Schro¨ger E, Marzecova´ A, SanMiguel I (2015) Attention and prediction in human audition: a lesson from cognitive psychophysiology. Eur J Neuro-sci 41:641– 664.CrossRef Medline
Segaert K, Weber K, de Lange FP, Petersson KM, Hagoort P (2013) The suppression of repetition enhancement: a review of fMRI studies. Neuro-psychologia 51:59 – 66.CrossRef Medline
Soldan A, Zarahn E, Hilton HJ, Stern Y (2008) Global familiarity of visual stimuli affects repetition-related neural plasticity but not repetition prim-ing. Neuroimage 39:515–526.CrossRef Medline
Subramaniam K, Faust M, Beeman M, Mashal N (2012) The repetition
par-adigm: enhancement of novel metaphors and suppression of conven-tional metaphors in the left inferior parietal lobe. Neuropsychologia 50: 2705–2719.CrossRef Medline
Summerfield C, Egner T (2009) Expectation (and attention) in visual cog-nition. Trends Cogn Sci 13:403– 409.CrossRef Medline
Summerfield C, Trittschuh EH, Monti JM, Mesulam MM, Egner T (2008) Neural repetition suppression reflects fulfilled perceptual expectations. Nat Neurosci 11:1004 –1006.CrossRef Medline
Summerfield C, Wyart V, Johnen VM, de Gardelle V (2011) Human scalp electroencephalography reveals that repetition suppression varies with expectation. Front Hum Neurosci 5(67).
Todorovic A, van Ede F, Maris E, de Lange FP (2011) Prior expectation mediates neural adaptation to repeated sounds in the auditory cortex: an MEG study. J Neurosci 31:9118 –9123.CrossRef Medline
Turk-Browne NB, Scholl BJ, Chun MM (2008) Babies and brains: habitua-tion in infant cognihabitua-tion and funchabitua-tional neuroimaging. Front Hum Neu-rosci 2:16.CrossRef Medline
Van Boxtel GJ (1998) Computational and statistical methods for analyzing event-related potential data. Behave Res Methods Instr Comp 30:87–102.
CrossRef