HAL Id: hal-00536620
https://hal.archives-ouvertes.fr/hal-00536620
Submitted on 9 Jun 2017
HAL is a multi-disciplinary open access archive for the deposit and dissemination of sci-entific research documents, whether they are pub-lished or not. The documents may come from teaching and research institutions in France or abroad, or from public or private research centers.
L’archive ouverte pluridisciplinaire HAL, est destinée au dépôt et à la diffusion de documents scientifiques de niveau recherche, publiés ou non, émanant des établissements d’enseignement et de recherche français ou étrangers, des laboratoires publics ou privés.
To cite this version:
Hélène Balcone-Boissard, Benoît Villemant, Georges Boudon. Behavior of halogens during the de-gassing of felsic magmas. Geochemistry, Geophysics, Geosystems, AGU and the Geochemical Society, 2010, 11, pp.Q09005. �10.1029/2010GC003028�. �hal-00536620�
Q09005,doi:10.1029/2010GC003028
ISSN: 1525‐2027
Behavior of halogens during the degassing of felsic magmas
H. Balcone‐BoissardISTeP, CNRS UMR 7193, UPMC Université Paris 6, Case courrier 129, 4 place Jussieu, F‐75252 Paris, France (helene.balcone_boissard@upmc.fr)
B. Villemant
ISTeP, CNRS UMR 7193, UPMC Université Paris 6, Case courrier 129, 4 place Jussieu, F‐75252 Paris, France
Institut de Physique du Globe de Paris et Université Paris Diderot (Sorbonne Paris‐Cité), CNRS UMR 7154, 1, rue Jussieu, F‐75238 Paris CEDEX 05, France
G. Boudon
Institut de Physique du Globe de Paris et Université Paris Diderot (Sorbonne Paris‐Cité), CNRS UMR 7154, 1, rue Jussieu, F‐75238 Paris CEDEX 05, France
[1] Residual concentrations of halogens (F, Cl, Br, I) and H2O in glass (matrix glass and melt inclusions)
have been determined in a series of volcanic clasts (pumice and lava‐dome fragments) of plinian, vulcanian and lava dome‐forming eruptions. Felsic magmas from calc‐alkaline, trachytic and phonolitic systems have been investigated: Montagne Pelée and Soufrière Hills of Montserrat (Lesser Antilles), Santa Maria‐ Santiaguito (Guatemala), Fogo (Azores) and Vesuvius (Italy). The behavior of halogens during shallow H2O degassing primarily depends on their incompatible character and their partitioning between melt
and exsolved H2O vapor. However, variations in pre‐eruptive conditions, degassing kinetics, and syn‐
eruptive melt crystallization induce large variations in the efficiency of halogen extraction. In all systems studied, Cl, Br and I are not fractionated from each other by differentiation or by degassing processes. Cl/Br/I ratios in melt remain almost constant from the magma reservoir to the surface. The ratios measured in erupted clasts are thus characteristic of pre‐eruptive magma compositions and may be used to trace deep magmatic processes. F behaves as an incompatible element and, unlike the other halogens, is never signif-icantly extracted by degassing. Cl, Br and I are efficiently extracted from melts at high pressure by H2O‐
rich fluids exsolved from magmas or during slow effusive magma degassing, but not during rapid explosive degassing. Because H2O and halogen mobility depends on their speciation, which strongly varies with
pres-sure in both silicate melts and exsolved fluids, we suggest that the rapid prespres-sure decrease during highly explosive eruptions prevents complete equilibrium between the diverse species of the volatiles and conse-quently limits their degassing. Conversely, degassing in effusive eruptions is an equilibrium process and leads to significant halogen output in volcanic plumes.
Components: 13,500 words, 5 figures, 4 tables.
Keywords: halogens; felsic melts; eruptive style; speciation.
Index Terms: 1065 Geochemistry: Major and trace element geochemistry; 8499 Volcanology: General or miscellaneous. Received 4 January 2010; Revised 28 May 2010; Accepted 9 June 2010; Published 9 September 2010.
Balcone‐Boissard, H., B. Villemant, and G. Boudon (2010), Behavior of halogens during the degassing of felsic magmas, Geochem. Geophys. Geosyst., 11, Q09005, doi:10.1029/2010GC003028.
[2] The halogens F, Cl, Br, and I behave simply
during magmatic differentiation and degassing because they generally have low mineral/melt partition coefficients and high H2O vapor‐melt
partition coefficients. Pre‐eruptive, highly differ-entiated magmas (rhyolitic, trachytic, or phonolitic melts) generally have high H2O concentrations but
low CO2 or SO2 concentrations because of the
much lower solubility of these volatile components compared to H2O [Morizet et al., 2002].
Experi-mental data show that in such highly differenti-ated melts halogens are highly soluble and that their volatile behavior is mainly controlled by H2O degassing [Métrich and Rutherford, 1992;
Webster, 1997; Webster et al., 1999; Bureau et al., 2000; Bureau and Métrich, 2003; Moretti et al., 2003; Carroll, 2005; Gardner et al., 2006; Chevychelov et al., 2008]. Reconstruction of the melt degassing history may be carried out by relating the halogen concentration in glass with the corresponding vesicularity and crystallinity of magma fragments quenched at different degassing steps. As accurate measurements of H2O
con-centrations in glass of erupted material (melt inclu-sions, matrix glass) are often difficult, halogens may represent a good alternative to identify and trace degassing processes.
[3] In this paper, we compare halogen
concentra-tions in eruptive products from a set of plinian and lava dome‐forming eruptions involving various types of felsic melts. This assessment allows us to establish general rules for halogen behavior during magma degassing as a function of melt composition, pre‐eruptive conditions and eruptive style.
[4] The investigated eruptions are the Fogo A
eruption of Fogo volcano (∼4700 a BP, São Miguel, Azores), the P1 eruption at Montagne Pelée (650 a BP, Martinique), the 1902, 1929 and present‐day eruptions at Santa Maria‐Santiaguito (Guatemala), the 1995‐present‐day eruption at Soufrière Hills (Montserrat) and the 79 AD Vesuvius eruption (Italy). These examples cover a large range of felsic melt compositions, from rhyolitic (Montagne Pelée, Soufrière Hills, Santa Maria‐Santiaguito), to tra-chytic (Fogo) and phonolitic (Vesuvius) and a large variety of eruptive styles, including plinian eruptions (Fogo, Santa Maria, Montagne Pelée, Vesuvius), lava dome‐forming eruptions (Santiaguito, Montagne Pelée, Soufrière Hills) and vulcanian explosions (Soufrière Hills).
centrations in volcanic clasts are reported for Fogo, Montagne Pelée and Santa Maria‐Santiaguito vol-canoes. They are compared with previously pub-lished data on Vesuvius [Balcone‐Boissard et al., 2008], Soufrière Hills (the ongoing eruption since 1995 [Villemant et al., 2008]), Montagne Pelée, and Santa Maria‐Santiaguito [Villemant and Boudon, 1998, 1999; Villemant et al., 2003].
2. Materials and Analytical Methods
[6] The detailed reconstruction of the degassing
processes for each eruptive unit is based on a systematic collection of volcanic clasts and, for each individual clast, on analyses of textural char-acteristics (vesicularity, microcrystallinity) and volatile concentrations in the matrix glass and glassy melt inclusions, which represent the pre‐eruptive melt in the magmatic system. This method com-bined with modeling has been successfully applied to interpret other eruptions [Villemant and Boudon, 1998, 1999; Villemant et al., 1996, 2003, 2008; Balcone‐Boissard et al., 2008].
2.1. Volcanic Eruptions
[7] The products of six characteristic eruptions
from five volcanoes in different geodynamic settings were studied. Three eruptions are from calc‐alkaline volcanoes from subduction zones. Montagne Pelée (Martinique) and Soufrière Hills Volcano (Montserrat) in the Lesser Antilles arc result from the subduction of the Atlantic oceanic crust of the North American plate under the Caribbean plate whereas Santa Maria‐Santiaguito (Guatemala) is associated with the subduction of the Cocos plate beneath the Caribbean plate. Vesuvius (Italy) is located in a complex geodynamic system and erupted magmas are silica‐undersaturated and highly potassic (tephri‐phonolitic to phonolitic). Fogo (São Miguel, Azores (37°–40° N)), is located in the Atlantic Ocean on the triple junction where the Eurasian, African and American plates con-verge; erupted magmas are trachytic in composition.
[8] Montagne Pelée is one of the most active
vol-canoes of the Lesser Antilles arc. The last plinian eruption (P1, 650 y BP old), hereafter referred as Montagne Pelée, was studied. It is a complex eruption that began with effusion of a lava‐dome that was later destroyed by two directed lateral explosions that generated two dilute pyroclastic
density currents on the western flank of the volcano. It was immediately followed by a plinian eruption characterized by a succession of sustained plinian activity and plinian column collapse phases [Villemant and Boudon, 1998]. Dense clasts from the lava‐dome, clasts from the pyroclastic density current deposits and clasts in the pumice fallout deposits were studied [Villemant and Boudon, 1999].
[9] Soufrière Hills volcano on the island of
Montserrat, in the northern part of the Lesser Antilles arc, has been active since 1995. This eruption (hereafter referred to as Montserrat) is one of the most complex eruptions observed in recent decades, consisting of a succession of lava domes, vulcanian explosions, flank‐collapse and dome‐ collapse events [Sparks et al., 1998; Voight et al., 1999; Robertson et al., 1998, 2000]. Dense clasts from the first phase of lava dome growth and pumice clasts from the 1997 vulcanian explosions were studied [Villemant et al., 2008].
[10] The October 1902 plinian eruption of Santa
Maria volcano (Guatemala) was one of the largest eruptions of the last century [Williams and Self, 1983; Rose, 1972a]. This eruption, hereafter referred to as Santa Maria, generated a thick pumice fallout deposit followed by caldera collapse in which, 20 years later, Santiaguito volcano was em-placed and continues to be permanently active [Rose, 1972b]. This activity, hereafter referred to as Santiaguito, consists in a series of lava domes, which underwent numerous explosion and collapse events [Rose, 1972b; Harris et al., 2003]. Pumice clasts from the plinian phase of the Santa Maria volcano and clasts from different lava domes of Santiaguito were studied (samples covering the period 1947– 1989) (Santa Maria‐Santiaguito samples [Villemant et al., 2003]).
[11] The 79 AD eruption of Vesuvius, also known
as the “Pompeii eruption” and hereafter referred to as Vesuvius, is commonly divided into three phases [Sigurdsson et al., 1990; Cioni et al., 1995]: an initial phreatomagmatic phase followed by a pli-nian event that produced a thick pumice fallout deposit and a final phase dominated by numerous column collapse events. The magma erupted during the plinian phase varies in composition from pho-nolite to less differentiated phopho-nolite. This change in composition corresponds to a sharp transition in the tephra fallout deposit from the “white pumice” to the “grey pumice.” Studies dedicated to this eruption include determination of pre‐eruptive conditions and magma degassing [Cioni, 2000;
Signorelli and Capaccioni, 1999] and textures and vesicularity [Gurioli et al., 2005]. The behavior of halogens during the evolution of this eruption was studied in detail by Balcone‐Boissard et al. [2008]. Here we focus only on white pumice units, although we briefly consider the distinction between three eruptive units.
[12] Fogo volcano is one of the three active
stra-tovolcanoes of São Miguel island, in the Azores archipelago [Moore, 1990; Booth et al., 1978]. The last eruption of Fogo occurred in 1563 AD, but the most important plinian eruption, the Fogo A erup-tion, is dated at∼4700 y BP [Snyder et al., 2007]. It is hereafter referred to as the Fogo A eruption. The magma erupted is trachytic in composition. The main plinian phase produced a pumice fallout layer in which several ash‐and‐pumice flow and surge deposits intercalate, attesting to several collapses of the eruptive column during the eruption [Walker and Croasdale, 1971]. Snyder et al. [2004] and Widom et al. [1992] provide petrogenetic models of the Fogo A magmatic evolution, based on chemical, textural and isotopic data, and the deposits represent the upper part of a chemically zoned magma reservoir [Watanabe et al., 2005; Snyder et al., 2007]. Cruz et al. [2004] performed a detailed study of the vesicularity and volatile concentration (H2O, F, Cl) of the eruption products. The pre‐
eruptive water concentration was estimated by Wolff and Storey [1983]. Here we focus on the main plinian phase. When necessary, the distinction between three eruptive unit included in the main plinian fallout is considered.
2.2. Major Element Composition of Glass
[13] Whole‐rock, major‐element compositions were
measured by ICP‐AES (SARM, CRPG Nancy, France). Matrix glass compositions (major and volatile concentrations) were measured by electron probe micro‐analysis (EPMA, Cameca SX 100, Camparis, Université Paris VI). The thorium con-centrations in samples from the Fogo A eruption was measured by ICP‐MS (Thermo‐Optek ICP‐MS at Université de Paris VI).
[14] All studied magmas are silica‐rich (SiO2 >
55 wt%) and correspond to low temperature (800– 900°C) differentiated melts. In the alkaline systems investigated, whole rock and matrix glass compo-sitions are very similar due to the low phenocryst content, whereas the calc‐alkaline magmas consist of rhyolitic melts with large amounts of pheno-crysts. For each studied calc‐alkaline eruption, the melt composition remains homogeneous
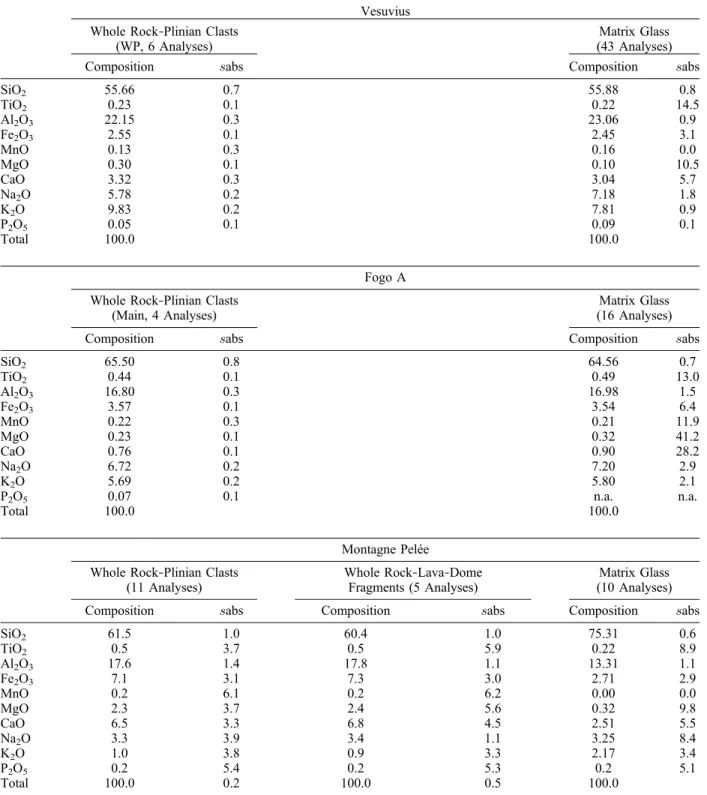
through-Table 1. Whole Rock and Matrix Glass Compositions (Anhydrous Basis) of the Studied Eruptionsa Vesuvius
Whole Rock‐Plinian Clasts (WP, 6 Analyses)
Matrix Glass (43 Analyses)
Composition sabs Composition sabs
SiO2 55.66 0.7 55.88 0.8 TiO2 0.23 0.1 0.22 14.5 Al2O3 22.15 0.3 23.06 0.9 Fe2O3 2.55 0.1 2.45 3.1 MnO 0.13 0.3 0.16 0.0 MgO 0.30 0.1 0.10 10.5 CaO 3.32 0.3 3.04 5.7 Na2O 5.78 0.2 7.18 1.8 K2O 9.83 0.2 7.81 0.9 P2O5 0.05 0.1 0.09 0.1 Total 100.0 100.0 Fogo A Whole Rock‐Plinian Clasts
(Main, 4 Analyses)
Matrix Glass (16 Analyses)
Composition sabs Composition sabs
SiO2 65.50 0.8 64.56 0.7 TiO2 0.44 0.1 0.49 13.0 Al2O3 16.80 0.3 16.98 1.5 Fe2O3 3.57 0.1 3.54 6.4 MnO 0.22 0.3 0.21 11.9 MgO 0.23 0.1 0.32 41.2 CaO 0.76 0.1 0.90 28.2 Na2O 6.72 0.2 7.20 2.9 K2O 5.69 0.2 5.80 2.1 P2O5 0.07 0.1 n.a. n.a. Total 100.0 100.0 Montagne Pelée Whole Rock‐Plinian Clasts
(11 Analyses)
Whole Rock‐Lava‐Dome Fragments (5 Analyses)
Matrix Glass (10 Analyses)
Composition sabs Composition sabs Composition sabs
SiO2 61.5 1.0 60.4 1.0 75.31 0.6 TiO2 0.5 3.7 0.5 5.9 0.22 8.9 Al2O3 17.6 1.4 17.8 1.1 13.31 1.1 Fe2O3 7.1 3.1 7.3 3.0 2.71 2.9 MnO 0.2 6.1 0.2 6.2 0.00 0.0 MgO 2.3 3.7 2.4 5.6 0.32 9.8 CaO 6.5 3.3 6.8 4.5 2.51 5.5 Na2O 3.3 3.9 3.4 1.1 3.25 8.4 K2O 1.0 3.8 0.9 3.3 2.17 3.4 P2O5 0.2 5.4 0.2 5.3 0.2 5.1 Total 100.0 0.2 100.0 0.5 100.0
out the whole eruptive sequence, irrespective of the eruptive style whereas in alkaline systems large var-iations in composition may be observed (Table 1).
2.3. Volatile Concentrations of Volcanic Clasts
[15] Representative clasts of each example were
powdered in an agate mortar for bulk chemical analyses. Whole rock volatile concentrations (H2O,
CO2) were measured by H2 and CO2 manometry
after vacuum extraction under reducing conditions for H2O and using a temperature trap to separate
CO2. These techniques provide good analytical
precisions: <10% for H2O and CO2. In all volcanic
systems, H2O represents the main volatile
compo-nent; magmatic CO2 is negligible and will not be
considered further in this contribution. Data are reported in auxiliary material Data Sets S1 and S2.1
[16] Halogens in the groundmass were extracted
from bulk powders of volcanic clasts by pyrohy-drolysis and analyzed by ion chromatography for F and Cl and by ICP‐MS for Br and I [Michel and Villemant, 2003; Balcone‐Boissard et al., 2009]. These techniques provide good analytical preci-sion: <10% for F and Cl and∼10% for Br (both are relative %). For I, the precision is∼10–20% (rela-tive), due to the low I abundance (∼10–200 ppb) and analytical difficulties (volatility, contamination) (as detailed by Balcone‐Boissard et al. [2009]). Residual H2O and halogens are concentrated as
dissolved species in matrix glass in all samples studied. Phenocrysts are produced by magmatic differentiation in the reservoir, at depth, and are not linked to the degassing history. Estimates of vola-tile concentrations in the groundmass are obtained by correcting the bulk chemical analyses by the phenocryst weight fraction and, in some cases, from the volatile concentrations of volatile‐bearing phenocrysts (such as amphiboles in the case of Montserrat [Villemant et al., 2008]). These com-positions then represent the melt composition in magma chamber and conduit during degassing and eruption. The phenocryst weight fraction in each clast is obtained by mass balance calculations using major and trace element compositions measured by EPMA and ICP‐MS in separated groundmass, phenocrysts and whole rocks [Balcone‐Boissard et al., 2009]. This method provides more reliable values than point counting or image analysis [Villemant et al., 2003]. For low phenocryst con-centrations (<10 wt% relative), this correction is within the analytical error. These corrections do not modify the relative abundances of volatiles, except in the case of large abundances of volatile‐ bearing phenocrysts. Thus, characteristic abun-dance ratios such as Cl/F, Cl/Br or Br/I in residual glasses and/or the groundmass may be calculated from bulk rock analysis without introduction of other sources of error from the correction of phenocryst concentration.
[17] In recent years, considerable effort has been
spent developing analysis techniques for volatiles in volcanic glasses (matrix glass and melt inclu-sion). EPMA is the most widespread technique for
1Auxiliary materials are available at ftp://ftp.agu.org/apend/gc/
2010gc003028.
Table 1. (continued)
Santa Maria‐Santiaguito Whole Rock‐Plinian Clasts
(9 Analyses)
Whole Rock‐Lava‐Dome Fragments (11 Analyses)
Matrix Glass (13 Analyses)
Composition sabs Composition sabs Composition sabs
SiO2 66.9 1.8 64.7 2.2 73.52 0.8 TiO2 0.3 13.7 0.4 19.4 0.16 14.1 Al2O3 16.7 1.6 17.2 2.0 15.43 1.2 Fe2O3 3.8 13.4 4.5 12.2 1.91 14.5 MnO 0.1 4.6 0.1 3.5 0.00 0.0 MgO 1.2 23.5 1.6 17.9 0.48 12.2 CaO 4.1 11.7 4.8 10.8 2.18 10.8 Na2O 4.9 4.0 4.8 3.8 3.48 11.7 K2O 1.8 8.7 1.7 11.4 2.64 2.8 P2O5 0.2 3.5 0.2 8.6 0.2 5.3 Total 100.0 100.0 100.0 a
Whole rock compositions: ICP‐AES (SARM, Nancy‐France). Matrix glass compositions: EPMA (SX100, Camparis, France). sabs: standard deviation; n: number of analyses. The absolute sigma is in percentage.
halogen measurements in volcanic glasses (melt inclusions and matrix glass) has been developed using a Cameca SX100 microprobe (Camparis, Université Paris VI) that ensures good analytical precision (10% and 5% relative for F and Cl, respectively) and low detection limits (120 ppm for F and 30 ppm for Cl). Details of the chemical analysis procedures are given by Balcone‐Boissard et al. [2008]. Point analyses and textural in-vestigations were performed on one part of a rep-resentative clast that was embedded in epoxy resin, ground and polished. Analyses of major elements were performed with an acceleration voltage of 15 kV and a beam current of 4 nA. The dwell time was 10s, except for Si (5s) and Na (5s). F and Cl were measured with a dwell time of 120s and 90s respectively, an acceleration voltage of 15 kV and a beam current of 100 nA. Analytical conditions (in particular dwell times) were chosen to ensure no significant Na or F diffusion during EPMA analy-ses, as monitored using glass standards. For inter‐ calibration of EPMA and pyrohydrolysis, Cl and F were repeatedly analyzed by both methods in three in‐house natural glass standards (obsidians from Lipari, Eolian Islands (LIP), Italy; Little Glass Mountain, California (LGM), United States; and Corbetti volcano (CO5), Ethiopia). The results show a slight overestimation of both F and Cl concentrations determined by EPMA compared to pyrohydrolysis. For intercalibration of each EPMA session, the same natural glass samples were used as internal standards. Furthermore, standards and samples were always carbon coated together to avoid analytical differences arising from carbon coat thickness. Measurements of glass composi-tions may be biased by the presence of undetected microlites within the analyzed volume. Analytical data are, therefore, selected using major element diagrams combining the analyses of glass and mineral compositions. Analyses displaying evi-dence of a contribution from a mineral phase were discarded. No EPMA analytical routine exists for the other halogens (Br and I).
[18] The H2O concentrations of some glasses from
the Vesuvius eruption were estimated using EPMA and the “by difference method” [Devine and Gardner, 1995], calibrated on the three in‐house natural glass standards and melt inclusions in quartz from Mont Dore volcano (Massif Central, France [Clocchiatti, 1975]). The pre‐eruptive H2O
con-centration was estimated from multiphase equilib-rium for the Vesuvius eruption, and the results were
Other H2O concentrations are from the literature.
[19] Due to the high crystallinity or the high
vesic-ularity of some samples that limit the size of the glassy areas, point measurements by EMPA may be impossible. In those cases, volatile concentra-tions in the groundmass, representing matrix glass plus microlites (the microlite weight fraction is inherited from syn‐eruptive degassing and can be measured from SEM image analysis), may be esti-mated from whole rock composition by correcting for the phenocryst abundance. Estimates of pre‐ eruptive volatile concentrations may be obtained from melt inclusion analyses. However, in addition to analytical difficulties, possible syn‐ and post‐ entrapment evolution (diffusive effects, H2O loss,
melt inclusion crystallization or immiscibility) may alter the significance of measured volatile con-centrations [Lowenstern, 1995; Baker, 2008]. In addition, multistep degassing, which frequently occurs during magma ascent [Druitt et al., 2002; Couch et al., 2003; Balcone‐Boissard et al., 2008; Villemant et al., 2008], is generally not recorded in melt inclusions because syn‐eruptive crystalliza-tion is limited (plinian erupcrystalliza-tion case), or because multistep degassing does not provide conditions conducive to melt inclusion entrapment. In such cases, pre‐eruptive volatile concentrations (i.e., prior to the last degassing stage) cannot be inferred from melt inclusion analyses, which generally only provide minimum values.
3. Modeling Halogen Degassing
3.1. Closed Versus Open System Degassing Models
[20] The differences between volcanic eruptive
styles are mainly attributed to variations in the de-gassing regimes [Eichelberger et al., 1986; Jaupart and Allègre, 1991; Eichelberger, 1995; Sparks, 2003; Martel et al., 1998]. Numerous theoretical models based on fluid mechanics have been pro-posed to account for the variety of eruptive styles [Jaupart and Allègre, 1991; Melnik and Sparks, 1999, 2002; Papale et al., 1998; Voight et al., 1999]. The application of such models to natural systems remains difficult due to the large number of parameters that cannot be measured directly (e.g., viscosity, crystallization kinetics, conduit diameter, magma chamber depth and overpressure, etc.). However, simplified models of magma degassing during eruptions may be calculated using volatile
solubility and gas expansion laws, assuming closed‐ or open‐system degassing. Natural systems may be compared to these models using residual volatile concentrations (H2O, CO2, SO2, halogens) and
textural characteristics (vesicularity, microcrystal-linity) measured in erupted magma fragments [Villemant and Boudon, 1998; Villemant et al., 2003, 2008; H. Balcone‐Boissard et al., Textural and geochemical constraints on eruptive style of the 79AD eruption at Vesuvius, submitted to Bulletin of Volcanology, 2010]. Because eruptions sample magma quenched at different depths and gas pres-sures, measurements of vesicularity and volatile concentrations on a series of magma fragments collected from different units of the same eruptive phase allow reconstruction of degassing paths.
[21] Because H2O is the major volatile species in
felsic magmas, modeling degassing paths requires knowledge of the H2O solubility law in the melt
[Burnham, 1975, 1994; Carroll and Blank, 1997; Di Matteo et al., 2004; Zhang, 1999]. First, assuming an initial pre‐eruptive H2O
concentra-tion, the closed system degassing path may be theoretically calculated and represented in the [H2O]r‐Vg/Vl diagram, where [H2O]ris the residual
water concentration in glass from a pumice clast and Vg/Vl is ratio of the volume of gas (Vg) to the volume of melt (Vl) in the clast. During magma ascent from the H2O saturation depth, H2O exsolves
with decreasing pressure, bubbles form and expand in response to both the decrease in H2O solubility
and the decrease in pressure (Figure 1) [Villemant and Boudon, 1998, 1999]. In this degassing regime, the residual H2O concentration rapidly
reaches an almost constant value depending on the bulk melt composition and initial H2O
concentra-tion. The closed system degassing model represents the typical model for plinian eruptions [Eichelberger, 1995; Jaupart and Allègre, 1991].
[22] In natural systems, pumice clasts with
vesicu-larities lower than 50% or higher than 80–90% are rarely observed, which limits the range of measured Vg/Vl values to between approximately 1 and 7. Within that vesicularity range, closed system degassing curves are very similar for identical initial H2O concentrations in different composition
mag-mas. More precisely, due to the similarity of their H2O solubility behavior, rhyolites and K‐phonolites
on one hand, and Na‐phonolites and trachytes on the other hand, produce indistinguishable closed
sys-Figure 1. Theoretical H2O‐Vesicularity variation during magma degassing. Vesicularity is measured as the volume ratio of gas over melt (Vg/Vl; see text for definition). Corresponding vesicularities are given in volume percent, vol%. H2O* refers to H2O concentrations in residual melts. Lines correspond to closed‐system evolution for different initial H2O concentrations (2, 5 and 10 wt%) and melt compositions (rhyolite, Na‐phonolite, K‐phonolite and trachyte) at the same temperature (900°C). Solubility laws (P in bars): Iacono‐Marziano et al. [2007] ([H2O] = 0.067 P(0.5771)) for K‐phonolite, Signorelli and Carroll [2000] ([H2O] = 0.0315 P(0.7317)) for Na‐phonolite, Di Matteo et al. [2004] ([H2O] = 0.0114 P(0.8663)) for trachyte and Liu et al. [2005] ([H2O] = 0.2816 P(0.5648)) for rhyolite. Inset: Solid line: closed‐system degassing. Grey: open‐system degassing domain, with continuous H2O loss and vesicle collapse. See text for discussion.
degassing models are not sensitive, within analytical errors, to temperature variations in the range of 800 to 1000°C (Figure 1).
[23] Alternatively, for highly degassed and highly
vesiculated melts, H2O exsolution may be reduced
or stopped whereas gas expansion continues due only to the pressure decrease (“expansion only evolution,” Figure 1). This may occur if the H2O
transfer rate from the melt to bubbles is strongly reduced, whereas melt viscosity remains suffi-ciently low to allow continuous bubble expansion. The reduction of the H2O transfer rate may be due,
for example, to a large increase of the ascent rate (decompression) relative to H2O diffusion or to
variations in bulk H2O diffusivity related to
varia-tions in OH−and H2O species in the melt [Watson,
1994; Zhang et al., 1991]. Vesicle expansion with no H2O depletion in matrix glass has been
pro-posed to occur during a short interval of time after fragmentation, in the volcanic plume [Thomas et al., 1994; Gardner et al., 1996; Kaminski and Jaupart, 1997].
[24] In the open system degassing mode, exsolved
gas continuously escapes from the magma column, for instance through conduit walls. This mode results in decreasing vesicularity as volatile con-centrations in the melts fall. Because this gas loss leads to a decrease of magma ascent rates, crystal-lization induced by degassing may be extensive [Burnham, 1979; Hammer et al., 1999; Blundy and Cashman, 2001; Couch et al., 2003; Atlas et al., 2006], as observed in lava dome‐forming erup-tions, and lower ascent rates and crystallization lead to larger volatile degassing. Both processes (gas escape and degassing‐induced crystallization) may be modeled with the Rayleigh distillation law [Villemant and Boudon, 1998, Melnik and Sparks, 1999; Villemant et al., 2003, 2008].
[25] The behavior of minor volatile elements, such
as halogens, may be described using H2O degassing
models and H2O vapor/melt partition coefficients
[Villemant and Boudon, 1998]. The theoretical evolution of residual halogen concentrations versus Vg/Vl display similar features to those for H2O and
emphasize that halogen extraction is primarily dependent on both the halogen concentrations in pre‐eruptive melts (Figure 1) and the amount of extracted H2O. H2O vapor/melt partition
coeffi-cients also vary with melt composition and pressure, which induces second order variations in closed‐ and open‐system degassing models [Villemant et al., 2003; Shinohara, 2009].
the Behavior of Halogens During the Degassing of Magmas
[26] Differences in degassing efficiency may be
related to variations in the fluid/melt partition coefficients of volatiles, to kinetic effects (com-petition between degassing and crystallization pro-cesses and volatile diffusivity) and/or to modifications of magmatic properties such as vis-cosity (melt visvis-cosity).
3.2.1. Solubility and Fluid/Melt Partition Coefficients of Halogens in Felsic Magmas: The Example of Cl
[27] Chlorine discharge by volcanoes into the
atmosphere is highly variable, but HCl is always the dominant Cl‐bearing gas species [Giggenbach, 1996; Allard et al., 2005; Oppenheimer et al., 2006; Burton et al., 2007]. By contrast, Cl spe-ciation in high pressure H2O‐rich fluids (i.e., P >
100 MPa) is dominated by chloride salts, such as NaCl and KCl as evidenced by fluid inclusion studies and experiments [Burnham, 1975; Anderko and Pitzer, 1993a; Lowenstern, 1994; Liebscher, 2007; Driesner and Heinrich, 2007]. Thus, Cl extraction from melts is controlled by degassing of H2O vapor, and Cl distribution and speciation
between silicate melts and H2O‐rich fluids display
large pressure dependencies [Sourirajan and Kennedy, 1962; Shinohara, 1994, 2009; Candela and Piccoli, 1995]. For high Cl concentrations and pressures lower than ∼200 MPa, fluid immis-cibility generally occurs, generating a Cl‐poor H2O
vapor and a dense Cl‐rich hydrous fluid. Numerous studies have investigated Cl distribution in various silicate melt compositions and experimentally determined Cl fluid/melt partition coefficients (KClf/m) [Kilinc and Burnham, 1972; Webster and
Holloway, 1988; Shinohara et al., 1989; Métrich and Rutherford, 1992; Webster, 1992a; Kravchuk and Keppler, 1994; Shinohara, 1994; Candela and Piccoli, 1995; Webster, 1997; Webster and Rebbert, 1998; Signorelli and Carroll, 2000; Carroll, 2005; Chevychelov et al., 2008; Alletti et al., 2009]. These experimental results indi-cate that KClf/mdepends on pressure and temperature,
melt composition (in particular the Na+K/Al ratio) and H2O and Cl melt concentrations. KClf/m values
increase with decreasing temperature, decreasing/ increasing pressure and increasing Cl concentra-tions in the melt. Temperature effects are generally considered negligible because temperature varia-tions during the studied degassing processes are
low and the temperature dependence of KClf/mis low.
The dependence of KClf/mwith pressure is significant
but no experimental data for felsic magmas exist for P < 50 MPa, where HCl is the dominant species (for basalts, see Alletti et al. [2009]). KClf/m values
increase with increasing silica activity or decreasing Mg, Ca or Fe concentrations; they are maximized for subaluminous melts [Na+K/Al∼ 1] and decrease as melts become more aluminous or peralkaline. Experimental data indicate that KClf/m values are
higher for rhyolitic melts than for alkaline felsic melts. During magma ascent, the large extent of degassing‐induced crystallization modifies melt compositions and tends to increase KClf/min rhyolitic
melts as the Si concentration increases and Mg, Ca and Fe decrease, and as the (Na+K)/Al ratio tends toward 1 [Villemant et al., 2003]. Modeling of degassing during open system conditions including melt crystallization shows that the behavior of H2O
and halogens are consistently reproduced using experimental equilibrium partition coefficients and their variations with melt composition [Villemant et al., 2003, 2008]. Bulk melt composition, melt Cl concentration and pressure are probably the most influential parameters on KClf/m in the studied
systems.
3.2.2. Kinetic Effects: Role of Diffusivities and Viscosities
[28] Volatile diffusivity in melts may significantly
affect their degassing efficiency especially for rapid magma ascent rates during plinian eruptions [Alletti et al., 2007; Gardner et al., 2006]. Volatile transfer from melt to vesicles depends both on the equi-librium KClf/m values and as well as on diffusion
coefficients, chemical gradients, the thickness of bubble walls and time. Cl diffusivities in felsic melts are one order of magnitude slower than H2O
diffusivities [Bai and Koster van Groos, 1994]. Bubble growth models in a semi‐infinite medium show that for bubble growth rates higher than 10−8m2s−1, which prevail during plinian eruptions, and for large KClf/m values, departures away from
equilibrium compositions may be significant for Cl [Balcone‐Boissard et al., 2008]. However, during magma ascent, vesicles nucleate and expand rapidly so that the distance between bubbles is strongly reduced for large vesicularities. The mean diffusive path length of volatiles in the melt becomes rapidly smaller than the bubble wall thickness and diffusion has a negligible effect on the gas composition in the bubbles. It is unlikely that diffusion has a sufficiently limiting effect to explain the observation that all the investigated felsic
magmas from plinian eruptions display effective KClf/m values lower than equilibrium values. KClf/m
values required to model Cl evolution during lava dome‐forming eruptions are close to equilibrium values. This observation indicates that diffusion is probably not a limiting factor. Ascent and degas-sing rates are much lower than during plinian eruptions favoring equilibrium processes. More-over, the degassing‐induced crystallization of melts significantly increases the gradient in volatile con-centrations between melt and vesicles, which enhances H2O and halogen transport from melt to
vesicles.
[29] Melt viscosity is strongly dependent on
varia-tions of temperature, dissolved H2O concentrations
and bulk melt composition, while pressure depen-dence is insignificant below 2 GPa [Dingwell et al., 1996]. H2O degassing significantly increases
magma viscosity by increasing the degree of silicate melt polymerization and by inducing melt crystal-lization [Atlas et al., 2006; Giordano et al., 2008].
4. Results
[30] Major element compositions of bulk rocks and
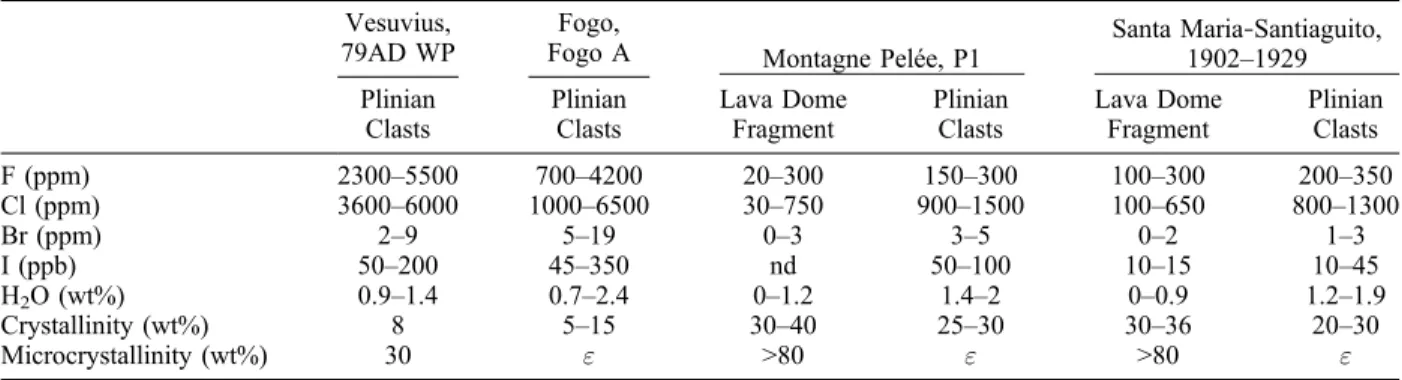
groundmass (assumed to be equivalent to residual melts) for each eruption are given in Table 1. Calculated crystallinity and microcrystallinity esti-mates are reported in Table 2a. Measured H2O and
halogen composition ranges of groundmass are given in Table 2b. When available, estimates of “initial” volatile concentrations from melt inclusion analyses are also reported.
4.1. Vesicularity, Crystallinity and Microcrystallinity
[31] We collected at least 100 pumice clasts in each
eruptive unit, and sieved them (with a sieve of 16 mm in diameter) to select fragments large enough to perform all analyses on the same clast. Each pumice clast was washed and sawed into three parts: the first part was used for density measure-ments, the second part was powdered for bulk chemical analyses, and the third part was dedicated to thin section preparation for textural character-ization (SEM) and chemical microanalysis (EPMA). The analyzed volcanic clasts were selected on the basis of their density distribution. At least three pumice clasts were selected, one near the median density and one each at the low and high density tails. They represent a large range of degassing regimes and degrees, characteristic of the degassing processes involved in the different
eruptions. In eruptions that had both explosive and effusive phases textural and chemical characteristics of both pumice clasts and lava‐dome fragments were studied.
[32] In large phonolitic and trachytic plinian
erup-tions, the vesicularity distribution is unimodal, centered around 80%, with a low dispersion. The calc‐alkaline plinian eruptions display similar vesicularity ranges and distributions. Lava‐dome fragments have significantly lower vesicularities than pumice clasts. All studied plinian sequences are characterized by highly vesicular pumice clasts, irrespective of chemical composition (rhyolite, trachyte or phonolite). Pumice clasts show large, spherical bubbles (from a few microns to around one hundred microns in diameter) with thin glassy septae (≤5mm thick), which are evidence sup-porting the lack of significant gas loss and melt crystallization during magma ascent and degassing. Conversely, vesicles in lava‐dome fragments dis-play a large variation in size and shape, with complex, contorted bubbles, evidence of vesicle coalescence and flattening that occasionally create degassing channels, indicating that gas was able to escape from the magma column. The coalesced bubbles may reach several hundreds of
micro-meters in length, with bubble wall thicknesses larger than 100 mm. The phenocryst concentra-tions in calc‐alkaline magmas (rhyolitic melt) are high (>25 wt%) compared to the other melts; tra-chytic and phonolitic melts display low phenocryst concentrations (<10 wt%). Plinian eruptive pro-ducts contain glassy matrices with no or low (<30 wt%) microlite concentrations, indicating that melt is in a mestastable state, as a result of the high magma ascent velocity that prevented the melt from crystallizing by kinetic limitations until the point of fragmentation and quenching. However, the matrices of lava‐dome fragments are highly microcrystalline (up to 100% in some cases), indicating that degassing and crystallization pro-cesses occurred at equilibrium.
4.2. Relative Behavior of Halogens During Felsic Magma Differentiation and Degassing
[33] Both pre‐eruptive melts (preserved in melt
inclusion) and post‐eruptive melts (residual glass in groundmass) of trachytic and phonolitic magmas contain higher concentrations of halogens than rhyolitic melts (Tables 2a and 2b). Cl, Br and I display single correlations (within analytical errors) Eruptionsa
Vesuvius, 79AD WP
Fogo,
Fogo A Montagne Pelée, P1 Santa Maria1902–1929‐Santiaguito, Plinian Clasts Plinian Clasts Lava Dome Fragment Plinian Clasts Lava Dome Fragment Plinian Clasts F (ppm) 2300–5500 700–4200 20–300 150–300 100–300 200–350 Cl (ppm) 3600–6000 1000–6500 30–750 900–1500 100–650 800–1300 Br (ppm) 2–9 5–19 0–3 3–5 0–2 1–3 I (ppb) 50–200 45–350 nd 50–100 10–15 10–45 H2O (wt%) 0.9–1.4 0.7–2.4 0–1.2 1.4–2 0–0.9 1.2–1.9 Crystallinity (wt%) 8 5–15 30–40 25–30 30–36 20–30 Microcrystallinity (wt%) 30 " >80 " >80 " aH
2O and halogen concentrations: whole rock measurements corrected for phenocryst content. Crystallinity: weight fraction of phenocrysts in
bulk rocks estimated from mass balance calculations except for Fogo A, where image analysis was used. Microcrystallinity: weight fraction of microlites in the groundmass, estimated from SEM images, except for the Vesuvius eruption. For the Vesuvius white pumice the microcrystallinity was estimated from F and Cl concentrations assuming no degassing and incompatible element behavior; these estimates are consistent with literature data (SEM image analysis [Gurioli et al., 2005]).": negligible amounts.
Table 2b. Volatile Concentrations in Melt Inclusionsa
Vesuvius, 79AD WP
Fogo,
Fogo A Montagne Pelée, P1 Santa Maria1902–1929‐Santiaguito, Plinian Clasts Plinian Clasts Lava Dome Fragment Plinian Clasts Lava Dome Fragment Plinian Clasts
F (ppm) 2000–5000 500–4500 n.d. 150–300 n.d. 100–300
Cl (ppm) 5300 1300–7500 n.d. 1400–2100 n.d. 700–1600
H2O (wt%) 5 (1) 6.5 (2) n.d. 5.5 (3) n.d. 5–7 (3)
aF and Cl concentrations: EPMA measurements. H
2O concentrations: (1) estimated from multiphase equilibrium of a Cl‐rich H2O vapor
for each studied eruption, irrespective of variations in initial melt compositions or degassing regime (Figure 2). However, due to the low precision of the I measurements, the constancy of the Br/I ratio is puzzling and should be confirmed by more accurate and precise iodine measurements, which requires further improvements in analytical
tech-niques. [Michel and Villemant, 2003; Chai and Muramatsu, 2007; Balcone‐Boissard et al., 2009]. Relative to other halogens, the behavior of F is variable and mainly depends on magma com-position (Figure 2). In trachytic melts, F is always linearly correlated to Cl. In the phonolitic melt of Vesuvius, F and Cl are not correlated because of
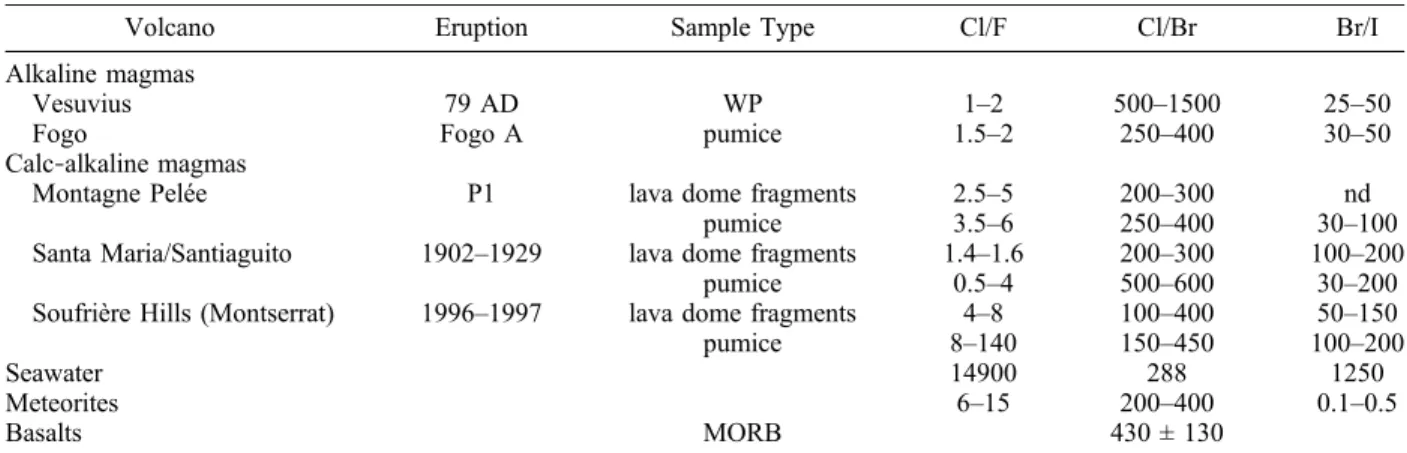
Figure 2. Halogen composition of groundmass from alkaline and calc‐alkaline magmas (trachytic, phonolitic and rhyolitic melts). Compositions are obtained from bulk rock analyses corrected for phenocryst concentrations. Chem-ical ratios (Cl/F, Cl/Br, Br/I) of some reference materials are also plotted: chondrites (gray domain), basalts (solid line) and seawater (dashed line) (literature data, see Table 3). Compositional ranges are reported in Table 2a. Each alkaline magmatic system (Vesuvius and Fogo A, on the right) is represented by one symbol corresponding to plinian activity. Each calc‐alkaline system (Montagne Pelée and Santa Maria–Santiaguito, on the left) is represented by two symbols corresponding to plinian (open symbols) and lava‐dome forming eruptions (solid symbols).
small variations in Cl concentrations. In calc‐ alkaline magmas (rhyolitic melts), the F concen-tration in the groundmass remains almost constant within a relatively low and narrow range (100– 300 ppm), in contrast to other halogens, whose con-centrations vary significantly with degassing (as a result of H2O loss).
4.2.1. Cl/F Ratio
[34] In alkaline magmas the Cl/F ratio of pumice
clasts is constant for a given eruption and varies within a narrow range for all studied systems (Cl/F = [1–2]; except for Vesuvius). In calc‐alkaline systems (rhyolitic melts) the Cl/F range of lava‐ dome fragments and pumice clasts is larger ([2–8]; Figure 2). The Cl/F ratio in pumice is always twice as high as in lava‐dome fragments (Figure 2). The Cl/F ratios of the investigated magmas are con-siderably lower than the Cl/F ratio of seawater (∼15000), which is characterized by an extreme depletion in F, but are similar to chondrites (6–15 [Goles and Greenland, 1966; Dreibus et al., 1979, 2004]).
4.2.2. Cl/Br Ratio
[35] The Cl/Br ratio ranges between 170 and 1000,
with no apparent systematic behavior between different volcanoes and melt compositions. The Cl/ Br ratio of all studied magmatic systems covers the whole range of Cl/Br ratios observed for chondrites (200–400), basalts (430 ± 130 in MORB [Schilling et al., 1980; Jambon et al., 1995]) and seawater (300). Such large variations in magma composi-tions at small spatial or temporal scales are also observed for the Santa Maria‐Santiaguito samples, for which the Cl/Br ratio of the 1902 plinian pro-ducts is ∼500 whereas the lava dome‐forming
fragments from the same time period have a Cl/Br ratio of ∼300 (Table 3). The magma source of the 1902 eruption could have been depleted in Br rel-ative to Cl. Small scale heterogeneities in Cl/Br ratios of magma sources are of the same magnitude for all calc‐alkaline series (Guatemala and Antilles). The large plinian eruption of Fogo A also displays a seawater‐like Cl/Br ratio, whereas Vesuvius magmas have a high Cl/Br ratio of ∼850 ± 200. 4.2.3. Br/I Ratio
[36] The Br/I ratio is apparently homogeneous
(∼45) in the pumices of Fogo A, Vesuvius and Montagne Pelée, whereas Br/I is higher (∼90) in clasts from the Santa Maria‐Santiaguito eruption. The Br/I ratio for lava‐dome fragments is high (∼110) in clasts from the Santa Maria‐Santiaguito eruption. The Br/I ratio measured in volcanic rocks is apparently lower than the mean ratio of chon-drites [Goles and Greenland, 1966; Dreibus et al., 2004], but, as indicated above, this result has to be confirmed by more accurate analyses.
5. Discussion: The Relative Behavior
of Halogens
[37] Correlations between volatile concentrations of
the different clasts from the same eruptive sequence may be interpreted in terms of their relative behavior during shallow degassing and/or magma differen-tiation. A linear correlation through the origin indicates that the volatile species display similar behavior, i.e., similar crystal/melt and vapor/melt partition coefficients. If the residual concentrations of two halogens in volcanic clasts are correlated through the origin, their ratio is constant and char-acteristic of the shallow magma reservoir.
Volcano Eruption Sample Type Cl/F Cl/Br Br/I
Alkaline magmas
Vesuvius 79 AD WP 1–2 500–1500 25–50
Fogo Fogo A pumice 1.5–2 250–400 30–50
Calc‐alkaline magmas
Montagne Pelée P1 lava dome fragments 2.5–5 200–300 nd
pumice 3.5–6 250–400 30–100
Santa Maria/Santiaguito 1902–1929 lava dome fragments 1.4–1.6 200–300 100–200
pumice 0.5–4 500–600 30–200
Soufrière Hills (Montserrat) 1996–1997 lava dome fragments 4–8 100–400 50–150
pumice 8–140 150–450 100–200
Seawater 14900 288 1250
Meteorites 6–15 200–400 0.1–0.5
Basalts MORB 430 ± 130
[38] The measurements show a large range of Cl/F
ratios in calc‐alkaline magmas. This range is related to the different behavior of F and of Cl during H2O
degassing that lead to large variations in Cl, Br, and I concentrations, whereas F concentrations remain almost constant in different clasts. Conversely Cl/ Br/I ratios are always preserved during magma degassing and differentiation, at least in differen-tiated magmas (acid andesites, trachytes and pho-nolites). As a consequence, the halogen (except F) ratios for one magmatic system may be estimated from the measurement in any erupted product and linked to the halogen concentration characteristics of the shallow magma reservoir. This result is likely valid for basaltic magmas and their differ-entiation products because most mineral phases involved in basaltic petrogenesis do not fractionate halogens. However, halogen‐bearing minerals (amphiboles, micas, apatites, etc.) may fractionate halogens and thus modify halogen ratios in mag-mas. These variations may be generally limited because they depend on both the halogen concen-tration in minerals, the mineral weight fraction, and the mineral halogen ratio (see for example the case of amphiboles in Soufrière Hills, Montserrat [Villemant et al., 2008]). In addition, calc‐alkaline magmas display variable ratios from one volcano to another, possibly due to modification of the Cl/Br/I ratios by fluid transfer during mantle partial melt-ing, contamination or fluid recycling in subduction zones [Wallace, 2005]. The large variations in hal-ogen ratios between meteorites and magmas reflect fractionation occurring during early differentiation of Earth. This distribution reflects halogen incom-patibility during partial melting. Little is known about the concentrations of halogens in the solid earth reservoirs and about the main factor control-ling the behavior of halogens during other processes such as crystallization and degassing, and their role in subduction zones to discuss about halogen recycling [Kent et al., 2002; Straub and Layne, 2003; Wallace, 2005; Aiuppa et al., 2009].
5.1. Behavior of Halogens During Alkaline Magma Differentiation and Degassing
5.1.1. Incompatible and Non‐volatile Behavior of Halogens: The Fogo A Eruption
[39] Halogen concentrations in pumice clasts
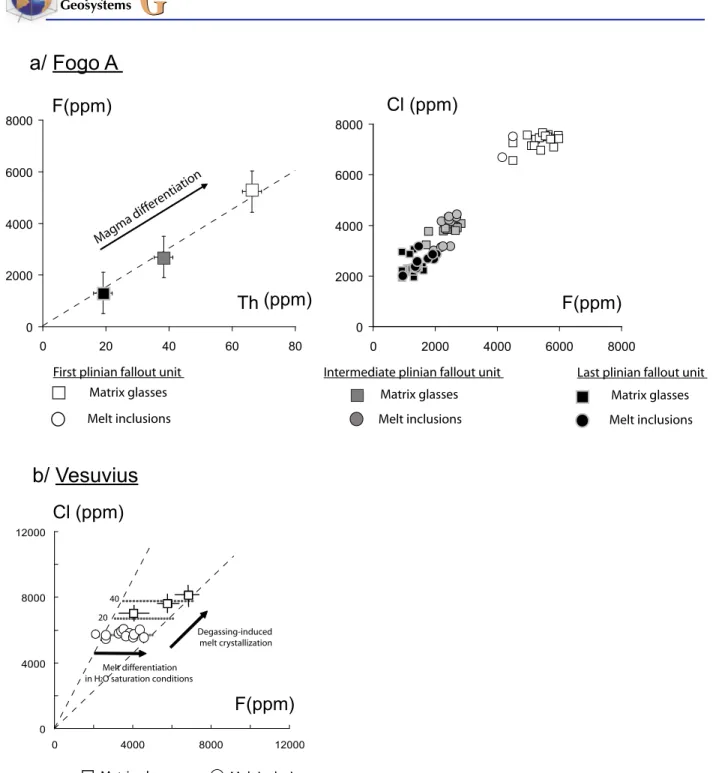
emitted during the plinian phase of the Fogo A eruption vary through a large range but display constant F/Cl/Br/I ratios (Figures 2 and 3). The halogen concentrations are highly homogeneous within a given eruptive unit and strongly decrease
from the first to the last plinian fallout. F remains linearly correlated to Th from the first to the last plinian fallout indicating that F behaves incom-patibly (Figure 3a). Correlations through the origin (Figures 2 and 3) between all halogens from all the plinian fallout units demonstrate that during magma differentiation halogens behave as incompatible elements and no volatile‐rich mineral phase was able to fractionate halogens crystallizes in sufficient amounts to significantly modify their relative abundances. This halogen zonation is acquired by magmatic differentiation at depth, as exemplified by melt chemistry [Widom et al., 1992; Watanabe et al., 2005; Snyder et al., 2007]. Melt inclusions and the corresponding matrix glass have similar F and Cl concentrations (Figure 3a) in all eruptive units. Residual H2O concentrations in all pumice
clasts are low (∼0.5–2.5 wt% H2O; groundmass
concentration; Figure 5) compared to the initial H2O concentration of 6.5 wt% [Wolff and Storey,
1983]: H2O is extracted during magma ascent which
controls the plinian eruptive regime. On the contrary, halogens are not significantly extracted from the melt during H2O degassing. In addition, halogens
are not significantly fractionated relative to each other, at both the deep magma differentiation stage and the shallow degassing stage, which means that the halogen composition of erupted fragments directly reflects that of the pre‐eruptive magma.
5.1.2. Pre‐eruptive Fractionation and Syn‐eruptive Non‐volatile Behavior of Halogens: The Vesuvius Eruption
[40] F and Cl concentrations measured in the white
pumice clasts of the Vesuvius eruption are higher in the matrix glass than in melt inclusions (Figure 3b). Contrary to the Fogo A eruption, syneruptive crys-tallization is significant during the white pumice plinian phase (Balcone‐Boissard et al., submitted manuscript, 2010). The close correspondence between microcrystallinity estimates (∼25–35%, image analysis [Gurioli et al., 2005]) and F and Cl enrichment factors between melt inclusions and matrix glasses (∼20–40%, Figure 3b) also suggests that halogens behave as incompatible elements during syn‐eruptive melt crystallization and are not significantly affected by degassing processes.
[41] The behavior of halogens in the reservoir prior
the Vesuvius eruption is complex (Figure 3b). Balcone‐Boissard et al. [2008] have shown that prior to eruption parts of the magma, though dis-playing significant variations in differentiation degree have almost constant Cl concentrations.
Figure 3. F and Cl concentrations in melt inclusions and matrix glasses of the Vesuvius (phonolite) and the Fogo A (trachyte) plinian eruptions. (a) F, Cl and Th concentrations in matrix glass and melt inclusions in Fogo A. F and Cl concentrations in matrix glass and melt inclusions are measured by EPMA (first plinian fallout: 22 values; last plinian fallout: 17 values). Th concentrations are obtained by ICP‐MS on separated glass (first plinian fallout: 3 values; last plinian fallout: 4 values). Mean F and Th in the three eruptive units display a clear linear correlation through the origin indicating that F is an incompatible element. F and Cl concentrations of melt inclusions (circles) and matrix glasses (squares) are identical in pumice clasts irrespective of the eruptive unit. Open symbol: first plinian fallout eruptive unit. Grey symbol: intermediate plinian fallout eruptive unit. Black symbol: last plinian fallout eruptive unit. (b) F and Cl contents in matrix glass and melt inclusions of white pumice clasts of Vesuvius. Squares: mean values of at least 10 analyses of matrix glasses from three fallout units [Balcone‐Boissard et al., 2008]. Circles: individual measurements of halogen concentrations in melt inclusions from feldspars. F concentrations in melt inclusions vary at constant Cl concentrations that correspond to melt differentiation in H2O‐saturation conditions. Differences in Cl and F concentrations between melt inclusions and matrix glass result from syn‐eruptive crystallization (degassing‐induced melt crystallization). Dashed horizontal lines refer to the calculated effects of different degrees of syn‐eruptive melt crystallization (in wt%). The analytical uncertainty is smaller than the symbol size.
This Cl buffering effect is interpreted as the result of aqueous fluid + brine saturation of the melt. At a given T, P and melt composition, part of the pre‐ eruptive silicate melt is in equilibrium with two immiscible fluid phases (a H2O‐rich vapor and a
Cl‐rich brine). Equilibrium between silicate melt and subcritical NaCl‐H2O fluids, at a given
tem-perature and pressure, fixes the Cl concentration in the three coexisting phases [Lowenstern, 1994; Signorelli and Capaccioni, 1999; Signorelli and Carroll, 2000]. At these conditions, the knowledge of the Cl melt concentration allows estimation of pre‐eruptive conditions (H2O concentration and
pressure), using Cl and H2O solubility laws
[Balcone‐Boissard et al., 2008]. This particular process occurs in Cl‐rich phonolitic melts that reached H2O saturation at relatively low pressure
(∼180 MPa). At such pressures, H2O exsolution
strongly depletes the melt in Cl. This is not the case if the melt with similar composition is H2O
undersaturated. The relative behavior of Cl and Br in the white pumice melts suggest that Br may also be affected by such fluid immiscibility at H2O
saturation. Contrary to other halogens, F displays no influence of H2O saturation.
5.1.3. Summary of Halogen Behavior in Alkaline Magmas
[42] The results for trachytic and phonolitic melts
show that during plinian eruptions involving alka-line magmas, halogens cannot be significantly extracted from the melts by rapid H2O degassing.
The Cl concentrations in residual glasses are not related to the large variations in H2O
concentra-tions. This observation demonstrates that Cl is insensitive to explosive magma degassing. How-ever, if magmas are H2O‐saturated prior eruption,
Cl (and possibly other halogens) may be signifi-cantly extracted into the fluid phase before erup-tion, as exemplified by Vesuvius. In addierup-tion, the existence of a buffered Cl concentration is clear evidence of efficient Cl extraction from pre‐eruptive melts into a brine coexisting with a hydrous fluid phase at P < 200 MPa. If pre‐eruptive H2O
satura-tion occurs at P > 200 MPa, only a single H2O‐rich
fluid phase is in equilibrium with melt, and the Cl concentration in melt may freely vary. In this case, the analysis of residual melt compositions cannot provide evidence for H2O saturation.
[43] The large range of halogen behavior during
H2O degassing in alkaline magmas is probably
related to kinetic effects. Cl extraction by an ex-solving H2O‐rich fluid is highly efficient at
rela-tively high pressures (P < 200MPa), in pre‐eruptive conditions, whereas H2O degassing during
explo-sive degassing (plinian eruption) is not efficient at extracting halogens. This suggests that pre‐eruptive halogen extraction by a fluid phase in a H2O
sat-urated magma occurs at, or at least near, equilib-rium, which is not the case for rapid H2O extraction
characteristic of plinian eruption. However, KClf/m
values are highly pressure dependent and, as indi-cated by the few available experimental data at low pressure and theoretical considerations [see, e.g., Shinohara, 1994, 2009; Candela and Piccoli, 1995; Alletti et al., 2009], KClf/mvalues may decrease with
decreasing pressure. The above results could be indicative of a very rapid decrease of effective KClf/m
values down to 0 with decreasing pressure. This rapid variation in Cl solubility in silicate melts in equilibrium with a H2O‐rich fluid is likely related
to the pressure dependence of Cl speciation and to Na+, K+ and H+exchange reactions between fluid and melt.
[44] During plinian eruptions of alkaline magmas,
the halogen concentrations of gas plumes might be very low because halogens are not significantly affected by shallow explosive H2O degassing,
unless pre‐eruptive fluid phases accumulated in the magma chamber are also emitted at the onset of the eruption.
5.2. Halogen and H2O Degassing During
Calc‐Alkaline Magma Eruptions
[45] H2O is the major volatile phase in rhyolitic melts
of calc‐alkaline magmas and the H2O concentration
in erupted clasts varies strongly (Figure 4). H2O
degassing of rhyolitic melts modifies their Cl, Br and I concentrations (Figure 4; but not F). The pumice clasts and lava‐dome fragments emitted during the same eruption (Montagne Pelée or Santa Maria‐Santiaguito), involve the same initial melt composition, notably the same initial volatile con-centrations. Conversely, the textural characteristics (Table 2a) and the residual volatile concentrations (H2O, Cl, Br and I) of the two types of clasts
strongly differ. The textural differences reveal dif-ferent degassing modes. Volatile concentrations in matrix glass or in groundmass of both lava‐dome fragments and pumice clasts of the same eruption define continuous trends (Figure 2) with system-atically lower values in lava‐dome fragments compared to pumice clasts. Degassing is much more efficient in lava dome‐forming eruptions than in plinian eruptions, but both degassing regimes follow the same initial degassing steps. Thus, during
rhyolitic melt degassing, Cl, Br and I are extracted in the H2O vapor phase but the extraction efficiency
is strongly dependent upon the degassing regime.
[46] Because of the complex relative behavior of Cl
and H2O, the apparent Cl/H2O ratios measured in
volcanic clasts are not conservative parameters (Figure 4). The wide range of Cl/H2O ratios may be
interpreted as the consequence of strong fraction-ation between Cl and H2O [Wallace, 2005]. In
subduction zones many processes may involve Cl/H2O fractionation, such as the devolatilization
of the slab or the migration of slab‐derived fluids through the mantle wedge [Wallace, 2005; Kent et al., 2002]. Melt inclusion compositions are used as best estimates of pre‐eruptive melt com-positions and the degassing steps leading to plinian eruptions are characterized by large H2O losses (by
a factor ∼3), but a small depletion of Cl (<20%). On the contrary, lava dome‐forming eruptions pro-duce more completely degassed magmas, largely depleted in both H2O and Cl (Figure 4).
5.3. Influence of the Eruptive Style on the Behavior of Halogens
5.3.1. Lava Dome‐Forming Eruptions
[47] During lava dome‐forming eruptions, here
exemplified by calc‐alkaline magmas (rhyolitic
melts), both H2O and halogen degassing are
sig-nificant. The compositions of the lava‐dome fragments systematically plot in the open system degassing domain (Figure 5). Microlite‐rich groundmass, irregular and flattened vesicles and low residual gas concentrations are common fea-tures of lava‐dome fragments and characteristic of open system degassing. Gas escape from the ascending magma, favored by vesicle connection and collapse, reduces the magma ascent rate and allows melt crystallization in response to H2O
degassing, which in turn reduces the ascent rate by increasing magma viscosity. H2
O‐vapor/sili-cate melt partition coefficients of halogens are greater than 1 (except for F) and vary over a large range. Because of the low ascent rate, H2O
degas-sing is close to equilibrium during lava dome‐ forming eruptions and induces two opposite effects on halogen concentrations in matrix glass: depletion (except for F) due to H2O vapor exsolution and
enrichment due to degassing induced crystalliza-tion. Thus, during degassing‐induced melt crystal-lization the incompatible behavior of halogens competes with degassing effects. The net effect depends directly on the ratio between crystallization and degassing rates, which leads to significant variations of the apparent KClf/mvalues [Villemant et
al., 2008]. The efficient extraction of both H2O and
halogens (except F) during lava dome‐forming
Figure 4. Cl and H2O compositions of the groundmass in trachytes, phonolites and rhyolitic melts. For rhyolitic melts (andesite bulk rocks) the mean composition of melt inclusions is reported and the pumice clasts (open symbols) and lava‐dome fragments (filled symbols) are identified. For phonolitic and trachytic melts, composition domains of melt inclusions are reported. For Fogo A data are from Wolff and Storey [1983].
eruptions is contrary to what is observed for plinian eruptions (Figure 5). In addition, the large extent of degassing‐induced crystallization modifies melt compositions and tends to increase KClf/min rhyolitic
melts as it increases Si concentration, decreases Mg, Ca and Fe concentrations and as the (Na+K)/Al ratio tends to 1. Modeling of degassing during dome‐ forming eruptions (open system degassing model including melt crystallization) shows that the behavior of H2O and halogens is consistently
re-produced using experimental equilibrium partition coefficients and variations with melt compositional evolution [Villemant et al., 2003, 2008]. No lava dome‐forming eruption involving phonolitic or trachytic melt has been studied in this paper, but observations on calc‐alkaline lava‐dome forming eruptions suggest that halogens could also be effi-ciently extracted during effusive eruptions involv-ing alkaline magmas.
5.3.2. Plinian and Vulcanian Eruptions
[48] The evolution of H2O and Cl concentrations of
groundmass as a function of the vesicularity in volcanic clasts from the different plinian eruptions are compared to theoretical models (Figure 1). The high vesicularity with well developed, spherically shaped vesicles separated by an almost completely glassy matrix characteristic of plinian clasts is con-sistent with the assumptions of the closed‐system degassing model. Both H2O and Cl concentrations
in the groundmass of pumice clasts from the calc‐ alkaline series are consistent with closed system degassing models based on the estimated initial melt compositions (Table 2b), the H2O solubility law for
rhyolitic melts, and assuming low Cl vapor‐melt partition coefficients (typically∼20). The small dif-ferences between the Cl concentrations of melt inclusions and of the pumice clast groundmass highlight the low Cl extraction efficiency during
Figure 5. Evolution of H2O and Cl concentrations as a function of vesicularity (Vg/Vl). H2O versus Vg/Vl: lines correspond to closed‐system degassing models for different initial melt compositions (5 wt% H2O for calc‐alkaline magmas and 5 and 6.5 wt% H2O for alkaline magmas). Cl versus Vg/Vl: pre‐eruptive Cl concentrations are estimated from melt inclusion measurements (mean values) and represented with a Vg/Vl = 0. For calc‐alkaline magmas, lines refer to closed‐system degassing models with different initial Cl concentrations (1800 and 1150 ppm, corresponding to the range of Cl concentrations measured in melt inclusions) and KCl
v/m
values (Kv/m= 30 and 5), which best fit the Santa Maria‐ Santiaguito clast compositions (Santa Maria models). For alkaline magmas, the range of Cl composi-tions in melt inclusions is reported (Vg/Vl = 0).
eruptions from the ongoing eruption of Soufrière Hills on Montserrat [Villemant et al., 2008; Humphreys et al., 2009], have significantly lower H2O
con-centrations than pumice clasts of the Montagne Pelée and Santa Maria‐Santiaguito. This difference is explained by significantly lower H2O concentrations
in the melt (∼2 wt%) before the onset of the vulcanian activity at Soufrière Hills compared to plinian erup-tions in similar geodynamic settings. This low initial H2O concentration is the result of the very shallow
origin of vulcanian explosions, consistent with geo-physical data and models [Clarke et al., 2007; Druitt et al., 2002]. At these conditions vulcanian eruptions at Montserrat are only able to extract small amounts of H2O and Cl. Because the initial Cl concentrations
at Soufrière Hills are two to three times higher than at Montagne Pelée and Santa Maria‐Santiaguito, the residual Cl concentrations of Soufrière Hills vulca-nian clasts are much higher than in other calc‐alkaline pumice clasts. However, the Cl degassing paths in all of these three calc‐alkaline eruptions do not differ.
[49] Comparison of the characteristics (vesicularity
and water, F, Cl, Br, and I concentrations) of all plinian clasts demonstrates that the range of vesi-cularities and residual H2O concentrations are
sim-ilar for all eruptions and magma compositions. Degassing paths in H2O‐Vg/Vl diagrams are wholly
consistent with closed system degassing models for Vesuvius [Balcone‐Boissard et al., 2008]. For pumice clasts of Fogo A the closed system degas-sing model is consistent with H2O concentrations
and vesicularities only if initial H2O concentrations
are much larger than the previously estimated value of 6.5 wt% [Wolff and Storey, 1983], as shown in Figure 5), which is unlikely. In addition, the bulk vesicularity of these clasts varies while the residual H2O concentration remains approximately constant
(∼2 wt%; Figures 1 and 5). This may be explained by significant late vesicle expansion without further extraction of H2O from erupted melt or by
differ-ential migration of bubbles in the ascending magma [Kaminski and Jaupart, 1997].
[50] Finally these results show that extraction of Cl
and other halogens by H2O degassing in the
explo-sive regime (plinian eruptions) is less efficient for trachytic and phonolitic melts than for rhyolitic melts (Figure 5).
6. Conclusions
[51] The comparison of residual volatile
con-centrations and textures of a series of volcanic
from evolved calc‐alkaline and alkaline magmas highlights the following general behavior of halo-gens during H2O degassing:
[52] 1. All halogens display a similar behavior
during differentiation and degassing of phonolitic and trachytic melts. On the contrary, in calc ‐alka-line magmas, where the residual melt is rhyolitic in composition, F is fractionated from other halogens during differentiation and degassing processes, due to its greater stability in rhyolitic melt.
[53] 2. Halogen ratios (except those involving F in
rhyolitic melts) are conservative during magma differentiation and degassing. Iodine most probably behaves similarly to Br and Cl in rhyolitic melts, but improvements in the analytical technique to achieve higher precision are required to confirm this point. The ratios of Cl/Br/I measured in erup-ted clasts are thus characteristic of pre‐eruptive melts and likely of the more primitive magmas. Nevertheless, these ratios vary from one volcano to another, indicating that halogen fractionation occurred by fluid transfer or by mantle source heterogeneities inherited from early mantle dif-ferentiation and recycling.
[54] 3. In alkaline felsic magmas (phonolites and
trachytes) halogen concentrations are almost unaffected by H2O degassing in the plinian
erup-tion regime. Conversely, during plinian eruperup-tions involving calc‐alkaline magmas (rhyolitic melts), Cl, Br and I are significantly extracted by H2O
degassing, but less efficiently than predicted by available experimental fluid‐melt partition coeffi-cients. The difference between the partitioning determined in this study and that determined experimentally can differ by a factor as high as 5.
[55] 4. Effusive degassing during lava dome‐
forming eruptions of calc‐alkaline magmas is more efficient at extracting halogens and H2O than
explosive degassing. H2O and halogen behavior
during lava dome‐forming eruptions may be modeled assuming equilibrium degassing (i.e., using equilibrium partition coefficients and taking into account degassing‐induced melt crystalliza-tion). No information is yet available for halogen degassing in the effusive regime of alkaline felsic magmas. These results suggest that halogens would show similar features to those observed for effusive eruptions of calc‐alkaline magmas.
[56] 5. The differences in Cl (and probably Br and I)
behavior during effusive and explosive degassing cannot only be explained by kinetic effects. As