HAL Id: lirmm-01354318
https://hal-lirmm.ccsd.cnrs.fr/lirmm-01354318
Submitted on 18 Aug 2016
HAL is a multi-disciplinary open access
archive for the deposit and dissemination of
sci-entific research documents, whether they are
pub-lished or not. The documents may come from
teaching and research institutions in France or
abroad, or from public or private research centers.
L’archive ouverte pluridisciplinaire HAL, est
destinée au dépôt et à la diffusion de documents
scientifiques de niveau recherche, publiés ou non,
émanant des établissements d’enseignement et de
recherche français ou étrangers, des laboratoires
publics ou privés.
Thoroughly analyzing the use of ring oscillators for
on-chip hardware trojan detection
Maxime Lecomte, Philippe Maurine, Jacques Jean-Alain Fournier
To cite this version:
Maxime Lecomte, Philippe Maurine, Jacques Jean-Alain Fournier. Thoroughly analyzing the use of
ring oscillators for on-chip hardware trojan detection. ReConFig: ReConFigurable Computing and
FPGAs, Dec 2015, Mexico, Mexico. pp.1-6, �10.1109/ReConFig.2015.7393363�. �lirmm-01354318�
978-1-4673-9406-2/15/$31.00 c 2015 IEEE
Thoroughly analyzing the use of Ring Oscillators for
on-chip Hardware Trojan detection
Maxime Lecomte
CEA-Tech Gardanne, France Email: maxime.lecomte@cea.frJacques J.A. Fournier
CEA-Tech Gardanne, France Email: jacques.fournier@cea.frPhilippe Maurine
LIRMM Montpellier, France Email: philippe.maurine@lirmm.frAbstract—With the globalization of the IC design flow, struc-tural integrity verification to detect parasitic electrical activities has emerged as an important research domain for testing the genuineness of an Integrated Circuit (IC). Sensors like Ring Oscil-lators (RO) have been proposed to precisely monitor the internal behaviour of the ICs. In this paper we propose an experimental analysis of the impact of parasitic electrical activities on the frequencies of ROs and on the internal supply voltages measured. Our observations lead us to identify the limits of the usability of ROs for practical and embedded detection of Hardware Trojans.
I. INTRODUCTION
Due to the recent trend of outsourcing Integrated Circuit (IC) manufacturing and design, structural integrity verification of ICs has become a hot topic. From the specification step to that of packaging, and especially during the design step, a cir-cuit can be corrupted by a malicious adversary. This malicious modification of an IC structure is called a Hardware Trojan (HT) insertion and its effects can range from performance degradation (e.g. denial of service) up to more sophisticated effects like memory dumping, etc. [1].
A HT is composed of two parts, the trigger and the payload. The trigger is the mechanism that scans specific signals within the IC until a specific condition is met. When this condition is met, the payload is then executed. The trigger can either be generated externally (an external signal or a special external physical condition) or internally (an internal state of the IC, a special data configuration, etc). Moreover the trigger can either be combinational (where the sought condition is the result of a logical operation on several signals) or sequential (the triggering of the payload is related to a succession of internal states). The payload is the ‘malicious effect of the HT. The payload is ‘explicit’ when signals or logic blocks are directly added, removed or deactivated. It can also be ‘implicit’ which is the case when the effect cannot be directly observed like, for example, the thinning of particular wires. HT detection is a challenging problem, even after its activation when the payload is implicit; and it is even more difficult if we try to detect the HT before its activation. One reason is that the probability of triggering a HT during functional tests is low and testing is an expensive approach to that end. Inspecting the circuit through reverse engineering is also an expensive process in terms of costs and time which is destructive by nature for the device under inspection. If this method can guarantee with a high level of confidence the absence of HT in the de-processed IC, it doesn’t guarantee at all the absence of HT in all the remaining
ICs that have not been (destructively) inspected. Even though latest imaging based methods have proven to offer a really high confidence level [2], the approach is still destructive and does not cover the entire population of ICs.
Several non destructive methods for detecting HTs have been proposed since 2007. The first proposed approaches have suggested to analyze, using statistical techniques, the overall consumption of an IC to detect the impact of a HT. For example, in [3], a detection technique based on the Karhunen-Lo`eve theorem is proposed in order to identify the power consumption of a HT within process variations and noise. However, this paper only reports validations obtained by simulations which unfortunately do not take into account things like measurement noises. In addition, one may wonder if a global monitoring of an IC is an adequate solution. Moreover, the technique may not scale to complex Systems on Chip (SoC).
In order to enhance the detection capabilities of the pro-posed techniques, in 2008, the authors in [4] analyze locally the propagation delays of logical paths using embedded monitors. However, once again, only simulation results are provided. In order to improve detection capabilities, [5] proposes to integrate a hardware system allowing to monitor important nets of ICs. However, little information is given in this paper about the efficiency of the proposed technique or on the associated silicon overhead. In parallel to this approach, a test solution was also proposed in [6] in order to trigger easily a HT or at least to increase its electrical activity. In 2010, to eliminate process variations from the detection problem, [7] proposes to exploit the strong correlation between the max operating frequency of an IC, Fmax, and its dynamic
power consumption to detect the presence of an HT. If this approach is sound, it faces the difficult problem of measuring Fmax on a SoC. Finally in 2011, the use of Ring Oscillators
(RO) has been proposed to detect HTs. For example, [8] has provided an analysis of RO sensitivity to the presence of HT but concludes that it seems difficult to detect really small HT. At the same time, [9] suggested the use of an array of RO, used in conjunction with PCA [10] to distinguish infected ICs from genuine ones. This proposal has been experimentally validated on FPGA using a Digital Sampling Oscilloscope (DSO) (thus off-chip) to measure the oscillating frequency of ROs. In 2012, the proposed idea was also evaluated for a true ASIC [11]. However, the results present a lower success rate than those reported in [9]. This is may be caused by the use of an embedded counter to measure the oscillating frequency of RO,
which implies a poor accuracy. That point will be discussed later. This is the reason why we conducted a thorough analysis of the use of RO and counters for on-chip Hardware Trojan detection.
The rest of this paper is structured as follows. First in Section II, the conducted experiments and the measurement setups used are described. The accuracy of the oscillation frequency of RO is also quantified in this section as well as the impact of intra-die and inter-die variations based on measurements done on several boards. In Section III, the influence of a parasitic electrical activity on the oscillation frequency of ROs is quantified. To that end, an LFSR, whose length could be varied between 4 and 64 bits, is used to mimic the effect of a HT with an electrical activity equivalent corresponding to that of 2 to 32 D Flip-Flops (DFF). Then the influence of two main parameters, the electrical activity amplitude and the physical distance between this activity and the ROs under measurement, is analyzed experimentally. From these experiments the value of the internal voltage drop induced by a parasitic activity is finally inferred. Because all results of section III were obtained without any normal electrical activity in the IC, an un-realistic situation with respect to the operation of an infected IC, all experiments were repeated with an AES performing a ciphering during the measurements. The corresponding results are reported in Section IV. Based on all those results, a discussion about the use of ROs for embedded Trojan detection is conducted in Section V, before drawing a global conclusion in Section VI.
II. EXPERIMENTALSETUP
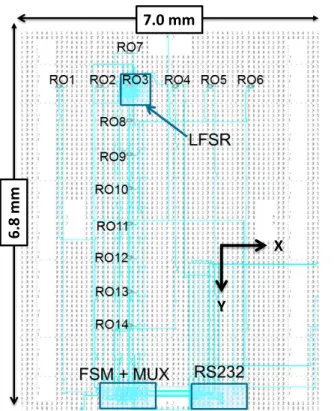
In order to analyze precisely the impact of a parasitic electrical activity on RO’s frequency, a target was designed and implemented on a Xilinx Spartan-3E 1600E FPGA [12] using Xilinx tools. It includes a Finite State Machine (FSM), a serial communication block (RS232) that handles the communication between the computer and the chip and 14 RO that can be enabled and measured separately. The FSM and the RS232 are placed far enough from the ROs so as not to influence them.
The 14 RO are placed as shown Fig. 1 showing the floorplan of the implemented circuit. This placement was adopted to allow a spatial analysis of the impact of an electrical activity on a RO, and more precisely on the supply voltage distribution in the chip. The 14 ROs have the same design composed of 4 inverters and 1 NAND2 gate in order to enable or disable each RO separately. The oscillating frequency (FRO)
of each RO is around 150 MHz depending on the local quality of the process. To improve the quality of the signal through the FPGA output pin, each RO is connected to a clock divider that allows a clean measurement of FRO/2 and hence FRO
(corresponding to a period TRO). The measurements are done
using a DSO from Lecroy with a sample rate of 40 GS/s (25 ps between 2 samples). In order to get an accuracy of ±0.25 ps on the FRO/2 measurements, we measured 100 oscillations
of FRO/2 and we repeated the process 100 times in order to
calculate an average value, < FRO>, and a standard deviation
σFRO. Each measurement lasts at most 7 s, in order to keep
the temperature constant. To ensure a stabilized voltage, a DC power supply with a 0.05 % accuracy was used to directly power the FPGA core after the removal of the voltage regulator
6.8 mm
7.0 mm
X
Y
Fig. 1. Place and Route of the design on the FPGA’s floor plan
of the board. To generate a parasitic electrical activity, a Linear Feedback Shift Register (LFSR) was placed all around the RO3 as shown Fig. 1. This RO was therefore considered to be at the coordinates (0,0) during all experiments. This LFSR was designed in such a way that we could change the word size between 4 and 64 bits. This was done to mimic a parasitic electrical activity equivalent to the flipping of 2, 8, 16 and 32 bits in order to analyze the influence of the amplitude of a parasitic electrical activity during the study.
Prior to any analysis, we first quantified the accuracy (including all measurement noise sources: circuit, laboratory, power supply, etc.) of our measurements and the impact of intra-die and inter-die variations. To that end we measured the mean value < ∆TR0i> and the standard deviation σROi of
the different ROs and this was repeated for several boards. Fig. 2 gives the RO periods for two different boards only to ease the reading. It shows that there are significant inter-die and intra-die variations which are responsible of changes in the RO periods of more than 100 ps. However, the most important point drawn from Fig. 2 is that the standard deviation of our measurements (independently of the considered board) varies from one ring oscillator to another on a range between 2.5 and 3.7 ps.
III. IMPACT OF A PARASITIC ELECTRICAL ACTIVITY ON
< TROi>
The impact of a parasitic electrical activity on the period of a RO is analyzed using the experimental set-up described previously. This analysis is done according to two main parameters. The first one is the amplitude of this electrical activity. The second one is the distance between the RO and the location of the parasitic electrical activity.
Fig. 2. Estimated (measured) values of < TROi> and σROi for two
different Spartan3E-1600
A. Amplitude of the parasitic electrical activity
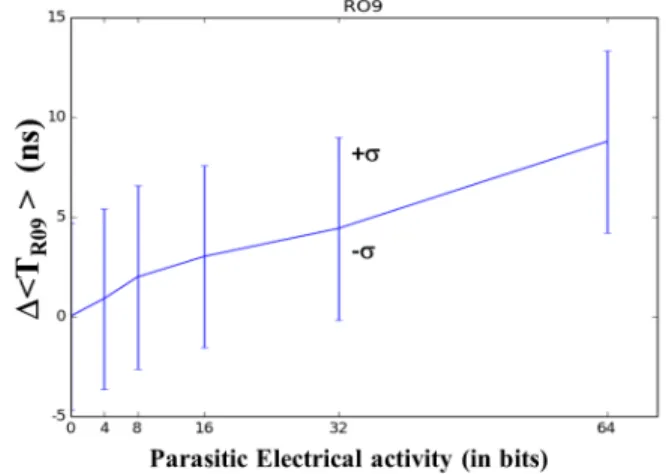
Fig. 3 shows the evolution of the mean, < TRO9>, of the
period measured from RO9 with respect to the amplitude of the parasitic electrical activity expressed in terms of switching bits (and more precisely switching DFF). Fig. 4 shows the difference, ∆ < TRO9>, between the period measured with
and without parasitic electrical activity for RO9. As shown, < TRO9> increases linearly from 13.892 ns up to 13.897 ns
with the amplitude of the parasitic electrical activity. This linear increase is due to the parasitic electrical activity as highlighted in Fig. 3 which shows that ∆ < TRO9 > also
increases linearly from 0 to 5 ps, i.e. only 0.043% of the < TRO9>. This value is very small compared to the effect
of process variations, even intra-die ones, whose effect can reach 500ps on this board. However, the RO9 is relatively far from the parasitic source. Let us analyze what happens on RO closer from the parasitic electrical activity.
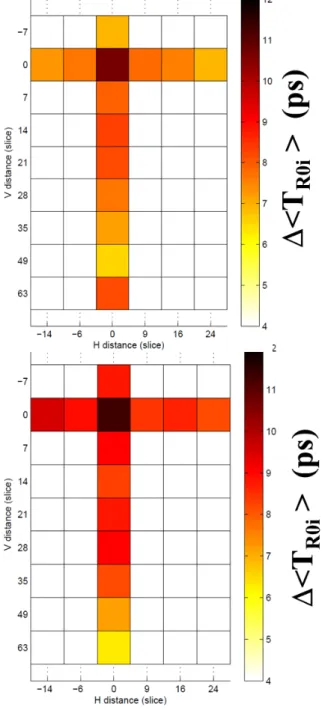
B. Distance between RO and the parisitic electrical activity To study the behaviour of the other ROs, we analyzed the impact of the distance between the parasitic electrical activity and the ROs on the latter’s frequencies. Fig. 6 shows two cartographies of ∆ < TROi> obtained with two different
Spartan3E-1600 devices for a parasitic equivalent activity equivalent to the switching of 32 DFF (LFSR configured to
Fig. 3. Evolution of < TRO9> w.r.t. to the amplitude of the parasitic
electrical activity
Fig. 4. Evolution of ∆ < TRO9> w.r.t. to the amplitude of the parasitic
electrical activity
work on 64 bits). The distance unit of these cartographies is the slice which was estimated to have a height equal to ∼ 120µm according to the number of slices (along X and Y) embedded in these devices and to their dimensions (measured using a microscope after chemical removal of the package).
As shown in Fig. 6, for RO3 placed right in the middle of the parasitic activity, the increase of its period is only of 8 ps. For the farthest ROs (RO1, RO6 and RO14) the influence is of about 5 ps. This value seems to be the minimum effect of the parasitic electrical effect; effect which is distributed over the whole device. This trend is confirmed by Fig. 5 that gives a projection of the two cartographies along Y axis (see Fig. 1 for the orientation). These results suggest that a parasitic electrical activity has a global effect (5 ps) on the power network of the device but also has a slightly more pronounced local effect (8 ps).
Nevertheless, these results also suggest that the effect of the switching of 32 DFF on the RO’s oscillation frequency is extremely small for the ROs (5 ps) furthest from the parasitic electrical activity as for the closest ones (8 ps). This is reassur-ing since these results reflect the fact that the power/ground networks are designed to be as little resistive as possible in
Fig. 5. ∆ < TROi> versus distance along Y axis for two different devices.
order to avoid the occurrence of important voltage drops that can compromise the timing constraints. Hence this shows that the induced voltage perturbation is global and with very low amplitudes.
Another interesting point highlighted by these experimental results is that the influence of the parasitic electrical activity on the ROs period (∆ < TR0i>) is relatively constant at a given
distance from the activity. This means that its effect seems to be relatively independent of the intra-die variations, and this is confirmed on the Fig. 6. This observation might be the starting point for new Trojan detection methods that would be naturally immune to process variations.
C. Parasitic electrical activity and internal supply voltage In order to evaluate the effective voltage near each RO, we characterized the sensitivity of a RO to its supply voltage. This was done with a DC power supply with an accuracy of 0.05 % and for a voltage range of [1.19 V, 1.2 V], considering that the circuit’s nominal voltage supply is 1.2 V. Fig. 7 shows the evolution of the mean oscillation period < TROi> against
Vdd, the supply voltage.
As expected, the period decreases linearly (−14ps/mV) with Vdd on this small voltage range. From there, we made a cartography of the voltage drop induced by a parasitic activity equivalent to the switching of 32 DFF. This cartography is represented in Fig. 8. It shows the maximum voltage drop is reached at the parasitic activity’s source location with a value of 0.5 mV. This voltage drop decreases as we move away from the parasitic activity with the distance with a minimum value of 0.25 mV. These values are far below the values considered, at the design stage, when applying corner analyses during static timing analyses (±10% of Vdd).
IV. IMPACT OF A PARASITIC ELECTRICAL ACTIVITY ON
TROiIN ANAES
Until now, we experimentally studied the impact of a parasitic electrical activity on the RO’s oscillation period and on the internal supply voltage. This impact can be observed using measurements made with a high sampling rate Digital Storage Oscilloscope (DSO). However, this impact remains
Fig. 6. Cartographies of ∆ < TROi> for two different Spartan devices
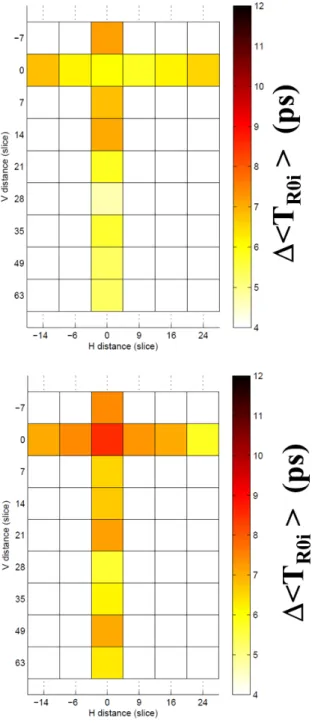
low relative to the effects of the intra-die and inter-die varia-tions. This study was conducted on a circuit without normal computing activity and hence does not accurately reflect the reality and in particular the effect of a hardware trojan whose trigger activity is synchronized by a part of the circuit. The previous measurements were repeated with an AES (placed in the neighbourhood of the structure shown Fig. 1) running in parallel. The Advanced Encryption Standard (AES) used is a hardware implementation of the NIST encryption standard specified in [13]. Moreover, the LFSR (as a HT) is clocked with a clock net of an AES register.
Fig. 9 shows the cartographies of ∆ < TROi>, obtained
Fig. 7. Evolution of the < TROi> w.r.t. to the supply voltage value Vdd
Fig. 8. Cartography of the voltage drop induced by a parasitic electrical activity equivalent to the switching of 32 DFF (LFSR 64 bits)
running in parallel. The first observation is that the figures with AES (Fig. 9) and those without AES (Fig. 6) are quite similar. As it can be seen, ∆ < TROi> varies between ∼ 5ps
and ∼ 8ps with respect to the distance from the parasitic electrical activity. The average impact of the HT (of the parasitic electrical activity) on the RO is therefore not altered at all by the activity of the AES. This is compliant with the superposition principle in linear systems. However, we noticed that the AES activity increases the dispersion of the TROi measurements resulting in an increase of the standard
deviation σROi from ∼ 3ps to ∼ 9ps. Consequently, the AES
computing activity imposes to do more precise estimations (measurements) of the < TROi> values. In practice this can
be achieved with more measurements (for example 200 oscilla-tions instead of 100). These consideraoscilla-tions prompt to examine the issues of integrated measurements, measurements that are done with a reduced sampling rate 2 GS/s for high speed circuits) compared to those measurements done with modern Digital Storage Oscilloscopes (40 GS/s up to 120 GS/s).
V. DETECTINGTROJANS WITHROAND COUNTERS
The results presented above show that an electrical activity equivalent to an 8-bit (resp. 32-bit) switching activity increases
Fig. 9. Cartographies of ∆ < TROi> for two different Spartan devices
the oscillation period by ∼ 3ps (resp. ∼ 8ps) through the induction of a 0.5 mV voltage drop. Because these values are really small, one can question the relevance of the choice of the couple (RO,counter) as an efficient sensor for integrated HT detection. Indeed, regardless of the oscillation period of the RO, the duration of the measurements (of the counting) that allows capturing an oscillation period drift of 5ps would be too high to be realistic. Hence one needs to ensure that measurement conditions are stable and that the measurement duration is compatible with the computing times of the func-tional blocks embedded in ICs. Also, the measurement time can be high compared to the active period of the HT’s trigger. In order to clarify this point, we estimated the required number of clock cycles (with a period of TCK) needed to measure a
drift of 3ps. We used the following formula: n = p · TCK
∆TRO
(1) with p being the difference between the number of rising edges counted in the presence of the HT and that counted without the HT, this value must be high enough regarding the fluctuations induced by the measurement noise. In our case for TCK= 20ns (the FPGA design runs at 50 MHz)
and ∆TRO= 3ps we obtain: n = 6667p. The counter must
be enabled during 6667 clock cycles (resp. 666 700 ) to mea-sure a counter difference of 1 (resp. 100 ). This represents a measurement time of 133 µs (resp. 13.3 ms) for one RO. During this period the experimental conditions have to remain stable. Based on such values, it seems hard to use the couple (RO,counter) to make an integrated method for HT detection. It appears that we need reliable sensors with a much more important sensitivity to local variations of the supply voltage for efficient and embedded HT detection techniques.
VI. CONCLUSION
This paper describes experiments conducted in order to answer two questions. The first is relative to the effect a HT on the ICs internal voltage and delays. The second is relative to the use of the couple (RO,counter), as a tool for embedded HT detection. With regard to the first question the experimental results show that the effect of Hardware Trojans on the supply voltage and delays are significantly below the effect of process variations. As a result, concerning the second question, too-high on-chip sampling rate values, or too long measurement times, are therefore required in order to capture the timing degradation induced by HT using RO. The couple (RO,counter) is not an adequate choice for embedded Hardware Trojan detection. ROs can be used if their frequencies are measured using off-chip DSOs. For completely on-chip solutions, sensors with higher sensitivity to supply voltage variations must hence be sought.
ACKNOWLEGMENT
This work was supported by the European Commission through the ICT programme under contract FP7-ICT- 2011-317930 HINT.
REFERENCES
[1] M. Tehranipoor, F. Koushanfar, D. Systems, and M. Graphics, “A Survey of Hardware Trojan Taxonomy and Detection,” pp. 10–25, 2010. [2] F. Courbon, P. Loubet-Moundi, J. J. Fournier, and A. Tria, “A high effi-ciency hardware trojan detection technique based on fast sem imaging,” in In the proceedings of DATE’15, March 2015.
[3] D. Agrawal, S. Baktir, D. Karakoyunlu, P. Rohatgi, and B. Sunar, “Trojan detection using ic fingerprinting,” in Security and Privacy, 2007. SP ’07. IEEE Symposium on, May 2007, pp. 296–310.
[4] J. Li and J. Lach, “At-speed delay characterization for ic authentication and trojan horse detection,” in Hardware-Oriented Security and Trust, 2008. HOST 2008. IEEE International Workshop on, June 2008, pp. 8–14.
[5] M. Abramovici and P. Bradley, “Integrated circuit security: New threats and solutions,” in Proceedings of the 5th Annual Workshop on Cyber Security and Information Intelligence Research: Cyber Security and Information Intelligence Challenges and Strategies, ser. CSIIRW ’09. New York, NY, USA: ACM, 2009, pp. 55:1–55:3.
[6] R. Chakraborty, F. Wolff, S. Paul, C. Papachristou, and S. Bhu-nia, “Mero: A statistical approach for hardware trojan detection,” in Cryptographic Hardware and Embedded Systems - CHES 2009, ser. Lecture Notes in Computer Science, C. Clavier and K. Gaj, Eds. Springer Berlin Heidelberg, 2009, vol. 5747, pp. 396–410.
[7] S. Narasimhan, D. Du, R. Chakraborty, S. Paul, F. Wolff, C. Pa-pachristou, K. Roy, and S. Bhunia, “Multiple-parameter side-channel analysis: A non-invasive hardware trojan detection ap-proach,” in Hardware-Oriented Security and Trust (HOST), 2010 IEEE International Symposium on, June 2010, pp. 13–18.
[8] C. Lamech, R. M. Rad, and M. Tehranipoor, “An Experimental Analysis of Power and Delay Signal-to-Noise Requirements for Detecting Tro-jans and Methods for Achieving the Required Detection Sensitivities,” no. September, pp. 1170–1179, 2011.
[9] X. Zhang and M. Tehranipoor, “Ron: An on-chip ring oscillator network for hardware trojan detection,” in Design, Automation Test in Europe Conference Exhibition (DATE), 2011, March 2011, pp. 1–6. [10] M. H. DeGroot and M. J. Schervish, Probability and Statistics (4th
Edition). Pearson, 2011.
[11] A. Ferraiuolo, X. Zhang, and M. Tehranipoor, “Experimental analysis of a ring oscillator network for hardware trojan detection in a 90nm ASIC,” Proceedings of the International Conference on Computer-Aided Design - ICCAD ’12, p. 37, 2012. [Online]. Available: http://dl.acm.org/citation.cfm?doid=2429384.2429392 [12] “Microblaze development kit spartan-3e 1600e
edi-tion user guide.” Federal Information Processing Stan-dards Publication 197, 2007. [Online]. Available: http://www.digilentinc.com/Data/Products/S3E1600/ug257.pdf [13] “Specification for the advanced encryption standard (aes),” Federal
Information Processing Standards Publication 197, 2001. [Online]. Available: http://csrc.nist.gov/publications/fips/fips197/fips-197.pdf