HAL Id: halshs-02544851
https://halshs.archives-ouvertes.fr/halshs-02544851
Submitted on 16 Apr 2020HAL is a multi-disciplinary open access archive for the deposit and dissemination of sci-entific research documents, whether they are pub-lished or not. The documents may come from teaching and research institutions in France or abroad, or from public or private research centers.
L’archive ouverte pluridisciplinaire HAL, est destinée au dépôt et à la diffusion de documents scientifiques de niveau recherche, publiés ou non, émanant des établissements d’enseignement et de recherche français ou étrangers, des laboratoires publics ou privés.
Geography vs. topology in the evolution of the global
container shipping network (1977-2016)
César Ducruet, Justin Berli, Mattia Bunel
To cite this version:
César Ducruet, Justin Berli, Mattia Bunel. Geography vs. topology in the evolution of the global con-tainer shipping network (1977-2016). Geographies of Maritime Transport, Edward Elgar Publishing, pp.49-70, 2020, �10.4337/9781788976640.00008�. �halshs-02544851�
Geography vs. topology in the evolution of the global container shipping
network (1977-2016)
Cesar Ducruet, CNRS-UMR 8504 Géographie-cités, Paris, France Justin Berli, CNRS-UMR 8504 Géographie-cités, Paris, France
Mattia Bunel, IGN-COGIT, Paris, France
Pre-final version of the chapter published in Wilmsmeier G. and Monios J. (Eds.) (2020),
Geographies of Maritime Transport, Edward Elgar Publishing, pp. 49-70.
Abstract
The dynamical properties of so-called spatial and complex networks are often overlooked in graph theory and network science in general. Container shipping provides a rare example of a global transport network that went through tremendous technological and geographic changes in the last decades or so. This chapter proposes for the first time an empirical analysis of no less than 40 years of inter-port vessel movement data (1977-2016) to describe the evolving properties of the global container shipping network. Main results confirm a number of stylized facts such as the growing size, connectivity, and centralization of this network due to several factors such as economies of scale in liner shipping and the rationalization of related maritime services, the emergence of hub ports, etc. We also provide a new cartography of how had the global container shipping network been geographically distributed over time, thereby highlighting major shifts in terms of port hierarchies and main corridors. We believe that this chapter will contribute to a better understanding of the complex linkages between network structure, technological change, and spatial change, opening the way for new research paths on maritime transport research and network science in general when focusing on evolutionary dynamics.
Keywords: complex networks; container shipping; GIS; graph theory; maritime transport; port hierarchy; shipping flows; vessel movements
Introduction
For decades, geographers and other scientists devoted a large portion of their efforts to a better understanding of the impacts of technological (but also managerial) changes on port and maritime activities. Their primary interest for spatial structures and dynamics led them to investigate such evolutions at the local scale through the provision of numerous monographs on ports and port cities (see a review over the period 1950-2012 by Ng and Ducruet, 2014 and Ng et al., 2014), where morphological and land-use issues were given paramount importance. In parallel, geographers also synthesized the observation of particular cases into more conceptual works, such as spatial models depicting the shift of modern port facilities from
upstream to deep-sea locations (Bird, 1963) and the dereliction of port-city relationships (Hoyle, 1989). They also addressed industry-specific changes with transport actors being at center stage in terms of vessel specialization (Mayer, 1973), port selection and competition (Slack, 1985), etc.
Given its huge importance in global trade (i.e. about 70% of world trade value according to UNCTAD, 2017), containerisation had been the main focus of numerous scholars in their study of industry (and related spatial) changes. It is now well-known that the “containerization revolution” even accelerated global trade (Berhofen et al., 2013), while deeply transforming the geography of transport systems of which ports and shipping networks (Rodrigue et al., 2013), following successive waves of technological progress (increasing ship size, port efficiency and terminal productivity, new port development, route rationalization) through huge economies of scale (Cullinane and Khanna, 2000), although such an evolution had been possible mainly due to managerial transformations such as port governance, liberalization, horizontal and vertical integration along the supply chain, and intermodalism (Notteboom and Winkelmans, 2001; Robinson, 2002; Notteboom and Rodrigue, 2005; Slack and Frémont, 2005; Frémont, 2009), to name but a few main aspects.
Such evolutions finally attracted the attention of the so-called “network science”, which was itself ongoing a revolution due to the shift, in the late 1990s, from classic graph theory to complex networks. Benefitting from advanced computational power, physicists pioneered the analysis of the global container shipping network in the late 2000s (Hu and Zhu, 2009; Deng et al., 2009; Kaluza et al., 2010), while (transport) geography still remained focused on land-based, planar networks such as road and railways (Ducruet and Lugo, 2013) and therefore, was relatively late in approaching maritime transport through the lenses of network theory despite earlier attempts (see Robinson, 1968; Joly, 1999) that remained unknown to the wider transport geography community. The main reason for this surge of interest for maritime networks in natural sciences was especially because this network shares similarities with airline networks, i.e. went through tremendous growth and concentration around large hubs, therefore becoming an interesting case for scientists eager to confront their network models (e.g. scale-free and small-world networks) to real-world systems through empirical studies. In the meantime, geographers showed their interest for the network dimension of the maritime and ports sector but understanding actors and places as their core concern, still using classic graph theory to map and analyse more local or regional scale networks of shipping alliances in the Caribbean and Mediterranean basin (McCalla et al., 2004) or of individual carriers, network design being a base upon which actors’ strategies were revealed across space (Rimmer and Comtois, 2005; Frémont, 2007).
Another important difference between physics and geography is the consideration or not of dynamics. Physics papers offered rather static views of the global maritime network, while geographers often compared, at least, two snapshots overtime to observe spatial and/or behavioural changes. It is only very recently that physics integrated dynamics in their global shipping network analyses, but still only based on a few snapshots or on simulation methods to investigate network vulnerability issues and the impacts of shocks on maritime connectivity (see Wang et al., 2016; Viljoen and Joubert, 2016). When integrating complex network
approaches in their works, maritime geographers nearly always adopted a temporal approach, from the comparison of at least two snapshots (Ducruet et al., 2010a; Gonzalez-Laxe et al., 2012; Freire-Seoane et al., 2013), until the global maritime network was, perhaps for the first time, studied across continuous time periods from 40 years (Ducruet, 2017) to 120 years (Ducruet et al., 2018) with different purposes such as investigating its multiplex properties or its urban determinants. Over shorter time periods but still temporally, other works shifted the study unit from port and port city to world regions (Li et al., 2015) and intercontinental corridors such as Europe-Asia (Tran and Haasis, 2014).
Despite all the aforementioned advances in global shipping network analysis from multiple perspectives, what remains lacking is a precise cartography of its geographic distribution and spatial evolution. This may appear surprising, given the surge of interest for recent or even instant visualizations of global shipping flow data in various academic works (Corbett et al., 2007) and on online portals such as Marinetraffic.com or Shipmap.org to tackle, among other issues, ship emissions, or climate change back in time (Garcia-Herrera et al., 2017). Geographers, whose interest was initially more to understand globalization, trade, and port dynamics were unsurprisingly pioneers in providing the first-ever cartographies of global maritime flows back in the 1940s (Siegfried, 1940; Ullman, 1949). What is more surprising is the total absence of subsequent cartographies, if we exclude the broadly sketched main trunk lines appearing in handbooks, atlases, and other publications.
The goal of this chapter is to further investigate the spatio-temporal evolution of the global maritime network with a particular on container shipping. Although existing works already proposed, for instance, mapping the whole maritime network composed of all types ships at the scale of intercontinental routes since the late 19th century (Ducruet et al., 2015), a more
precise view remains lacking, except from specific studies such as about the transition from sail to steam between 1890 and 1925 (Bunel et al., 2017), the global container shipping network and a zoom on Europe in 2015 (Ducruet and Bunel, 2017), and the evolution of the Maritime Silk Road since the late 1990s (Wang et al., 2018). Beyond cartography itself, which has the potential to boost our understanding of shipping and trade dynamics as a complement to earlier studies of the kind based on port throughput rather than inter-port traffic (Guerrero and Rodrigue, 2014), we also propose in this chapter to confront geography and topology in the analysis of the evolution of this global network. In other words, how have topological and spatial dimensions co-evolved, and what has been the role of various factors such as technological and operational change on this dynamic, bearing in mind the emergence of hub-and-spokes systems in the mid-1990s throughout the world container shipping network. The remainder of this chapter is as follows. We first run a topological analysis by applying conventional methods of network analysis, from both graph theory and complex networks, to annual matrices of inter-port container shipping flows over the period 1977-2016. Then, we explain the elaboration of a Geographical Information System (GIS) dedicated to mapping vessel movement data in the next section, for pedagogical but mainly analytical purposes, i.e. to reveal spatial shifts characterising the network. Lastly, we confront connectivity measures obtained from both network analysis and spatial analysis to verify how abstract (graph) and spatial (map) results diverge or converge overtime. This chapter can be seen as a contribution
to multiple fields such as geomatics, transport studies, maritime geography, and network science. We discuss in conclusion the outcomes and implications of this chapter for policy and further research.
2. Evolving topology of the global container shipping network
In this section, we investigate the changing topological properties of the global container shipping network (GCSN) with the main hypothesis that such properties drastically changed since the mid-1990s, when containerships started to dramatically increase in size, shipping lines evermore optimized their routes and schedules, fostering port competition and the emergence of hubs. This analysis treats 2,028 ports of the world, 118,620 inter-port linkages, and no less than 7.4 million daily vessel movements. This sample can be seen as very representative of the world fleet as Lloyd’s List Intelligence insures and tracks nearly 100% of existing containerships. This study, however, focuses only on fully cellular containerships, which might cause a bias in the early period as until nowadays and despite the growing containerization of world maritime trade, many other ship types used to carry containers such as general cargo, passenger or mixed bulk ships.
Two topological dimensions are considered as proposed by Hu and Zhu (2009), space-L and space-P. Space-L refers to a network where links correspond to successive moves between adjacent ports along ship trajectories overtime, such as A-B, B-C, C-D, etc. These trajectories may be the result of a variety of services from line-bundling to round-the-world, hub-and-spokes, and interlining (Ducruet and Notteboom, 2012) but vessel movement data does not provide such information. Space-P is different as it includes indirect linkages in addition to direct ones, i.e. between non-adjacent ports along ship trajectories, such as A-C, A-D, and B-D, as seen with Figure 1. Let us imagine a containership starting from A (e.g. Le Havre) and ending its pendulum service in Tokyo (D). Such a trajectory will never connect Europe and Asia in space-L but it will in space-P, so that not only topological but underlying geographic logics are fundamentally different from one dimension to the other. After creating 40 port-to-port matrices for each dimension and each year (1977-2016), we first present the size of the network (Figure 2) and its changing connectivity (Figure 3) based on four major indices: average clustering coefficient, average shortest path length, average eccentricity, and degree distribution.
[Insert Figure 1 about here]
The size of the global shipping network has, unsurprisingly, grown overtime, albeit with different numbers depending if the measures are applied to space-L or space-P (Figure 2). The latter always surpasses the former in absolute terms due to the inclusion of indirect linkages between ports. Beyond this expected difference in size, it is interesting to notice certain differences in the pattern and pace of each dimension’s evolution. In terms of the number of links and nodes and for total vessel traffic, space-L witnessed stable growth compared with
space-P, particularly since the early 2000s when the latter went through periods of stability separated by sudden peaks (2000 and 2010). Another important difference is the higher sensitivity of the space-L network to major shocks, as seen with the decrease of network size in 2009 (global financial crisis) and in 2013 (shipping industry turmoil), especially for nodes and total vessel traffic.
Based on the number of nodes and links, the gamma index expresses the proportion of actual links in the total maximum number of links if the network was fully connected. Here the divergence is total between the two dimensions L and P. Broadly speaking, the decrease of gamma for space-L indicates a rationalization of the network over time, despite some fluctuations, meaning that the network is increasingly sparse and centralized. This trend has waxed and waned since the year 2000, the global financial crisis causing a huge drop in 2008. Nevertheless, the 2016 value of the index is the lowest of the entire period. Conversely, the space-P network witnessed growing density (or completeness), and is on average much denser than the space-L network, also due to the inclusion of many more linkages. The year 2000 marks a rupture as for space-L but the subsequent evolution has waxed and waned in fully opposite ways, with a peak value in 2008 and a highest value in 2016. Although it is difficult in both cases to untangle trade effects and industry effects, we can conclude that space-L is a better revelatory of industry changes, with growing traffic concentration and network optimization in an age of increasing ship sizes up to nowadays mega-ships (see an analysis of the specific patterns of mega-ships in Ducruet and Berli, 2018). The increasing density of the space-P network better relates to growing trade, regional integration, and reinforced globalization through the multiplication of deep-sea, short-sea, and coastal shipping linkages. Therefore, the emergence of hubs is more evident in the space-L network, although the process of concentration and centralization started earlier than the mid-1990s according to Figure 2.
[Insert Figure 2 about here]
More advanced measures borrowed from complex network methods (see Ducruet and Lugo, 2013 for a review of transport network analysis in general) are then applied to the same two dimensions overtime (Figure 3). Although these four measures well summarize the deep structure of the network, they cannot account for the multiple factors influencing them. The global container shipping network is an assemblage of numerous and different flows having occurred for different reasons (e.g. trade vs. transhipment), animated by several actors from the local to the global. It is our task here to unravel possible causalities in its evolution from different angles. As a start, the average clustering coefficient on nodes (ports) expresses to what extent network topology is a tree-like structure, with no loops or triangles (values close to zero) or is closer to a complete graph (values close to one). In a sense, it is similar to the aforementioned density (or gamma index) but takes into account the presence or absence of links among every node’s neighbours. The space-L network went through tremendous increase of this coefficient up to the year 2000, which again marks a turning point, followed
by stagnation and slight decrease up to 2016. The space-P network is by nature more densely connected (above 0.73) but its evolution is much more fluctuating compared with space-L, despite a similar growth up to the mid-2000s followed by a rapid decline, going back to initial values in the last years of the study period. Such evolutions depict an improving connectivity as containerization spreads over the globe, but it has reached a peak in the 2000s so that transport chain actors enter a phase of rationalization, related with enhanced port competition to attract the largest ships. One may conclude that industry factors took over trade factors in the design of the network, which has become deployed by a narrower group of global shipping lines involved in large-scale alliances.
The same coefficient applied to links measures the extent to which those links act as bridges in the network (values close to zero) between densely connected clusters of ports, or if they are part of such clusters (values close to one). In both cases, space-L and space-P witnessed a regular increase all over the period, notwithstanding small fluctuations, but given its lower density, space-L is always more sparse than space-P. As in the case of nodes, space-L better reflects shipping industry logics with more importance given to the backbone of the network and its hubs. However, concentration and rationalization dynamics should have, intuitively, resulted in similar results than for the gamma index. The reason for this somewhat counter-intuitive result is that trade and geographic factors have become more and more important in explaining the structure of the network. Trade factors create multi-port configurations through regionalization processes (i.e. increase of intra-regional connectivity) that do not always need hubs to occur. Geographic factors, contrary to airline networks, avoid maritime networks in general to become too centralized, given the need to follow coastlines and therefore to multiply connexions within port ranges and maritime facades.
[Insert Figure 3 about here]
The average shortest path length (ASPL) measures the average number of stops between all pairs of ports connected by the shortest possible paths across the network. It is a measure of efficiency that can be translated as “navigability” in the case of shipping flows. In other words, the shorter the average path, the easier the network can be crossed through. Results show that both space-L and space-P underwent improved navigability, in accordance with the previous results. Yet, although space-L remains less efficient than space-P given its higher values, it underwent faster improvement, especially during the 2000s, but lost efficiency from 2009 to 2016. In comparison, space-P has been more fluctuating, and its overall trend may be improving, it only gained 0.12 points compared with 0.7 points for space-L, both having lost efficiency after 2009. Lastly, average eccentricity, which expresses how much nodes are topologically far (values close to one) or close (values close to zero) in the network, can be compared based on the same unit given the proximity of respective scores. While space-L is sparser and therefore always surpasses space-P (except from the year 1994), it does not show any particular trend. Space-P witnessed a slight and slow increase marked by important fluctuations.
The obvious limits of graph theory and complex networks is the ignorance of geography and spatial change when it comes to unravel dynamics in a real-world environment, despite recent advances in combining the two but mainly for planar, technical transport networks made of physical infrastructure, unlike shipping networks (Barthelemy, 2018).
3. Evolving geography of the global container shipping network 3.1 Methodological specifications: insights from geomatics
The visualization of worldwide maritime flows requires a structured network representing each potential paths a ship can take between ports of call along its journey. This spatial skeleton must take into account several geographical constraints such as physical barriers (i.e. continents), but also specific natural or anthropic features (e.g. canals, rivers, polar areas) to ensure that this abstraction is close to reality, thus avoiding any miscalculations. Furthermore, this maritime grid ought to be as light as possible; indeed, launching computation to analyse a set of ports or vessels in a given period may be time-consuming and resource-intensive. A first solution was developed using constant mesh throughout the world (Bunel et al., 2017) but it quickly turned out to be lacking accuracy and too dense. This method had to be discarded and a new approach had to be considered to create a light, robust and fairly accurate network. Starting from eight 90-degrees squares covering the world, an iterative process subdivides each of them into four equal-sized squares. Then, a condition is applied to carry on the division of every newly-created square if they overlap the sea-land interface, leaving undivided those fully overlapping a continent or an ocean. Following this methodology provides a clever way to obtain a denser meshing along the coastline and – using Natural Earth datasets (adapted to a 50 metres scale) – it seems that seven iterations provides the best ratio between complexity and accuracy. Finally, the meshing is composed of 23,000 squares extending from 6 x 10³ to 6 x 10⁶ km2 and gives a strong foundation on which the maritime
grid can be calculated. Using Moore neighbourhood, an algorithm identifying surrounding cells, shortest paths between each adjacent square’s centroid were calculated and the links created to obtain a worldwide maritime network (Bunel and Ducruet, 2017).
On the basis of that grid, some additional features were included in order to properly link every ports to the network. Still using Natural Earth physical datasets, specific entities (e.g. rivers, lakes) were added to ensure the connection of ports that doesn’t have a direct acces to the ocean. Linking ports to the maritime grid raised some issues, notably the crossing of continental areas – for instance in enclosed bays or gulfs – when attempting to connect them with the closest node. To avoid those inconsistencies, clusters of ports close to each other were calculated, their centroid was derived and connected to the grid, thus insuring the creation of coherent links between ports and the maritime network. Some adjustments were also mandatory to take into account specific case that we not handled during the iterative process. This is the case of particular morphological features such as closed seas (e.g. Black Sea), narrow straits (e.g. Gibraltar) or canals (e.g. Suez, Panama).
The final step was to assign weights to every arcs of the network. Those weights are based on the distance between their two extremities. The resulting maritime grid provides a fast way to obtain an approximation of the shortest sea route between two ports, or more generally between any pair of nodes in the network. Even though this maritime network contains some imperfections in terms of accuracy, it offers a consistent tool to produce flow maps and conduct centrality analysis using an origin-destination matrix.
3.2 The cartography of the global container shipping network
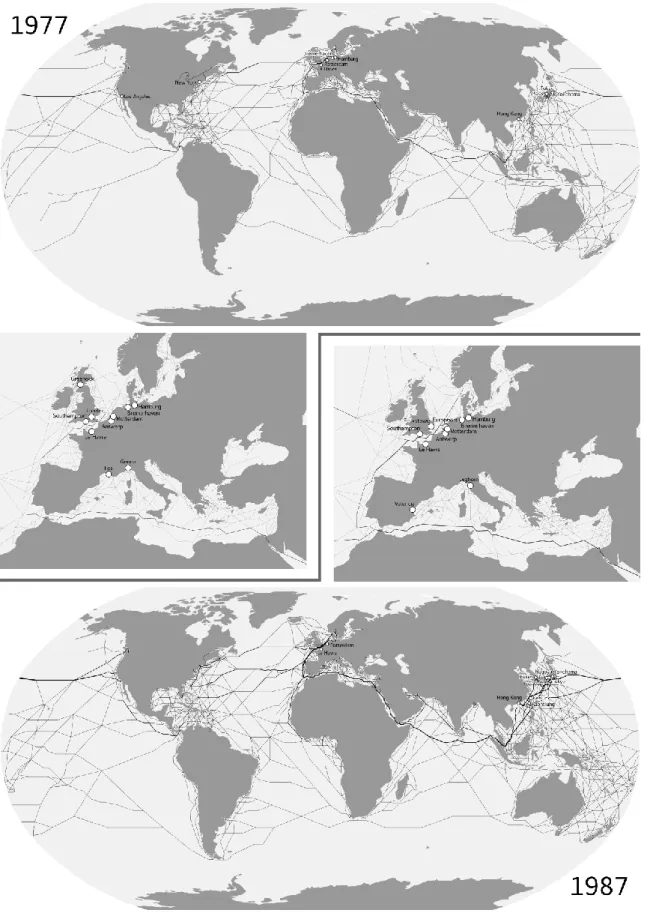
Our cartography was applied at 5 selected years from 1977 to 2016, i.e. every decade, to detect the principal traffic shifts across the global network. The worldwide matrix is based on space-P only, given the need to check how connected are far away ports and how are the major routes distributed around the globe.
As seen in Figure 4, the global container shipping network is in 1977 not yet a circumterrestrial trunk line connecting the main economic poles of the Northern Hemisphere, namely North America, Western Europe, and East Asia. It remains rather selective, putting Europe at the centre of the network, with the major route still being Atlantic, followed by the Europe-Asia and Japan-USA segments. The rest of the network is made of smaller flows with a high density in East Asia but still very sparse in the southern hemisphere except for Australia and New Zealand. In 1987, London is not anymore part of top European ports, which are more concentrated along the Le Havre-Hamburg range, despite a noticeable traffic increase through the Mediterranean but mostly for the sake of connecting Northern Europe with Asia. This range had become the prime focus of global shipping lines developing dedicated terminals through concession agreements with mainly Benelux ports (Frémont and Soppé, 2004). Atlantic flows have become secondary compared with Europe-Asia and Asia-USA, with the emergence of an East Asian maritime corridor and the multiplication of South-South flows despite in smaller quantities than elsewhere.
[Insert Figure 4 about here]
This evolution is reinforced in 1997, with the increasing role of the Panama Canal, the diversification of Asia-North America flows with a diversion towards Canada and notably Vancouver, and the emergence of strong players such as South Korea, Taiwan, and Malaysia backed by proactive national policies of free-zone and new port development (see Frémont and Ducruet, 2005). Latin America and Africa are much more connected with the rest of the network, but still mainly through North-South routes serving the main economic poles, especially Europe. Yet, the Caribbean had become an essential crossroads of inter-American and interoceanic transit and trade (McCalla et al., 2005). In Europe, main ports are still dominantly Nordic, with Felixstowe being mainly London’s gateway, while Spanish ports take over Italy, and it is too soon to observe the growth of Mediterranean transhipment ports that
started in the mid-1990s. Yet at the world level all top ports are already Asian, of which four in Japan, the rest in Asian Dragons, and one in Malaysia.
This is finally the case in 2007 when Gioia Tauro and Algeciras, the first-generation hubs of the Med, integrate Europe’s top ten ports, together with Spain and the same Nordic ports. A densification of the network is visible in the Med and the Black Sea as well as in the Baltic with St. Petersburg as the last main nodes of the Northern corridor. At the global level, the Europe-Asia trunk line now well connects South Europe-Asia and the Middle East that were previously bypassed. More flows run between Asia and Latin America, with South African ports as strategic nodes and the Cape of Good Hope as a growing alternative to the Suez Canal (Notteboom, 2012; Ducruet, 2016). Rotterdam reappears at the top of the global port hierarchy still dominated by Asian ports, but with a clear emergence of Chinese mainland ports such as Shanghai and Shenzhen, the factory of the world. Northeast Asian traffic shifted to China also due to the increase of intraregional trade and new supply chain strategies to profit from Chinese economic growth (Lee and Rodrigue, 2006). Traffic density tremendously increased in the Caribbean basin, partly due to the effect of trade agreements, port modernization, and shipping line strategies in the Atlantic in general (Guy, 2003; Ducruet et al., 2010b; Wilmsmeier et al., 2014), Brazil become a major partner (as the BRICS countries in general) not anymore polarized by Europe but equivalently connected with Asia from all directions.
Finally, in 2016, the pattern is reinforced in similar ways but changes occurred at the local or regional level, such as the full domination of the world’s top ten ports by Asia but this time with half of it being in mainland China, the emergence of Tangier-Med (Morocco) taking over the older generation hubs except Algeciras, but with a strong stability of the dominance of the Le Havre-Hamburg range in North Europe including Felixstowe. The latter, operated by the global, Hong Kong-based operator Hutchinson Whampoa (HPH) is being challenged by the investment by its competitor Dubai World Ports (DPW) within Greater London through the London Gateway project and the slogan “ship closer, save money”. In this era of mega-ships, less than a decade after the 2008-2009 global economic crisis, we observe a strong concentration of flows along the most lucrative routes, such as Europe-Asia, but also through the North Atlantic as the Panama Canal is not yet expanded and carriers changed their strategy from global network to optimal network, restraining their services at the most demanding segments. This had the effect of intensifying as well the intra-East Asian network not only as an effect of China’s booming economic growth and trade, but also based on intraregional trade.
4. Conclusion
This chapter served several concomitant objectives. First, it provided among the first flow maps of the evolution of global maritime container flows for both pedagogical and academic purposes, based on untapped vessel movement data and the development of a geomatics tool allowing such cartography. Further research shall lean towards dynamic visualization on a yearly or even monthly, weekly or daily basis to capture precise changes in network evolution,
taking inspiration from earlier works on the analysis of daily container flows in computer science (see Guinand and Pigné, 2015). Such visualizations have the potential to understand in more detail the formation of specific network structures, such as the concrete operation of a hub and its spokes, thereby allowing comparative perspectives on such systems across different basins and regions. Second, this chapter complemented existing research by the topological analysis of no less than 40 consecutive years of global container shipping flows, going beyond the usual static approach to these flows. Although graph theory and complex network methods allowed unravelling structural and conjectural changes in the network’s morphology as a whole, such as densification, rationalization, and concentration / de-concentration dynamics, such results remained relatively too broad and necessitated a geographic perspective to palliate their somewhat abstract character. Further research in the analysis of topological features in underway by modelling the global land-sea network, integrating at least the global road network to have a better overview of the global transport network as a whole. Containerisation is, by nature, intermodal and the analysis of the sole maritime network remains limited to one segment only of the whole supply / logistics chain. Last but not least, the global container shipping network, even combined with landward infrastructure networks, should be combined with the local socio-economic attributes of cities, regions and countries in order to detect the influence of such determinants on its topological and geographic distribution overtime, in complement to the sole economic and operational factors of this particular industry (Ducruet et al., 2017). As a conclusion, this chapter is one more brick in the wall of container shipping studies but has the broader ambition to contribute to network studies in general, and to specific research areas such as the analysis of local and global events such as shocks of all kinds affecting supply chains, from natural disasters to political or economic crises.
References
Barthelemy M. (2018) Morphogenesis of Spatial Networks. Springer International Publishing, 331 p.
Bernhofen D.M., El-Sahli Z., Kneller R. (2013) Estimating the effects of the container revolution
on world trade. Lund University Working Paper 2013:4, Department of Economics, School of
Economics and Management.
Bird J. (1963) The Major Seaports of the United Kingdom. London: Hutchinson.
Bunel M., Bahoken F., Ducruet C., Lagesse C., Marnot B., Mermet E., Petit S. (2017) Geovisualizing the sail-to-steam transition through vessel movement data. In: Ducruet C. (Ed.),
Advances in Shipping Data Analysis and Modeling. Tracking and Mapping Maritime Flows in the Age of Big Data, Routledge Studies in Transport Analysis, Routledge: London & New York,
pp. 189-205.
Bunel M., Ducruet C. (2017) GeoSeastems: an innovative tool to map global shipping flows. Application to the Mediterranean region. Portus, 33: http://portusonline.org/en/geoseastems-an-innovative-tool-to-map-global-shipping-flows-application-to-the-mediterranean-region/#
Corbett J.J., Wang C., Winebrake J.J., Green E. (2007) Allocation and forecasting of global ship
emissions. Working Paper, Clean Air Task Force, Boston MA, January 11.
Cullinane K.P.B., Khanna M. (2000) Economies of scale in large containerships: optimal size and geographical implications. Journal of Transport Geography, 8(3): 181-195.
Deng W.B., Long G., Wei L., Xu C. (2009) Worldwide marine transportation network: Efficiency and container throughput. Chinese Physics Letters, 26(11): 118901.
Ducruet C. (2016) The polarization of global container flows by interoceanic canals: Geographic coverage and network vulnerability. Maritime Policy and Management, 43(2): 242-260.
Ducruet C. (2017) Multilayer dynamics of complex spatial networks: The case of global maritime flows (1977-2008). Journal of Transport Geography, 60: 47-58.
Ducruet C., Berli J. (2018) Mapping the globe. The patterns of mega-ships. Port Technology
International, 77: 94-96.
Ducruet C., Bunel M. (2017) Le transport maritime et les ports. In: L’Océan à Découvert, Paris: CNRS Editions, pp. 136-137.
Ducruet C., Cuyala S., El Hosni A. (2018) Maritime networks as systems of cities: The long-term interdependencies between global shipping flows and urban development (1890-2010).
Journal of Transport Geography, 66: 340-355.
Ducruet C., Ferrari C., Itoh H., Tei A. (2017) The local determinants of interregional shipping flows. In: Ducruet, C. (Ed.), Advances in Shipping Data Analysis and Modeling. Tracking and
Mapping Maritime Flows in the Age of Big Data, Routledge Studies in Transport Analysis,
Routledge: London & New York, pp. 231-250.
Ducruet C., Haule S., Ait-Mohand K., Marnot B., Kosowska-Stamirowska Z., Didier L., Coche M.A. (2015) Maritime shifts in the contemporary world economy: Evidence from the Lloyd’s List corpus, 18-21 c. In: Ducruet C. (Ed.), Maritime Networks: Spatial Structures and Time
Dynamics, Routledge Studies in Transport Analysis, London & New York: Routledge, pp.
134-160.
Ducruet C., Lee S.W., Ng A.K.Y. (2010a) Centrality and vulnerability in liner shipping networks: Revisiting the Northeast Asian port hierarchy. Maritime Policy and Management, 37(1): 17-36.
Ducruet C., Lugo I. (2013) Structure and dynamics of transportation networks: Models, concepts, and applications. In: Rodrigue J.P., Notteboom T.E., Shaw J. (Eds.), The SAGE
Handbook of Transport Studies, SAGE Publications, pp. 347-364.
Ducruet C., Notteboom T.E. (2012) Developing liner service networks in container shipping. in: Song D.W., Panayides P. (Eds.), Maritime Logistics: A Complete Guide to Effective Shipping and
Ducruet C., Rozenblat C., Zaidi F. (2010b) Ports in multi-level maritime networks: Evidence from the Atlantic (1996-2006). Journal of Transport Geography, 18(4): 508-518.
Freire Seoane M.J., Gonzalez-Laxe F., Montes C.P. (2013) Foreland determination for containership and general cargo ports in Europe (2007–2011). Journal of Transport
Geography, 30: 56-67.
Frémont A. (2007) Global maritime networks: The case of Maersk. Journal of Transport
Geography, 15(6): 431-442.
Frémont A. (2009) Shipping lines and logistics. Transport Reviews, 29(4): 537-554.
Frémont A., Ducruet C. (2005) The emergence of a mega-port: The case of Busan, from the local to the global. Tijdschrift voor Economische en Sociale Geografie, 96(4): 421-432.
Frémont A., Soppé M., 2007. Northern European range: shipping line concentration and port hierarchy. In: Wang J.J., Notteboom T.E., Olivier D., Slack B. (Eds.), Ports, Cities, and Global
Supply Chains. Ashgate, Alderschot, pp. 105-120.
Garcia-Herrera R., Gallego D., Barriopedro D., Mellado J. (2017) Ship logbooks help to understand climate variability. In: Ducruet C. (Ed.), Advances in Shipping Data Analysis and
Modeling. Tracking and Mapping Maritime Flows in the Age of Big Data, Routledge Studies in
Transport Analysis, London & New York: Routledge, pp. 37-51.
Gonzalez-Laxe F., Freire Seoane M.J., Montes C.P. (2012) Maritime degree, centrality and vulnerability: port hierarchies and emerging areas in containerized transport (2008–2010).
Journal of Transport Geography, 24: 33-44.
Guerrero D., Rodrigue J.P. (2014) The waves of containerization: shifts in global maritime transportation. Journal of Transport Geography, 35: 151-164.
Guinand F., Pigné Y. (2015) Time considerations for the study of complex maritime networks. In: Ducruet C. (Ed.), Maritime Networks: Spatial Structures and Time Dynamics, Routledge Studies in Transport Analysis, London & New York: Routledge, pp. 163-189.
Hoyle B.S. (1989) The port-city interface: trends, problems, and examples. Geoforum, 20(4): 429-435.
Hu Y., Zhu D. (2009) Empirical analysis of the worldwide maritime transportation network.
Physica A, 388(10): 2061-2071.
Joly O. (1999) La Structuration des Réseaux de Circulation Maritime. PhD Dissertation in Territorial Planning, Le Havre: Le Havre University.
Kaluza P., Kölzsch A., Gastner M.T., Blasius B. (2010) The complex network of global cargo ship movements. Journal of the Royal Society Interface, 7(48): 1093-1103.
Lee J.Y., Rodrigue J.P. (2006) Trade reorientation and its effects on regional port systems: The Korea-China link along the Yellow Sea Rim. Growth and Change, 37(4): 597-619.
Li Z., Xu M., Shi Y. (2015) Centrality in global shipping network basing on worldwide shipping areas. Geojournal, 80(1): 47-60.
Mayer H.M. (1973) Some geographic aspects of technological change in maritime transportation. Economic Geography, 49(2): 145-155.
McCalla R.J., Slack B., Comtois C. (2004) The geographical hierarchy of container shipping networks in the Caribbean basin and Mediterranean sea. Paper presented at the 10th World Conference on Transport Research (WCTR), Istanbul, July 4-8.
McCalla R.J., Slack B., Comtois C. (2005) The Caribbean basin: Adjusting to global trends in containerization. Maritime Policy and Management, 32(3): 245-261.
Ng A.K.Y., Ducruet C. (2014) The changing tides of port geography (1950-2012). Progress in
Human Geography, 38(6): 785-823.
Ng A.K.Y., Ducruet C., Jacobs W., Monios J., Notteboom T.E., Rodrigue J.P., Slack B., Tam K.C., Wilmsmeier G. (2014) Port geography at the crossroads with human geography: between flows and spaces. Journal of Transport Geography, 41: 84-96.
Notteboom T.E. (2012) Towards a new intermediate hub region in container shipping? Relay and interlining via the Cape route vs. the Suez route. Journal of Transport Geography, 22: 164-178.
Notteboom T.E., Rodrigue J.P. (2005) Port regionalization: Towards a new phase in port development. Maritime Policy and Management, 32(3): 297-313.
Notteboom T.E., Winkelmans W. (2001) Structural changes in logistics: how will port authorities face the challenge? Maritime Policy and Management, 28(1): 71-89.
Rimmer P.J., Comtois C. (2005) China's extra- and intra-Asian liner shipping connections, 1990-2000. Journal of International Logistics and Trade, 3: 75-97.
Robinson R. (1968) Spatial Structuring of Port-Linked Flows: The Port of Vancouver, Canada,
1965. PhD Dissertation in Geography, University of British Columbia.
Robinson R. (2002) Ports as elements in value-driven chain systems: the new paradigm.
Maritime Policy and Management, 29(3): 241-255.
Rodrigue J.P., Comtois C., Slack B. (2013) The Geography of Transport Systems. New York: Routledge.
Siegfried A. (1940) Suez, Panama et les Routes Maritimes Mondiales. Paris: Armand Colin. Slack B. (1985) Containerisation, inter-port competition and port selection. Maritime Policy
and Management, 12(4): 293-303.
Slack B., Frémont A. (2005) Transformation of port terminal operations: From the local to the global. Transport Reviews, 25(1): 117-130.
Tran N.K., Haasis H.D. (2014) Empirical analysis of the container liner shipping network on the East-West corridor (1995–2011). Netnomics, 15(3): 121-153.
Ullman E.L. (1949) Mapping the world's ocean trade: A research proposal. The Professional
Geographer, 1(2): 19-22.
Viljoen N.M., Joubert J.W. (2016) The vulnerability of the global container shipping network to targeted link disruption. Physica A, 462: 396-409.
Wang L., Zhu Y., Ducruet C., Bunel M., Lau Y.Y. (2018) From hierarchy to networking: The evolution of the ’21st century Maritime Silk Road’ container shipping system. Transport
Reviews, DOI:10.1080/01441647.2018.1441923
Wang N., Wu N., Dong L.L., Yan H.K., Wu D. (2016) A study of the temporal robustness of the growing global container-shipping network. Nature Scientific Reports, 6(34217): doi:10.1038/srep34217
Wilmsmeier G., Monios J., Pérez-Salas G. (2014) Port system evolution–the case of Latin America and the Caribbean. Journal of Transport Geography, 39: 208-221.
Figure 1: Topological dimensions of the shipping network Source: own elaboration based on Hu and Zhu (2009)
Figure 2: Size of the global container shipping network, 1977-2016 Source: own elaboration based on Lloyd’s List data
Figure 3: Connectivity of the global container shipping network, 1977-2016
Figure 4: Spatial pattern of the global container shipping network, selected years, 1977-2016 Source: own elaboration based on LLI data