HAL Id: hal-01400219
https://hal.archives-ouvertes.fr/hal-01400219
Submitted on 21 Nov 2016
HAL is a multi-disciplinary open access
archive for the deposit and dissemination of
sci-entific research documents, whether they are
pub-lished or not. The documents may come from
teaching and research institutions in France or
abroad, or from public or private research centers.
L’archive ouverte pluridisciplinaire HAL, est
destinée au dépôt et à la diffusion de documents
scientifiques de niveau recherche, publiés ou non,
émanant des établissements d’enseignement et de
recherche français ou étrangers, des laboratoires
publics ou privés.
Effect of nonlinear wave collapse on line shapes in a
plasma
Ibtissem Hannachi, R Stamm, J Rosato, Y Marandet
To cite this version:
Ibtissem Hannachi, R Stamm, J Rosato, Y Marandet. Effect of nonlinear wave collapse on line shapes
in a plasma. EPL - Europhysics Letters, European Physical Society/EDP Sciences/Società Italiana di
Fisica/IOP Publishing, 2016, 114, pp.23002 - 23002. �10.1209/0295-5075/114/23002�. �hal-01400219�
(a)
E-mail: [email protected]
Pages provided by publisher
Effect of nonlinear wave collapse on line shapes in a plasma
I.HANNACHI1,2,R.STAMM1(a),J.ROSATO1 AND Y.MARANDET11
Physique des Interactions Ioniques et Moléculaires, UMR 7345, AMU-CNRS, Marseille, France
2
PRIMALAB, Sciences of matter faculty, University of Batna 1, Batna, Algeria
received and accepted dates provided by the publisher other relevant dates provided by the publisher PACS 32.70.Jz – Line shapes, widths, and shifts
PACS 52.35.Mw – Nonlinear phenomena : waves, wave propagation, and other interactions
Abstract – The nonlinear interaction of waves can change the structural and radiative properties of
plasmas. We describe the main features of a fully ionized unmagnetized plasma affected by strong Langmuir turbulence characterized by nonlinear wave collapse, and propose a simple model for evaluating the changes expected on a hydrogen line shape affected by such conditions. Our model is based on a stochastic renewal model using an exponential waiting time distribution and a half-normal probability density function for the electric field magnitude of the turbulent wave packet. The first results obtained with a simulation calculation of the hydrogen L line show that strong Langmuir turbulence can provide an additional broadening to a Stark profile.
Introduction. –The influence of collective electric fields on a line shape emitted in a plasma has been studied for several decades in different types of plasmas [1,2,3]. Most of the collective fields considered were described by linear waves,
e.g. the electronic Langmuir plane wave oscillating at the
plasma frequency. The observed spectroscopic effects were the formation of satellites or dips, and changes in the overall shape of the line. In this work, we consider in an unmag-netized plasma the nonlinear coupling of Langmuir waves with ion sound and electromagnetic waves. In such conditions, the density fluctuations associated with ion sound waves affect the Langmuir waves, refracting them in regions of low densi-ty. Coherent plasma wave packets localize in such regions, and evolve to shorter scales and higher intensities[4]. Compu-ter simulations reveal the existence of a wave packet cycle with a collapse arrested by dissipation, and of a nucleation mechanism allowing the creation of a new wave packet. If energy is supplied from an external source, localized wave packets may be created at a high rate, and the plasma will contain many of those coexisting wave packets. We consider in the following the effect of the presence of such collapsing wave packets on the line radiation emitted by an atom in the plasma. Interesting applications for this study concern plasmas in interaction with an energetic beam of particles. For example in astrophysical contexts, active galactic nuclei[5], or pulsar radio sources[6]. Relevant laboratory plasmas are laser plas-mas [7], radio experiments [8], or possibly also magnetic fusion plasmas, since such plasmas can be affected by energe-tic beams of runaway electrons [9].The paper is organized as follows. In the next section, we make a short review of the
main characteristics of strong Langmuir turbulence and present the wave packet cycle. The third section presents a stochastic model adapted for line broadening calculations in such conditions, and the last section is a discussion of the first calculations on the hydrogen Lline (transition from n=2 to
n=1, where n is the principal quantum number).
Strong Langmuir turbulence and the wave packet cycle. –
We consider electron, ion and electromagnetic waves in a fully ionized unmagnetized plasma submitted to an external source of energy, such as a beam of energetic charged particles. This source of external energy may be coupled to the plasma waves, thus increasing their intensity, and allowing the start of nonlinear processes such as wave-wave interactions [10]. Langmuir waves then couple with ion sound and electromagnetic waves and we enter in the domain of strong Langmuir turbulence and nonlinear wave collapse. A nonlinear plasma has a refractive index that depends on the intensity of waves present. The reason for this is found if we consider the nonlinear ponderomotive force per unit volume:
𝐹⃗𝑁𝐿= −
𝜔𝑝2
𝜔2∇⃗⃗⃗
〈ε0E2〉
2 , (1) where E is the magnitude of the electric field of the wave oscillating at frequency , and brackets denote a time average. The electronic plasma frequency is defined by 𝜔𝑝= √𝑁𝑒𝑒2/𝑚𝜀0, with Ne the electronic density, m and e the
electron mass and charge, and 𝜀0 the permittivity of free space. This force acts in a direction opposed to the gradient of
I. Hannachi et al.
the field. Due to this action, a coherent and intense Langmuir wave packet moves a part of the plasma out of the region of maximum field value. At the location of the wave packet, one observes a plasma density depression, and an increase of the refractive index. A localized wave packet refracts in these regions of low density, further increasing its intensity, and thus expelling even more plasma. The nonlinear dynamics for this process is well described by the Zhakarov equations [11]. The first Zhakarov equation describes how density fluctuations modify and amplify Langmuir wave packets, and the second one takes account of the effect of intense waves on the density fluctuations. The study of these equations, together with numerical simulations, has revealed the complex dynamics of wave packets in cases where the ratio W of the wave energy density to the plasma energy density is not small. This ratio W is given by:
𝑊 = 𝜀0𝐸𝐿
2
4𝑁𝑒𝑘𝐵𝑇𝑒 , (2)
where EL is the magnitude of the turbulent Langmuir field, kB
the Boltzmann constant, and Te the electron temperature.
Strong turbulence conditions have been found above a threshold for W depending on the plasma conditions. Zhakarov equations in one-dimension reduce to the nonlinear Schrödinger equation in the adiabatic limit, for which density fluctuations are changing slowly. This equation has been useful for understanding the qualitative features of turbulent wave packets. The same equation has been used in hydrody-namics and optics for analysing the behavior of rogue waves [12]. Stable soliton solutions have been found in plasmas, with a localized and oscillating electric field modulated by a Gaussian or Lorentzian envelope [13]. We will use in the following such a modulated wave packet as a basic piece for building our model for a line shape emitted in a plasma sub-mitted to strong Langmuir turbulence.
Using more realistic 2D and 3D computer simulations, solitons lose their stability, and the medium exhibits numerous localized wave packets, each one undergoing a whole cycle with an average duration which scales as the inverse of the average of W [4]. Best fits to 3D numerical simulations predict a characteristic time T between collapses such as [14,15]:
𝑇 ≈ 40 〈𝑊〉−1𝜔
𝑝−1, (3)
where the brakets denote an average value of W. For the following calculations, we consider, as observed in experiments [4], that W can reach values of the order of one, and we will use a characteristic time between collapses in the range 30-50 times the inverse electronic plasma frequency. The cycle starts most frequently by a nucleation mechanism due to the presence of wave packets trapped as standing waves in density depressions with a high refractive index. If the wave packet accumulates enough energy from the background turbulence or from the external source of energy, the intensity of the wave increases and spatially narrows. This phase is the wave collapse, during which the amplitude of the wave electric field can reach values several hundred times larger than the background plasma microfield, according to
eq. (2) written for values of W of the order of one. The arrest of wave collapse follows, and is mainly due to transit-time damping [14]. Finally, the wave energy is rapidly dissipated, and a renucleation takes place, allowing the start a new wave packet cycle. In strong turbulence conditions, many localized wave packets coexist, together with propagating waves. It is possible by coupling these two components to estimate the number density of collapse sites. The mean interpacket separation has been found to be about 2 to 3 times of the packet length scale at the start of collapse (close packing assumption) [4].
A model for the effects of wave collapse on a radiating emitter. –
We propose a simple statistical model to investigate the effect of multiple collapsing wave packets on a line shape emitted by an atom in a strongly turbulent plasma. We assume that the measurement time of the spectrometer is much larger than the characteristic times of Langmuir wave oscillations and collapse. We will also consider that the line formation depth is large compared to the spatial scale of the collapsing wave packets, a condition which is similar to what is assumed in the micro-turbulent case in astrophysics [16]. Observed along a line of sight in optically thin conditions, many atoms contribute, and the spectral line appears as an average over the statistical properties of the turbulent Langmuir field. We propose to use a stochastic renewal process for modeling the effects of such a turbulent field. The Langmuir electric field applied on a single emitter is a sequence of oscillating fields with a phase j and duration j, each field 𝐸⃗⃗𝑗 having a different
direction and magnitude:
𝐸⃗⃗(𝑡) = { 𝐸⃗⃗1𝑐𝑜𝑠(𝜔𝑝𝑡 + 𝜑1) 𝑆1(𝑡), 𝐸⃗⃗2𝑐𝑜𝑠(𝜔𝑝𝑡 + 𝜑2) 𝑆2(𝑡), ⋮ 𝐸⃗⃗j𝑐𝑜𝑠(𝜔𝑝𝑡 + 𝜑j) 𝑆𝑗(𝑡), ⋮ 0 ≤ 𝑡 ≤ 𝑡1 𝑡1≤ 𝑡 ≤ 𝑡2 ⋮ 𝑡𝑗−1≤ 𝑡 ≤ 𝑡𝑗 ⋮ (4)
The function Sj modulates the amplitude of the field during
the time interval j, with an adjustable time width of the
enve-lope function. In the following, we modulate each plane wave with a Lorentzian shaped envelope Sj centered in the time
interval j, and with a peak value equal to 1. The time width at
half maximum TL of the envelope can be changed in the time
interval j. If the ratio TL/j is large, we recover the plane
wave model used in the linear regime. We study in the next section the effect of the shape of the envelope. Numerical simulations of wave packet collapse are a guide for choosing this shape in different plasma conditions [
4
]. With this model of modulated wave packet, we try to reproduce at the emitter’s location the effect of a wave packet cycle, from the time of nucleation at the beginning of the time interval, to the final dissipation time, going through the maximum field magnitude value supposed to be attained at the middle of the time inter-val. The sequence of wave packets represented by eq. (4) is a modeling of the emitter’s perturbation by successive wave packet cycles. We assume that each emitter is always per-turbed by a nearby wave packet which is renewed at the end of each cycle, using the fact that the wave packets are closepacked [
4
]. The renewal process requires a waiting time distribution (WTD) for sampling the wave packet durations j.We have used a simple exponential law exp(-t), with the jumping frequency chosen as the inverse of the characteristic time T between wave packet collapses. For each change of the field, the phase and direction are randomly distributed, and we need to prescribe a probability density function (PDF) for the magnitude value |𝐸⃗⃗⃗⃗|of the turbulent Langmuir field. PDFs of 𝑗
electric field strengths have been studied and measured in the case of electron-beam experiments. For ratios W of the order of one, a Gaussian distribution of the electric field strengths has been measured [17], and is also predicted theoretically for the highest fields [15]. In the following, we have used a half-normal distribution for the reduced electric field magnitude
F=E/E0, with the Holtsmark microfield E0 defined by
E0=e/(40r02), where the average interparticle distance r0 is
given by (4/3)r03Ne=1. The PDF P(F) can be written in
function of the standard deviation of F: 𝑃(𝐹) = √2
𝜎√𝜋exp (− 𝐹2
2𝜎2) . (5)
For this PDF, the standard deviation is related to the average magnitude 𝐸𝐿of the turbulent Langmuir field by the
relation 𝜎 = √𝜋/2 𝐸𝐿/𝐸0. We have also made some
calculations using a log-normal PDF with the same average field, without changing significantly the results described in the results section. Log-normal PDF have been measured e.g. for the fluctuation of density in tokamak plasmas [18,19].
Fig. 1: Piece of history of one electric field component obtai-ned by our model for a Lorentzian envelope function with a time width taken to 20 % of each time interval between two successive jumps (time in units of the inverse plasma fre-quency).
Figure 1 presents, in units of the inverse plasma frequency, a piece of the history of one electric field component obtained by our model. The electric field with magnitude Ej has been
generated along a half-normal PDF with an average value EL
equal to hundred times the Holtsmark field, and the component plotted is modulated by a Lorentzian envelope
with a time width taken as 20 % of each time interval j. For a
temperature of 2.8x10⁴ K, and a density of 1018 m-3, the jumping frequency has been taken equal to p/50. In
accordance with eq. (4) and the WTD, the electric field vector and phase are renewed for each new time interval. The fast oscillation seen on fig. 1 is at the plasma frequency, and the number of oscillations in each wave packet is sampled by the WTD.
Our model uses such electric field histories to obtain the dipole autocorrelation function (DAF) and the line shape of an emitting atom. Using a dipolar approximation, the time dependent interaction potential between the atom and an electric field 𝐸⃗⃗ is written as 𝑉(𝑡) =– 𝐷⃗⃗⃗. 𝐸⃗⃗(𝑡), where 𝐷⃗⃗⃗ is the atomic dipole operator. The atomic DAF C(t) is given by [20]: 𝐶(𝑡) = 𝑇𝑟〈𝐷⃗⃗⃗ 𝑈+(𝑡)𝐷⃗⃗⃗𝑈(𝑡)𝜌〉, (6)
where the trace is over the atomic states, U(t) is the atomic evolution operator, the density matrix, and the angle brackets imply an average over all the realizations of the turbulent Langmuir field. The evolution operator is obtained by solving the Schrödinger equation for a Hamiltonian H0
+V(t), with H0 the unperturbed atomic Hamiltonian. It is
actually more convenient to use a time evolution operator 𝑈̅(𝑡) in the interaction representation, using the relation 𝑈̅(𝑡) = exp(𝑖𝐻0⁄ ) 𝑈(𝑡). This operator obeys the ℏ
Schrödinger equation: 𝑖ℏ𝑑𝑈̅(𝑡)
𝑑𝑡 = 𝑉′(𝑡)𝑈̅(𝑡), (7) where V’(t) is the interaction representation of V(t). Using the electric field history given by eq. (4) we have solved numerically eq. (7) using an implicit scheme algorithm with a good compromise between accuracy and computing time [21]:
𝑈̅(𝑡 + 𝑑𝑡) = [1 − 𝑑𝑡𝑉′(𝑡 + 𝑑𝑡) 2𝑖ℏ ]
−1
[1 + 𝑑𝑡𝑉′(𝑡)
2𝑖ℏ] 𝑈̅(𝑡). (8) The DAF is obtained after an average over a large number (104) of independent electric field histories. A discussion of this time dependent function provides specific information on the dynamics of the perturbation [22]. The sampling of the stochastic variables is done on the computer with pseudorandom number algorithms, associated to numerical techniques such as transformation or rejection methods [23]. This simulation of the stochastic process is flexible, and well suited to the study of strong Langmuir turbulence. Such computer simulations have been used for more than 3 decades for obtaining accurate line shape calculations, but up to now mostly in equilibrium plasmas conditions [24,25,26].
The calculations presented in the following concern only the hydrogen L line, neglecting fine structure in order to obtain a fast numerical evaluation. Using the spherical quantum numbers n,l,m, the subspace for principal quantum number n contains 4 states, and the matrix representation of the quantum operators are 4x4 matrices.
I. Hannachi et al.
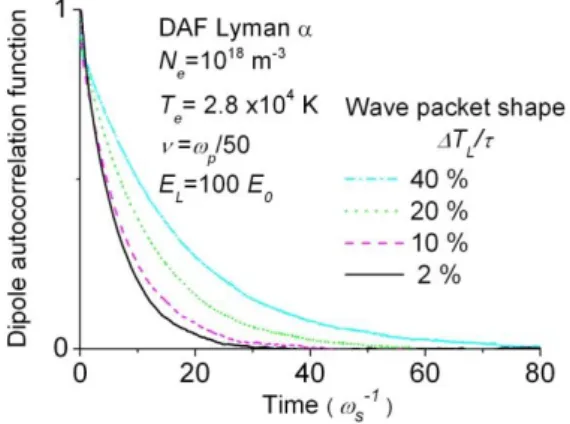
Fig. 2: (Color on-line) Dipole autocorrelation functions (DAF) for L submitted to strong Langmuir turbulence calculated for a jumping frequency =p/50, and an average field EL=100
E0, in a plasma with a density Ne= 1018 m-3 and temperature
Te= 2.8x10⁴ K. We have plotted the DAF for four different
shapes of the envelope (Time in S-1units)
Fig. 3: (Color on-line) Same as fig. 2 for narrower shapes of the Lorentzian envelope.
Results. –
Most of the calculations of hydrogen L DAF and line shape have been performed for a plasma temperature Te= 2.8x10
4
K, and a density Ne= 1018 m-3. For such conditions the plasma
exhibits most properties of a fully ionized plasma, and still contains numerous neutral atoms emitting hydrogen lines. Although being mainly studied for high density plasmas, detailed Stark line shapes are also needed for low density plasmas, since they enter in the modeling of radiative transfer together with Doppler broadening [27]. The numerical integration of the Schrödinger equation has been performed using a time step equal to 10-3 times the inverse of the average Stark shift S. This frequency is defined by S=DE0/ħ, where
D=3ea0 for the substates n=2, and a0 is the Bohr radius. We
present in figs. 2-5 the DAF for L subject to the single effect of the field defined by eq. (4), and calculated for a jumping frequency =p/50, and an average field EL=100 E0. These
values have been chosen using eqs. (2-3), and correspond to an average value of W equal to 0.8.
Fig. 4: (Color on-line) Same as fig. 2 for short times and three shapes of the Lorentzian envelope.
Fig. 5: (Color on-line) Same as fig. 3 for short times and three shapes of the Lorentzian envelope.
We have plotted in figs. 2-3 four different DAF corresponding to different envelope shapes, which are governed by the ratio, expressed in percentages, of the Lorentzian time width L to
the time interval between two successive steps. In fig. 2 the DAF with the strongest damping, corresponding to the broadest line shape, is obtained for plane waves (solid line), which is the case of infinite value for the ratio L/. For
values of this ratio larger than or of the order of 200 %, we observe that the decay of the DAF is similar to what is observed for plane waves. For ratios varying from 100 % (dashed line), to 70% (dotted line), and to 40 % (dash-dotted line), the decay is regularly reduced by a factor 2.5, if we examine the DAF at the exponential decay time. For values of the ratio between 50 % and 40 %, the decay is almost unchanged, announcing a change of behavior. For the same conditions, but different shapes of the wave packet, we have plotted in fig. 3 the DAF for four decreasing values of the ratio L/. As this ratio is decreased, from 40 % (dash-dotted
line) to 20 % (dotted line), and 10 % (dashed line), the decay is now increased, contrary to what is observed in fig. 2. For values of the ratio smaller than 5 %, corresponding to an
envelope of the electric field appearing as a well isolated wave packet in each step of the renewal process, the DAF converges to a limit close to the DAF calculated for a ratio of 2 % (solid line). In this limit each wave packet contributes in an additive manner to the decay of DAF (impact limit for the field with the chosen PDF and WTD).
The response of the DAF to the plasma frequency oscillation is visible in fig. 4, which shows its short time behavior. The oscillations seen are in phase with the plasma frequency, and have a maximum amplitude and duration for the plane wave case (solid line). For a ratio L/ equal to 100 % (dotted line)
and 40 % (dashed line), one observes a regular decrease of the amplitude and duration of the oscillation as the width of the Lorentzian envelope is reduced. In fig. 5, it can be seen that the oscillations are reduced for a ratio of 20 % (dashed line), and that for smaller ratios the DAF converge to its limit plot-ted here for a ratio of 2 % (solid line). For the wave packet shapes presented in Figs. 3 and 5, the DAF obtained with the narrowest Lorentzian envelopes are the least damped for early times, and the most damped for late times. This is consistent with a broadening by separated wave packets as for impact broadening. Several studies on the shape of a collapsing wave have been performed using Zhakarov equations or numerical simulations [4,28,29], suggesting that the wave packets are well separated in time during the wave packet cycle. Using the results of three dimensional collapsing wave packets, calcu-lated numerically using the nonlinear Schrödinger equation [29], we have chosen a ratio L/ equal to 20 % in our line
shape calculations. In accordance with our study presented in figs. 2-5, this value minimizes the damping effect on the DAF, and thus also the broadening effect of Langmuir turbulence on the line shape.
The line shape is obtained by a numerical Fourier transform, and is first calculated for the single effect of strong Langmuir turbulence. This pure Langmuir line shape may also be con-volved with an equilibrium Stark broadening line shape, leading to a full profile which would be emitted in a plasma containing a large number of collapsing wave packets [14]. Our model assumes that the two broadening mechanisms are independent, and that it is possible to neglect the effect of density fluctuations on the Stark profile. Such turbulent fluc-tuations are known to affect Stark profile in inhomogeneous plasmas submitted to unstable drift waves [16
,
30].For the same plasma conditions already studied, and the same jumping frequency =p/50, and field EL=100 E0,we
present in fig. 6 three different L line profiles. We have plotted the profiles using alpha units defined by the reduced wavelength =/E0, expressed in angström per cgs field
strength units as in standard line shape tables [20,31]. The width of the line which is only affected by strong Langmuir turbulence (dotted line) is only 25 % narrower than the Stark profile. Compared to the latter, the width of the full profile (solid line) obtained by the convolution is almost 80 % wider. In fig. 7 we apply our model to a denser plasma with Ne= 1020
m-3, keeping a temperature Te= 2.8x10⁴ K. Using eqs. (2-3),
we have calculated line profiles for a jumping frequency
=p/30, andan average peak field EL=60 E0, corresponding
to W=1.34. The width of the line which is only affected by strong Langmuir turbulence (dotted line) is 4 times narrower than the Stark profile calculated by an ab initio simulation (dashed line).
Fig. 6: (Color on-line) Profile of the L line for a density of 1018 m-3, and a temperature of 2.8x10⁴ K. The pure Stark
profile (dashed line) is compared to the pure Langmuir profile (dotted line) with EL=100 E0 and a jumping frequency
=p/50, and to a full profile obtained by convolution of the
two previous (solid line).
Fig. 7: (Color on-line) Same as fig. 6 for a density of 1020 m-3,
EL=60 E0 and =p/30.
The effect of strong turbulence is thus much reduced for this density, but still significant since the full profile (solid line) is 34 % broader than the Stark profile. We have performed other line shape calculations for temperatures between 104 and 105
K, and densities varying from 1017 to 1021 m-3. The effect of strong Langmuir turbulence is always significant as compared to equilibrium Stark broadening on this line.
Conclusion. –
We have reviewed the main characteristics of the physical aspects of wave collapse and strong Langmuir turbulence which may affect the spectra of atomic emission in a plasma. In such conditions, many localized wave packets coexist if the plasma is coupled to an external source, and their cyclic dy-namics includes a wave collapse during which the electric field reaches values well above the equilibrium plasma micro-field. We have proposed a stochastic renewal process for modeling the history of an electric field experienced by an atom in conditions of strong Langmuir turbulence. The model requires the PDF for the turbulent electric field and a WTD
I. Hannachi et al.
for sampling the times of jumping from one field to the follo-wing. An exponential law is used for the WTD, with a jum-ping frequency taken as the inverse of the mean duration for the wave collapse cycle, and the wave packet field magnitudes are sampled along a half-normal PDF. The DAF of the hydro-gen line L has been calculated with a numerical simulation for different shapes of the wave packet, revealing different behaviors as the width of the envelope is changed. We have performed DAF and line profile calculations for a temporal widthof the wave packet equal to 20 % of the step duration. This shape suggested by simulations of the wave packet colla-pse [4], is also among those minimizing the broadening effect on the line shape. The main conclusion of the paper is that for plasmas at about 2 eV, the Stark width of the L line is increa-sed in presence of strong turbulence, and this for densities between 1018 and 1021 m-3. The width of the line is dependent on the parameters of strong Langmuir turbulence like the value of W, and the plasma conditions. A future direction for this work is the investigation of other plasma conditions, and the calculation of lines which are better suited for a plasma diagnostic, such as the hydrogen Balmer lines.
Acknowledgments
This work is supported by the Agence Nationale de la Recher-che, project SEDIBA, ANR-11-BS09-023.
REFERENCES
[1] BARANGER M., MOZER B., Phys. Rev,. 123 (1961) 25.
[2] OKS E., SHOLIN G., Zh. Eksp. Teor. Fiz,. 68 (1975) 974.
[3] BAKSHI P., KALMAN G., Solar Physics, 47 (1976) 307.
[4] ROBINSON P. A., Rev. Mod. Phys., 69 (1997) 507. [5] MILLER H., WIITA P., Active Galactic Nuclei
(Spring-er, Berlin) 1987.
[6] ASSEO E., PORZIO A., Mon. Not. R. Astron. Soc., 369 (2006) 1469.
[7] KRUER W. L., The Physics of Laser-Plasma
Interac-tions (Addison-Wesley, Redwood City) 1988.
[8] BAUER B., WONG A., SCURRY L., DECYK V., Phys.
Fluids, 2 (1990) 1941.
[9] PAZ-SOLDAN C. et al., Phys. Plasmas, 21 (2014) 022514.
[10] BELLAN P. M., Fundamental of Plasma Physics (Cambridge University Press, Cambridge) 2006. [11] ZAKHAROV V. E., Zh. Eksp. Teor. Fiz, 62 (1972)
1745.
[12] SOLLI D., ROPERS C., KOONATH P., JALALI B.,
Nature, 450 (2007) 1054.
[13] KUZNETSOV E. A., RUBENCHIK A. M., ZAKHAROV V. E., Phys. Rep., 142 (1986) 103. [14] ROBINSON P. A., NEWMAN D. L., Phys. Fluids B, 2
(1990) 2999.
[15] ROBINSON P. A., NEWMAN D. L., Phys. Fluids B, 2 (1990) 3120.
[16] MARANDET Y., ROSATO J., CAPES H., GOD-BERT-MOURET L., KOUBITI M., MEKKAOUI A.,
ROSMEJ F., STAMM R., High Energy Density Phys., 5 (2009) 312.
[17] LEVRON D., BENFORD G., TZACH D., Phys. Rev.
Lett., 58 (1987) 1336.
[18] SATTIN F. et al., Phys. Plasmas, 11, 5032 (2004). [19] ROSATO J., CAPES H., MARANDET Y., ROSMEJ
F. B., STAMM R., GODBERT-MOURET L., KOUBI-TI M., EPL, 84 (2008) 43002.
[20] GRIEM H., Spectral Line broadening by Plasmas (McGraw-Hill, New York) 1964.
[21] KOONIN S., Computational Physics (Addison Wesley, Redwood City) 1986.
[22] ALEXIOU S., J. Quant. Spectr. Rad. Transfer, 71 (2001) 139.
[23] VESELY F., Computational Physics, an Introduction (Plenum Press, New York) 1994.
[24] STAMM R., VOSLAMBER D., J. Quant. Spectr. Rad.
Transfer, 22 (1979) 599.
[25] STAMM R., TALIN B., POLLOCK E. L.,IGLESIAS C. A., Phys. Rev. A, 34 (1986) 4144.
[26] STAMBULCHIK E., MARON Y., High Energy
Densi-ty Phys,. 6 (2010) 9.
[27] ROSATO J., REITER D., KOTOV V., MARANDET Y., CAPES H., GODBERT-MOURET L., KOUBITI M., STAMM R., Contrib. Plasma Phys., 50 (2010) 398. [28] DUBOIS D. F., ROSE H. A., RUSSEL D., Phys. Rev.
Lett., 61 (1988) 2209.
[29] NEWMAN D. L., ROBINSON P. A., GOLDMAN M. V., Phys. Rev. Lett., 62 (1989) 2132.
[30] MARANDET Y., CAPES H., GODBERT-MOURET L., KOUBITI M., STAMM R., EPL, 69 (2005) 531. [31] STEHLE C., Astron. Astrophys. Suppl. Ser., 104 (1994)