COSMOGENIC "P AND "P IN THE ATMOSPHERE AND OLIGOTROPHIC OCEAN AND APPLICATIONS
TO THE STUDY OF PHOSPHORUS CYCLING by
Nathalie Anne Danielle Waser B.S., Physical Chemistry
M.S., Oceanography Universit6 Pierre et Marie Curie
(1987)
Submitted in partial fulfillment of the requirements for the degree of doctor of philosophy
at the
MASSACHUSETTS INSTITUTE OF TECHNOLOGY and the
WOODS HOLE OCEANOGRAPHIC INSTITUTION November 1992
Copyright Nathalie A. D. Waser 1992. All rights reserved.
The author hereby grants to MIT and WHOI permission to reproduce and distribute copies of this thesis document in whole or in part.
Signature of author
Joint Program in Oceanography Massachusetts Institute of Technology/Woods Hole Oceanographic Institution
Certified by
Dr. Michael P. Bacon Thesis Supervisor
.
7
Accepted by -'A / IIL. (llen R.M. Druffel Chair
Joint Committee for Chemical Oceanography Accepted by
"all
F
32 33
COSMOGENIC P AND P IN THE ATMOSPHERE AND OLIGOTROPHIC OCEAN AND APPLICATIONS
TO THE STUDY OF PHOSPHORUS CYCLING
by
Nathalie Waser
ABSTRACT
Cosmogenic 32P (14.28 days) and 33P (25.3 days) are powerful tracers of upper ocean P cycling, when coupled with time-series of the atmospheric sources. A method was developed to determine the low-level beta activities in rainwater and plankton. The wet deposition rates of 32P and 33P were determined during 12 months at a marine site, at Bermuda, coinciding with measurements of the activities and activity ratio 33P?2, P suspended particles and plankton tows at BATS station. The in situ production rates of radiophosphorus in the upper ocean were estimated by measuring the activities induced in Cl, K and S targets by cosmic rays. Knowledge of all the sources of radiophosphorus to the Sargasso Sea allowed the cycling of 32P and 33P in suspended particles and macro-zooplankton to be studied. The study was based on the determination of the activity ratio
33 32
P/ P in different particulate pools. The activity ratio was higher in particle collections dominated by higher levels in the food web. The increase in the ratio in plankton relative to rain allowed the determination of the turnover times of P in plankton and in situ graz-ing rates.
COSMOGENIC "P AND _"P IN THE ATMOSPHERE AND OLIGOTROPHIC OCEAN AND APPLICATIONS
TO THE STUDY OF PHOSPHORUS CYCLING by
Nathalie Waser ABSTRACT
Cosmic-ray produced 3P (t = 14.28 days) and 3P (t = 25.3 days) are power-ful tracers of upper ocean P cycling, when coupled with ti e-series estimates of the atmospheric sources. The cycle of cosmogenic 3P and 3P in the atmosphere and euphotic zone of the ocean was investigated in the Sargasso Sea. A method was developed for the determination of the low-level beta activities of both nuclides in rainwater and marine particulate matter. The fallout rates of 3P and 3P by precipitation were determined over a period of 12 months at a marine site, at Bermuda, coinciding with measurements of the activities and activity ratio 3P/2P in suspended particulate matter and plankton tows at the Bermuda Atlantic Time-series Study (BATS) station (310 50' N, 640 10' W). The in
situ production rates of 3P and 3P in the upper ocean were estimated by measuring the activities of 3P and "P produced in Cl, K and S targets exposed to cosmic rays at Woods Hole, on Mount Washington, and on l'Aiguille du Midi. Fallout by precipitation was found to be the major source of radiophosphorus to the ocean; in situ production in the
32 33
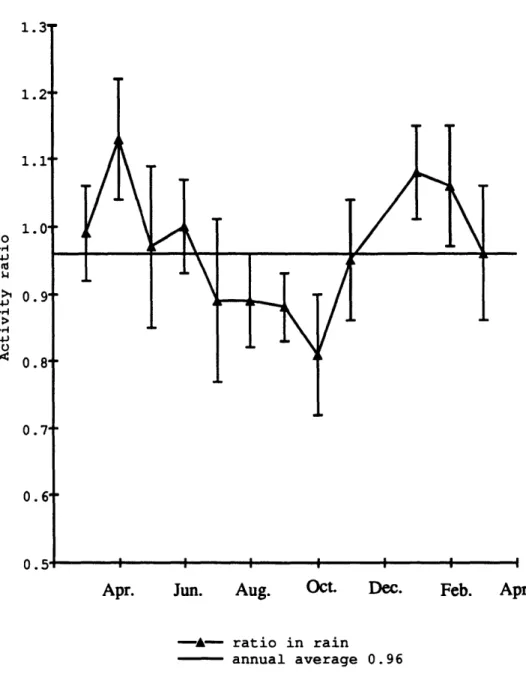
upper ocean was found to account for 5 % for P and 1 % for P of the wet deposition rates. Knowledge of all the sources of radiophosphorus to the Sargasso Sea allowed the cycling of 3P and 3P in suspended particulate matter and macrozooplankton to be studied. The study was based on a new approach consisting of the determination of the activity ratio 3P/ 2P in the different pools of phosphorus. The activity ratios 3 3P/2P in suspended particulate matter and plankton tows ranged from 1.0 to 5.0 and were either equal to or higher than the activity ratio in rainwater. The monthly activity ratio in rain was remarkably constant and on average 0.96. The increase in the ratio in plankton relative to rain can be interpreted as aging of the phosphorus in that pool or in the 1ool fror which it is derived. This is because of differential radioactive decay rates of P and 33P. The
activity ratio was higher in particle collections dominated by higher levels in the ocean food web. The residence time of P in macrozooplankton was estimated to range from 40 to 60 days. A grazing rate of macrozooplankton of 0.024 day was determined, allowing the determination of a grazing flux of 110 mg C/m2 /d and a flux of particulate carbon
ACKNOWLEDGEMENTS
Certainly this work would not have been possible without the support, friendship and encouragements of my friends, familly and colleagues. I want first to thank my
thesis advisor, Mike Bacon, for his continued support, encouragement and guidance
throughout the past four years. I want also to acknowledge Professor Devendra Lal who has been, as well as his work, a great source of inspiration and enthousiasm.
I want to thank colleagues and friends in the laboratory, Alan Fleer and Terry Hammar, for their tremendous help in innumerable techniques ranging from pumping to the art of beta counting.
Collection of the rain and marine plankton samples would not have been possible without the generosity and support of Tony Michaels and the technicians working at the Bermuda Biological Station, Frances Howse, Ann Close, Kjell Gundersen and Jens Sorensen. As well I am indebted to Ollie Zafiriou for taking me along on board the Endeavor.
My committee members, Ken Buesseler, Tony Michaels, Devendra Lal and John Edmond, have provided strong support and encouragement and I want to thank them for that.
Thanks to my close friends with whom I have shared memorable moments at Woods Hole, Jessica Langsam, Ed Brook, Markku Santala, Catherine Villaret, Mike DeGrandpre, Maren Tracy, Ein-Fen Yu, Kathleen Ledyard. Thanks also to my friends and colleagues with whom I shared exciting and instructive discussions, Kathleen Ruttenberg, Ed Brook, Greg Ravizza, Brad Moran and Roger Frangois.
Many thanks to the crew of R/V Weatherbird II, Captain Lee Black, Chief en-gineer Tony Sherriff, 2nd engineer Maurice Woodmore and deckhand Chris Gibbons for
their precious help. Thanks also to the cook Bruce Paynter for his warm support at times of low spirit due to "le mal de mer". Thanks also to the crew of the Endeavor and par-ticularly to the chief engineer for his assistance. I want also to thank Jo White at the Mount Washington Observatory and Tom Trull at the Laboratoire des Isotopes Stables for their precious help in exposing salts to cosmic rays.
Finally I want to thank Jake Pierson and Abby Jackson for their finantial support and great involvement in the educational program.
Enfin, merci ' toute ma famille, mes parents, Olivier et Raphadle, ainsi qu'a Patrice Klein pour son amitid. Un grand merci a Jean-Frangois Minster pour m'avoir encouragde et support6e a venir faire ma these dans le Joint Program.
Funding for this research was provided by NSF (grants 8800957, OCE-8817836 and OCE-902284), DOE (grant DE-FG02-88ER60681), Woods Hole Oceanographic Institution, Ocean Venture Funding of Woods Hole Oceanographic Institution and Scurlock Funds of Mr Arch Scurlock to MIT/WHOI Joint Program.
TABLE OF CONTENTS Page ABSTRACT 3 ACKNOWLEDGEMENTS 4 TABLE OF CONTENTS 5 LIST OF FIGURES 6 LIST OF TABLES 9 INTRODUCTION 12
CHAPTER 1. Methods of measurement of
3P
and 3P 18CHAPTER 2. Determination of the fallout rates of 3P and 3P at Bermuda 43 CHAPTER 3. In situ production of cosmogenic 3P and 3P in seawater 76 CHAPTER 4. Cosmogenic 3P and 3P recycling in plankton off Bermuda 96
CONCLUSIONS 142
LIST OF FIGURES
Figure 1.1. Net count rate of 3P as a function of external absorber Page
thickness 25
Figure 1.2. Net count rate of 3 3P as a function of external absorber
thickness 26
Figure 1.3. Net count rate of 1 Pm as a function of the external
absorber thickness 33
Figure 1.4. Relative counting efficiency of 3P as a function of source
thickness 34
Figure 1.5. Relative counting efficiency of 3P as a function of source
thickness calculated for different values of the absorption coefficient A. 36 Figure 2.1. Activity ratio 33P/PP in precipitation events collected at
BBSR from March 1991 to March 1992 49
Figure 2.2. Rainfall rates at St. David's, Bermuda, from January 1991 to
March 1992 50
Figure 2.3. Monthly rainfall rates at St. David's, Bermuda, from January
1991 to March 1992 51
Figure 2.4. Activity ratio 3 3P/ 2P in rain at Bermuda averaged monthly
from March 1991 to March 1992 56
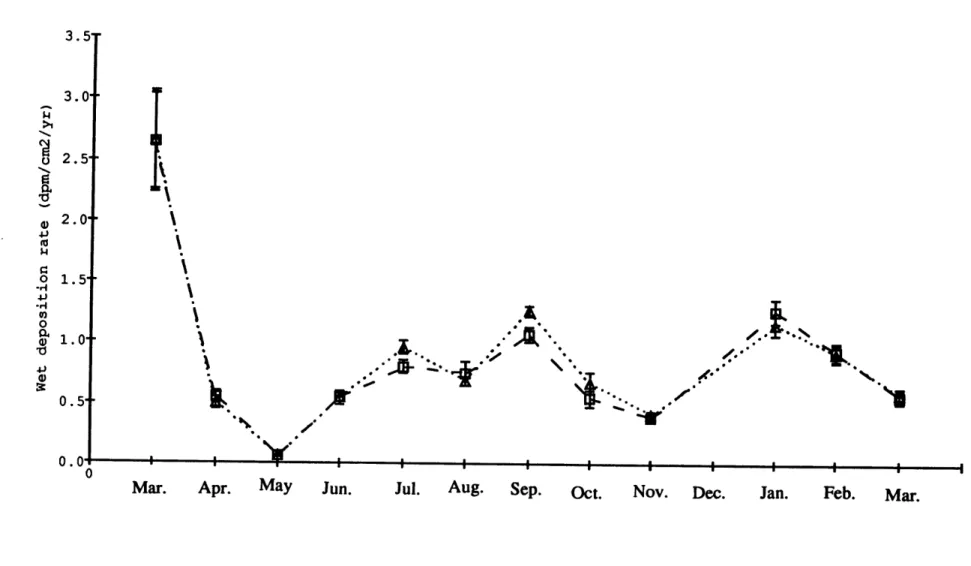
Figure 2.5. Wet deposition rates of 32P and 33P averaged monthly at
Bermuda from March 1991 to March 1992 57
Figure 2.6. Predicted 3 3P/2P activity ratio in rain as a function of
the residence time of tropospheric aerosols 66
Figure 2.7. Residence time of tropospheric aerosols computed for each
rain sample from the non-steady-state model and values of Ro of 0.6 and 0.7 67 Figure 2.8 Monthly 9Sr concentrations in pCi/I in precipitation at
32 Page
Figure 3.1 Logarithm of the production rates of 3P and 3P (atom/ P min/mol Cl) in chlorine. The least-squares of the logarithm of the
production rates are computed. The equations of the least-square fit are:
In 32P = (1/155) X + 0.76 and Ln 3P= (1/195) X -1.3 86 Figure 3.2 Forty-year record of the neutron count rate recorded by the
neutron detector at the Mount Washington Observatory (from J. Lockwood) 91 Figure 4.1 Specific activities of 3P and 3P (dpm/mg P) in surface
suspended particles (> 3 or 8 pm) during BATS 34 (15-19 July 1991), BATS 38 (11-15 November 1991), BATS 41A (24-26 February 1992) and
EN 235 (25-26 April 1992) at BATS Station 101
Figure 4.2 Profile of 3P specific activity (dpnx/mg P) in suspended
particles (>3
sm)
during EN 235, 25-26 April 1992, at BATS Station 102 Figure 4.3 Profile of 3P specific activity (dpnVmg P) in suspendedparticles (>3
sim)
during EN 235, 25-26 April 1992, at BATS Station 102 Figure 4.4a, bActivity ratio of 3P/2P in suspended particles and planktontows collected with nets (67, 300
sm-mesh
size net) during May and July1991 at BATS station 103
Figure 4.4c Activity ratio of "P/ 2p in suspended particles and plankton
tows collected with nets (67, 300 pm-mesh size net) during November 1991
at BATS Station 104
Figure 4.4d, e Activity ratio of 3 3P/ 2P in suspended particles and plankton tows collected with nets (67, 150 and 500
sm-mesh
size net) during Februaryand April 1992 at BATS Station 105
Figure 4.5 Monthly activity ratio 3 3P/2P in rainwater from March 1991
to March 1992, and activity ratio in surface suspended particles and plankton tows for May, July and November 1991, and February and
April 1992 106
Figure 4.6 Profile of the activity ratio 3 3P/ 2P in suspended particles
(>3
sm)
during EN 235, 25-26 April 1992, at BATS Station 107 Figure 4.7a. T profile for BATS 29A, 27 Feb to 1 March 1991 126Figure 4.7b. Figure 4.7c. Figure 4.8a. Figure 4.8b. Figure 4.8c. Figure 4.9a. Figure 4.9b. Figure 4.9c. Figure 4.9d. Figure 4.10a. Figure 4.10b. Figure 4.10c. Figure 4.10d. Figure 4.11a. Figure 4.11b. Figure 4.11c. Figure 4.11d. Figure 4.12a station Figure 4.12b. BATS station
P04 profile for BATS 29A, 27 Feb to 1 March 1991
NO3 profile for BATS 29A, 27 Feb to 1 March 1991
T profile for BATS 31, 15-19 April 1991
P04 profile for BATS 31, 15-19 April 1991
NO3 profile for BATS 31, 15-19 April 1991
T profile for BATS 34, 15-19 July 1991
P04 profile for BATS 34, 15-19 July 1991
NO3 profile for BATS 34, 15-19 July 1991 Chl a profile for BATS 34, 15-19 July 1991 T profile for BATS 38, 11-15 November 1991
P04 profile for BATS 38, 11-15 November 1991
NO3 profile for BATS 38, 11-15 November 1991 Chl a profile for BATS 38, 11-15 November 1991 T profile for BATS 41A, 24-26 February 1992
P04 profile for BATS 41A, 24-26 February 1992
NO3 profile for BATS 41A, 24-26 February 1992 Chl a profile for BATS 41A, 24-26 February 1992
Temperature profiles for EN 235, 23 April 1992, at BATS
NO3 profiles for EN 235, 23, 25 and 26 April 1992, at
Page 126 126 127 127 127 128 128 128 128 129 129 129 129 130 130 130 130 131 131
LIST OF TABLES
Page
Chapter Twoo 32 33
Table 2.1. Activities of P and P (A3 2 and A3 3
)
and activity ratio3 3P/ 2P (R) in rain samples obtained from the roof of a building at BBSR
52
Table 2.2. Activities of 32P and 33P
(A3
2 and A33 ) and activity ratio
P/P (R) in rain samples obtained from a 3 m2 rain collector situated
on the roof of Clark Building 53
Table 2.3. Seasonal averages of the activity ratio 33P 2P (R) in rain
and associated residence times of tropospheric aerosols at Bermuda for two
different values of Ro 53
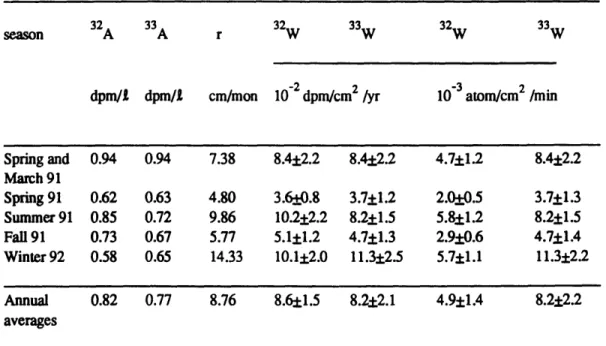
Table 2.4. Monthly averages of the activities of 32P and 33P (A 3 2 and
A3 3), rainfall rate (r) and wet deposition rates of 3P and 3P (W3 2 and
W3 3 )at Bermuda in 1991 and 1992 58
Table 2.5. Seasonal wet deposition rates of 32P and 33P (W
3 2 and W3 2),
seasonal activities (A3 2 and A3 3 ) and seasonal rainfall rates (r) 58 Table 2.6. Residence time (r) derived from the activity ratio 33P/ 2P
(R) in each precipitation event sampled 68
Chapter three
Table 3.1. Nuclear reactions occurring in nucleonic spallation reactions
in Cl, S and K 80
Table 3.2. Production rates of 3P and 3P in Cl, S and K targets at
l'Aiguille du Midi, Mount Washington and Woods Hole 85
Table 3.3. Comparison of production rates of 3P and 3P in Cl, S and K
at sea level 87
Table 3.4. In situ production rates of 3P and 3P in Cl, S and K targets. The production rates are calculated for the upper ocean and geomagnetic
latitude of Bermuda (% = 43.60 N) 90
Page
Chapter or33
Table 4.1. Specific activities of P and P and activity ratio P/ P
in plankton tows collected with a 67-sm plankton net in March 1991 at BATS
station 132
Table 4.2. Specific activities of 32P and 3P and activity ratio 3 3P? 2P
in plankton tows collected with a 300-sgm mesh net, 29 April-1 May 1991 at
BATS station 132
Table 4.3. Specific activities of 3 2P
and
3P and activity ratio 3 3P?2P in suspended particles (>8sm)
and in plankton tows (67-sm mesh size net)collected during BATS 34, 15-19 July 1991 133
32 33 33
Table 4.4. Specific activities of P and P and activity ratio P 2 in plankton tows and suspended particulate (>3 im) samples collected
during BATS 38, 11-15 November 1991 133
Table 4.5. Specific activities of 3P and 3P and activity ratio P 2
in plankton tows and suspended particulate (>3
sm)
samples collected duringBATS 41A, 24-25 February 1992 134
Table 4.6. Specific activities of 3P and 3P and activity ratio P 2 in suspended particles (>3
sm)
and in plankton tows collected duringEN 235 in April 1992 at BATS station 134
Table 4.7. Activities of 3P, 3P and concentrations of P in suspended
matter (> 3-8
sm)
at BATS station 124Table 4.8. Mass balance of 3P and 3P in the euphotic zone. The activities (i.e., A3 2 and A3 3
),
the radioactive decay terms (i.e., X3 2 A3 2and X3 3 A3 3 ) and wet deposition rates in the euphotic zone are computed 124 List of tables in appendix A
Table A.1. Total net count rates (Nt) and count rates with absorber (Na) for the rain samples collected at Woods Hole (first three rows) and
at BBSR during 1990, 1991 and 1992 145
Table A.2. Net count rates of the source with absorber (Na) and without (Nt) as a function of time, for particle samples collected at the Bermuda
Page
Table A.3. Thickness (d), yield (Y), counting efficiencies (E3 2 and £3 3),
volume of rain water (V) and net count rates at the time of collection (N3 2 and N3 3
)
of rain samples collected at Woods Hole (first 3 rows) andat BBSR 149
Table A.4. Thickness (d), yield (Y), counting efficiencies (E3 2 and E3 3 )
and net count rates at the time of collection (N3 2 and N3 3 ) in plankton
tow samples collected with a 67-pm plankton net in March 1991 150
Table A.5. Thickness (d), yield (Y), counting efficiencies (£3 2 and £3 3 )
and net count rates at the time of collection (N3 2 and N3 3 ) in plankton
tows collected with a 300-sgm net on 29 April-1 May 1991 151
Table A.6. Thickness (d), yield (Y), counting efficiencies (E3 2 and e3 3 )
and net count rates at the time of collection (N3 2 and N3 3 ) in suspended particles and in plankton tows collected with a 67-pm net during BATS 34,
15-19 July 1991 151
Table A.7. Thickness (d), yield (Y), counting efficiencies (£3 2 and £3 3)
and net count rates at the time of collection (N3 2 and N3 3 ) in plankton tow
and suspended particulate samples (3-sm mesh size) collected during BATS
38, 11-15 November 1991 152
Table A.8. Thickness (d), yield (Y), counting efficiencies (E3 2 and E3 3)
and net count rates at the time of collection (N3 2 and N3 3
)
in planktontows and suspended particulate samples (Millipore 3-sm) samples collected
during BATS 41A, 24-25 February 1992 152
Table A.9. Thickness (d), yield (Y), counting efficiencies (£3 2 and £3 3)
and net count rates at the time of collection (N3 2 and N3 3 ) in suspended
particles and in plankton tows collected during EN 235 in April 1992 at
BATS station 153
Table A.10. Thickness (d), yield (Y), counting efficiencies (£3 2 and £3 3)
and net count rates at the time of collection (N3 2 and N3 3 ) of the samples
exposed to cosmic rays in Woods Hole (X= 530 N), Mt. Washington
INTRODUCTION
In order to understand the magnitude and variations of primary productivity in the oligotrophic Sargasso Sea, as in any other oceanic province, it is essential to study the factors that control productivity. Primary productivity in the Sargasso Sea is likely regu-lated by the supply of nutrients into the euphotic zone during deep winter mixing (Menzel and Ryther, 1961; Marra et al., 1990) and by the rate of nutrient recycling (Goldman, 1988). Time-series measurements near Bermuda reveal correlations between the export flux of carbon, the flux of particle-reactive radionuclides in the deep ocean and primary productivity in the euphotic zone with a time-lag consistent with the sinking speed of large particles (Deuser and Ross, 1980; Bacon et al., 1985; Deuser, 1986; Asper et al.,
1992). The study of nutrient cycles in the upper ocean remains a central issue for a com-plete understanding of the biological pump and its effect on the deep ocean.
There is recent evidence that primary productivity in the Sargasso Sea is higher than previously estimated with 4 4C incubation techniques (Jenkins and Goldman, 1985;
Jenkins, 1988). Recent primary productivity estimates (Michaels et al., 1992) at the Bermuda Atlantic Time-series Study (BATS) station are two-fold higher than the histori-cal rate, possibly reflecting the use of cleaner techniques (Fitzwater et al., 1982). The fundamental processes that govern both the rate of carbon fixation and its export to the deep ocean remain poorly understood. Recent studies of photosynthesis-irradiance relationships suggest that there is a direct physiological control by nutrients on primary productivity in the North Sargasso Sea (Platt et al., 1992; Falkowski et al., 1992).
Overall, the exact relationship between new production, primary production and nutrients, particularly which nutrient is limiting productivity, remain in doubt.
Among the processes that are most important in nutrient cycles and their rela-tion to ocean productivity are uptake and regenerarela-tion rates and thus the fate and pathways of nutrients from the autotrophs to the higher trophic levels. The amount of C, N and P export to the deep ocean depends not only on the amount of nutrients being supplied to the euphotic zone, but also on the efficiency of the transfer of C, N and P to higher trophic levels (Eppley and Peterson, 1979; Goldman, 1988; Michaels and Silver, 1988). Therefore, it is important to determine the uptake rates, regeneration rates and turnover times of nutrients in the euphotic zone, because they directly determine the extent of new production versus primary production (Eppley and Peterson, 1979).
Phosphorus is one of the fundamental building blocks of all forms of living aquatic organisms. Its study has been neglected in favor of the cycles of nitrogen and carbon. It is a widespread view among biologists that N is the limiting nutrient in ocean ecosystems as opposed to P limitation in freshwater ecosystems (Perry and Eppley, 1981). Recently the role of P in the oligotrophic ocean has received renewed interest (Fanning, 1989; Michaels et al., 1992; Karl et al., 1992; Fanning, 1992). With the results of the time-series studies of two oligotrophic oceans, the Sargasso Sea and the North Pacific Sub-tropical Gyre, the role of P in the marine environment has been reexamined (Karl et al., 1992; Michaels et al., 1992). Fanning (1992) recently reported puzzlingly high ratios of dissolved inorganic nitrogen to dissolved inorganic phosphorus (DIN/DIP) in the North Atlantic Ocean in contrast to all other oceans, raising the question of the relative role of N and P as limiting nutrients. DIN/DIP ratios below the euphotic zone down to 800 m at BATS are high, sometimes up to 40 (mole ratio), and always higher than the Redfield ratio of 16 (Knap et al., 1991; Knap et al., 1992; Michaels et al., 1992). Unfortunately, dissolved organic nitrogen (DON) and dissolved organic phosphorus
(DOP) data are not measured routinely at BATS, so total dissolved nitrogen (TDN) and total dissolved phosphorus (TDP) cannot be compared. The high DIN/DIP regenerated below the euphotic zone might be indicative of P-depleted particles being regenerated or another source of nitrogen. These results are very puzzling and might be explained by (1) nitrogen fixation (Karl et al., 1992; Fanning, 1992), (2) high atmospheric supply of nitrogen relative to phosphorus due to polluted air (Fanning, 1989), or (3) blooms dominated by coccolithophorids (Fanning, 1992). These observations have pointed out the weakness of the current understanding of P and N cycles and their coupling in the oligotrophic ocean. If nitrogen fixation is truly an important process supplying N to phytoplankton in the ocean, then P should be the ultimate limiting nutrient.
The subject of this thesis is the study of the phosphorus cycle in the Sargasso Sea using two naturally produced radioisotopes of phosphorus. Cosmogenic 3P (t = 14.28 d; E = 1.71 MeV) and 3P (t = 25.3 d; E = 0.249 MeV) are beta emitters
max 1/2 max
produced by spallation reactions in Ar, in the atmosphere, and by spallation in Cl, S, Ca and K in the ocean. Very recently the first measurements of the minute activities of 3P and 3P in seawater were obtained (Lal and Lee, 1988; Lal et al., 1988). More extensive measurements of 3P were made in TDP, DIP, DOP and plankton tows (Lal et al., 1988; Lee et al., 1991; Lee et al., 1992) demonstrating the feasibility of applying 3P and per-haps 3P to the study of the P cycle in the upper ocean. There were very few data on 3P because 3P is a weak beta emitter and thus hard to detect.
The approach of this thesis consists of utilizing 3P and 3P and the ratio "P/2P to determine the residence time of P in plankton and in the euphotic zone and the export of P out of the euphotic zone at the Bermuda Atlantic Time-series Study (BATS) station (310 50' N, 640 10' W) in different seasons. In order to determine the turnover times of P in particles and in the total dissolved phosphorus, the mass balances of 3P and 3P in the euphotic zone need to be accurately constrained. The fallout rates of 3P and 3P by
precipitation at Bermuda and the in situ production rates in seawater have thus been determined. The wet deposition rates of 32P and 3P have not been previously estimated at
Bermuda, and it is important to document the variability of the supply of these short-lived nuclides at the study site. The in situ production of 3P and 3P has been estimated pre-viously (Lal et al., 1988) but not measured directly in all of the possible targets in sea
Bibliography
Asper, V.L., W.G. Deuser, G.A. Knauer and S.E. Lohrenz, 1992. Rapid coupling of sinking particle fluxes between surface and deep ocean waters. Nature 357:670-672. Bacon, M.P., C. Huh, A.P. Fleer and W.G. Deuser. -1985. Seasonality in the flux of natural radionuclides and plutonium in the deep Sargasso Sea. Deep Sea Res. 32:273-285.
Deuser, W.G. 1986. Seasonal and interannual variations in deep-water particle fluxes in the Sargasso Sea and their relation to surface hydrography. Deep Sea Res. 33:225-246. Deuser, W.G. and E.H. Ross. 1980. Seasonnal changes in the flux of organic carbon to
the deep Sargasso Sea. Nature 283:364-365.
Eppley, R.W., and B.J. Peterson, 1979. Particulate organic matter flux and planktonic new production in the deep ocean. Nature 282:677-680.
Falkowski, P.G., R.M. Greene and, R.J. Geider. 1992. Physiological limitations on phytoplankton productivity in the ocean. Oceanogr. 5(2): 84-91.
Fanning, K.A., 1992. Influence of atmospheric pollution on nutrient limitation in the ocean. Nature,
339:460-Fanning, K.A., 1992. Nutrient provinces in the sea: concentration ratios, reaction rate ratios, and ideal covariation. J. Geophys. Res. 97:5693-5712.
Fitzwater, S.E., G.A. Knauer and J.H. Martin, 1982. Metal contamination and its effect on primary production measurements. Limnol. Oceanogr., 27: 544-551.
Goldman, J. C., 1988. Spatial and temporal discontinuities of biological processes in pelagic surface waters. In: B.J. Rothschild (ed), Toward a theory on biological-physical interactions in the world ocean. Kluwer Academic Publisher, pp 273-296.
Karl, D.M., R. Letelier, D.V. Hebel, D.F. Bird and C.D. Winn. 1992. Trichodesmium blooms and new nitrogen in the North Pacific gyre. In: E.J. Carpenter, D.G. Capone and J.G. Rueter (eds.), Biology and ecology of diazotrophic marine organisms: trichodes-mium and other species. Kluwer Academic Publishers, pp 1-19.
Knap, A. H., Michaels, A.F., R.L. Dow, R.J. Johnson, K. Gundersen, J. Sorensen, and A. Close, M. Hammer, G.A. Knauer, S.E. Lohrenz, V.A. Asper, M. Tuel, H Ducklow, H.
Quinby, P. Brewer and R. Bidigare, 1992. U.S. Joint Global Ocean Flux Study, Bermuda Atlantic Time-series Study. BATS Data Report B-2, 1992.
Knap, A. H., Michaels, A.F., R.L. Dow, R.J. Johnson, K. Gundersen, G.A. Knauer, S.E. Lohrenz, V.A. Asper, M. Tuel, H Ducklow, H. Quinby and P. Brewer 1992. U.S. Joint Global Ocean Flux Study, Bermuda Atlantic Time-series Study. BATS Data Report
B-1A, 1991.
Lal, D. and T. Lee, 1988, Cosmogenic 3 2 P and 3 3 P used as tracers to study phosphorus recycling in the ocean. Nature 333:752-754.
Lal, D., Chung, Y., Platt, T. and T. Lee, 1988, Twin cosmogenic radiotracer studies of phosphorus cycling and chemical fluxes in the upper ocean. Limnol. Oceanogr.
33:1559-1567.
Lee, T., E. Barg and D. Lal, 1991. Studies of vertical mixing in the Southern California Bight using cosmogenic radionuclides 3
2 P and 7 Be, Limnol. Oceanogr. 36:1044-1053.
Lee, T., E. Barg and D. Lal, 1992. Techniques for extraction of dissolved inorganic and organic phophorus from large volumes of seawater. Anal. Chim. Acta 260:113-121. Marra, J., R.R. Bidigare and T.D. Dickey, 1990. Nutrients and mixing, chlorophyll and phytoplankton growth. Deep Sea Res., 37:127-143.
Menzel, D.W. and J.H. Ryther, 1961. Annual variations in primary production of the Sargasso Sea off Bermuda. Deep Sea Res., 7:282-288.
Michaels, A.F., A.H. Knap, R.L. Dow, K. Gundersen, R.J. Johnson, J. Sorensen, A. Close, G.A. Knauer, S.E. Lohrenz, V.A. Asper, M. Tuel and R. Bidigare, 1992. Ocean time-series measurements off Bermuda: The first two years of US JGOFS Bermuda Atlantic Time-series Study. Deep Sea Res., in press.
Michaels, A.F and M.W. Silver, 1988. Primary production, sinking fluxes and the microbial food web. Deep Sea Res., 35:473-490.
Perry, M. J. and R. W. Eppley, 1981. Phosphate uptake by phytoplankton in the central North Pacific Ocean. Deep Sea Res., 28A:39-49.
Platt, T., S. Sathyendranath, 0. Ulloa, W. Harrison, N. Hoepffner and J. Goes. 1992. Nutrient control of phytoplankton photosynthesis in the Western North Atlantic. Nature 356:229-231.
Chapter One
METHODS OF MEASUREMENT OF 32P AND 33P
I INTRODUCTION
Activities of 3P (t = 14.28 days) and 3P (t = 25.3 days) in seawater have only
been measured very recently (Lal et al., 1988; Lal and Lee, 1988; Lee et al., 1991; Lee et
al., 1992). In spite of their tremendous potential for tracing processes involving
phos-phorus in the environment, the very low activities in nature have impeded their use in biogeochemistry. Very low counting backgrounds and, more importantly, high specific activities are essential to their detection by low-level
1
counting. The background can be reduced by the use of an anticoincidence system surrounding the primary detector. High activities can be obtained by preconcentration in the field. Preconcentration of the ac-tivity in rainwater is achieved here by concentrating the acac-tivity of the dissolved phase on alumina, a specific adsorbent of phosphate, in a system similar in principle to the one used by Silker (1969, 1971). Large volume filtration is utilized to collect suspended particulate matter. To separate 3 2 P and 3 3 P a nuclear technique has to .be sought. The two isotopes are distinguished by their half-lives and by the very distinct energy spectrum of the electrons emitted in the decay. Their half-lives are not different enough to enable their separation by decay-curve analysis. In contrast, 3 2 P (E = 1.71 MeV) is a much more energetic emitter than 3 3 P (E = 0.249 MeV). As a consequence, the absorption characteristics of the two isotopes differ enough that an external absorber of a given thickness will absorb all the radiation from 3 3 P but only a small fraction of the radiation from 3 2 P. I have used this absorber method toseparate
3 2 Pand
3 3 p.H COLLECTION AND EXTRACTION OF RADIOPHOSPHORUS
1- Principle
The preconcentration of dissolved 32 P and 3 3 p from rainwater has been achieved by extracting the radiophosphorus on alumina. The sorption properties of alumina with respect to orthophosphate have been well studied. Sorption studies have been carried out at different pHs, P04 concentration, and in the presence of inorganic and
organic species (Chen et al., 1973; Huang, 1975; Stumm et al., 1980; Morel, 1983). The process by which P04 binds to the surface has been described as a ligand exchange
reaction in which P04 replaces a hydroxide group at the surface (Stumm et al. 1980). In
addition, my own experiments have shown faster removal of P04 from solution on
freshly precipitated aluminum hydroxides than on freshly precipitated ferric hydroxides in the absence of other inorganic or organic species at pH 7. For this reason, alumina was the adsorbent of choice for this study.
2- Rain sampling
Rain samples were collected from the roof of a building at the Bermuda Biological Station for Research (BBSR) and from a collector situated on the roof of Clark building in Woods Hole. The collectors enabled the collection of the 10 to 60 £ of rain-water necessary to detect radiophosphorus. The rainrain-water was spiked with 100 gmoles of stable KH2 PO4 , which served as carrier and enabled the yield of the extraction and purification procedures to be determined. The rainwater was left to equilibrate for 4-6 hours. The sample was then pumped (with a peristaltic pump) through a plexiglass unit containing about 7 g of alumina (Activated alumina, 98% powder, Matheson Coleman and Dell) packed between two porous polyethylene filters (3.5 cm in diameter). The extraction efficiency of P04 was better than 98% for a volume of 60 1 of rainwater and
In the laboratory, 50-140 1 of distilled water and filtered seawater (0.2
sm)
from Vineyard Sound were spiked with stable phosphate. Phosphate was extracted on alumina with efficiencies higher than 98% in the case of distilled water. In the experiment with filtered seawater, the efficiencies decreased from 100 to 90 % during the course of the extraction. Once the extraction was completed, the resin was sent by Federal Express to WHOI, where the alumina was processed in the laboratory.3- Particulate sampling
Different size fractions of particles were sampled. Particles were collected using 293-mm diameter Millipore filters (3 or 8 prm mesh size). These samples were collected with a simple filtration system which consisted of either an impeller pump or a diaphragm pump connected to a 293-mm filter holder. The pump was placed upstream of the filter holder. For surface samples a vacuum hose was lowered to a depth of 3-5 meters over the side of the ship. For deep samples the vacuum hose was attached to a weight on the hydrowire, and the rest of the hose was allowed to float freely at the surface. With this system I could pump 1,000 1 at 10 to 45 psi in about 1 hour. The filter clogged fast and was changed as soon as the flow rate started to decrease, which was about every hour. The filters were immediately frozen to avoid release of phosphorus compounds (Collier and Edmond, 1984). Particles larger than 67, 150, 300 and 500 gm were harvested with plankton nets. The particles were sampled at the surface and at depth. Samples were recovered from the cod end and gravity filtered on Whatman filters and immediately frozen.
III RADIOCHEMICAL PURIFICATION
The Al2 03 was removed from the filter holders and slurried in 1 N NaOH. NaOH has been reported to be efficient at releasing P04 adsorbed by aluminum oxides
and hydroxides (Dickman and Bray, 1940; Turner and Rice, 1954). NaOH (1N) removed adsorbed P from A12 03 , but large volumes of it were necessary to get good recoveries (> 50%). Typically for rain samples 800 mi to 1 I of 1N NaOH was used and boiled down
to about 200 mi. The alkaline solution was then poured gradually into a 6 N HN03 solution. The pH of the solution was kept below 2 to avoid formation of massive amounts of aluminum hydroxide colloids.
2- Particulate samples
The frozen Millipore filters and the zooplankton samples were refluxed for a few hours in concentrated HNO3 until the solution was clear. If refractory particles were
present, the solution was filtered. The solution was then taken down to a small volume and diluted to about 1 N HN03 with distilled water. At this point, an aliquot of the solution was analysed for phosphate, i.e. the yield monitor, by the classic molybdenum blue method (Murphy and Riley, 1962; Koroleff, 1983).
3- Radiochemical procedure
The chemical purification of phosphorus is based on a series of specific phosphate precipitations, which have been described in the classic chemistry and radiopurification methods (Hillebrand et al., 1959; Mullins and Leddicotte, 1962; Volchock and De
Planque, 1983; Whaley and Ferrara, 1972). The sample solution in HNO3 was heated, and an excess of ammonium molybdate was added. This solution was heated to about 30-40 0 C and stirred until a yellow precipitate of ammonium phosphomolybdate (NH4 )3 P04 (MoO3 )1 2 appeared. The ammonium phosphomolybdate precipitation is a
preliminary separation which reduces the amount of heavy metals, particularly Fe, Co, Ni, Cr, Ti and Zr (Mullins and Leddicotte, 1962). Heating of the solution was stopped
while stirring was maintained and the precipitation process allowed to continue. If heat-ing was continued too long (at temperatures higher than 50 0 C), molybdic acid would
start to precipitate, and the precipitate would be contaminated with Si, As and V (Hillebrand et al., 1959). After about one hour the precipitate was vacuum filtered through a Millipore HA filter (0.45
sm,
47 mm in diameter) and washed with 1 N HNO3 . Sometimes the precipitate was so fine that a 0.2sm
MilliporeTM filter had to beused. The precipitate was dissolved with NH4 OH and the solution acidified to 1 N HNO3 . Ammonium phosphomolybdate was precipitated a second time and redissolved
with ammonia. The pH of the solution was then lowered to about 7 with HCl. The solu-tion was cooled in an ice bath. A reagent containing MgCl2 and NH4 Cl was added to
the cold solution. Drops of NH4 OH were added while stirring. A white crystalline precipitate of ammonium magnesium phosphate formed. An excess of concentrated NH4 OH was added. The NH4 MgPO4 .6H2 0 precipitate in solution was stirred for 15
min and cooled for half an hour in an ice bath. This step is not a separation, since there is a large number of interferences with the precipitation. The advantage of the NH4 MgPO4 .6H2 0 precipitate is that it can be dissolved in HCl while
(NH4 )3 PO4 (MoO3 )1 2 cannot. The NH4 MgPO4 .6H2
0
precipitate was vacuumfil-tered through a Millipore HA filter (0.45 gm, 47 mm in diameter), washed with dilute NH4 OH, and dissolved in 9 N HCl. A cation exchange column of AG-50W-X8 Cl,
100-200 (Analytical grade resin from Biorad Laboratory) mesh was conditioned with 3 volumes of 9 N HCl. The solution was loaded on the column and 1 volume of 9 N HCl was passed through to rinse. The cation exchange resin allows separation of Ca, K, Fe, Al, V, W, Zn, Zr and Ti, which will interfere with the final MgNH4 PO4 .6H2 0
precipita-tion (Hillebrand et al., 1959; Mullins and Leddicotte, 1962; Whaley and Ferrara, 1972).
Concentrated NH4 OH was added to make the pH neutral, and the solution was put again in an ice bath prior to the last precipitation. MgNH4 PO4 .6H2 0 was precipitated as
25 mm in diameter). The area of the precipitate was 2.75 cm2 . The precipitate was hygroscopic and it was thus dried carefully until the weight was constant. It was then
TM
mounted face down on a film of Mylar (thickness = 0.9 mg/cm2 ). The film of Mylar
was supported by a white Delrin ring. A silver planchet (140 mg/cm2 ) was placed on top of the filter, and the source was sealed with tape to ensure no change in the weight of the precipitate. The source was counted on an anticoincidence low-level
p
counter.IV LOW-LEVEL BETA COUNTING
A thin-wall anticoincidence counter was used for low-level beta counting. The basic feature of low-level 0 counting that distinguishes it from ordinary
p
counting is the use of an anticoincidence guard detector next to the primary detector. The primary detec-tor used here was similar in design to that of Lal and Schink (1960). The detecdetec-tor is a gas-flow counter and operates in the Geiger-Muller region. The plateau starts at 820-860 Volts. The detector was operated at a voltage centered on the plateau. Q-gas (98.7% Helium and 1.3% isobutane) flows continously through the sealed counter chamber. The 2.54 cm window is a thin 0.9 mg/cm2 aluminized Mylar. The background of the detector is significantly reduced by the guard detectors. Typically the background is about0.25-0.5 cpm with an error of 0.02 cpm. This background is about 50 times lower than that of
a detector without the guard detectors. The counting system is usually stable (no change in the background) for periods of 30 days or more. The detector measures beta radiation in pulse-type mode. The pulses from the source and the guard detectors are first amplified by Pelagic Electronics Model 7030-2 preamplifiers. They are further amplified by a Canberra Model 2012 amplifier. Pulses from the guard detector are sent to a Pelagic Electronics Model 7030-4 gate driver. Pulses from the source are sent to a Canberra Model 2032 dual discriminator, which is coupled to a Gate Driver and further through a Canberra Model 2035A single-channel analyzer and a Canberra Model 1476A scaler.
V SEPARATION OF 33P 32,
A nuclear method was used to separate the two radioisotopes of P based on the difference in energy of the beta particles emitted in their decay. Phosphorus-32 is a hard
p
emitter with an end-point energy, E = 1.71 MeV, while 3 3 p is a softP
emitter with E =0.249 MeV. This difference in energy between the two isotopes results in different absorption characteristics for theP
particles. The interaction ofp
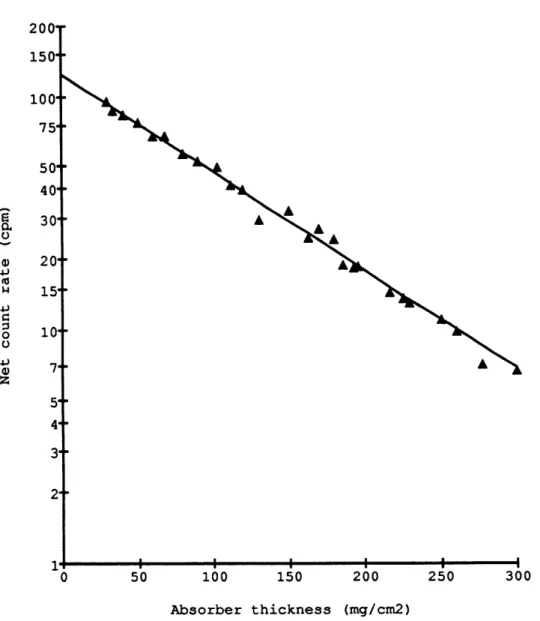
particles with matter is described by the experimental half-thickness of absorption x which is the thickness of a solid material between the source and the detector that will absorb half of the emitted radiation. The intensity of a source I as a function of the external absorber thickness x is simply approximated by: I = Io exp( -In 2 x /x ), where Io is the intensity of the source with no external absorber (Libby, 1947). I have found that the activity of 3 2 p is decreased by a factor of 2 when an aluminum foil of 71.6 +2 mg/cm2 is placed between the source and the detector (Figure 1.1). The mass absorption coefficient p (p = In 2 /x ) was thus calculated to be 9.7 + 0.3 cm2 /g. These experimental values are comparable to some previous studies. An empirical formula relates p and the maximump
energy as follows: p = 22/ E 1 33 for 0.5 s E 2 6 MeV. For E = 1.71 MeV the calculated p ismwx max max
10.8 cm2 /g (Price et al., 1958) which is very close to the value of 9.7 cm2 /g found in
this study. Libby (1957) reported a different relationship, i.e. 1/p = 55 E/, which yields a lower p and a higher x of 84 mg/cm2. For the range of absorber used in my separa-tion method, i.e. 6 to 40 mg/cm2 , the two extreme half-thicknesses 72 and 84 mg/cm2
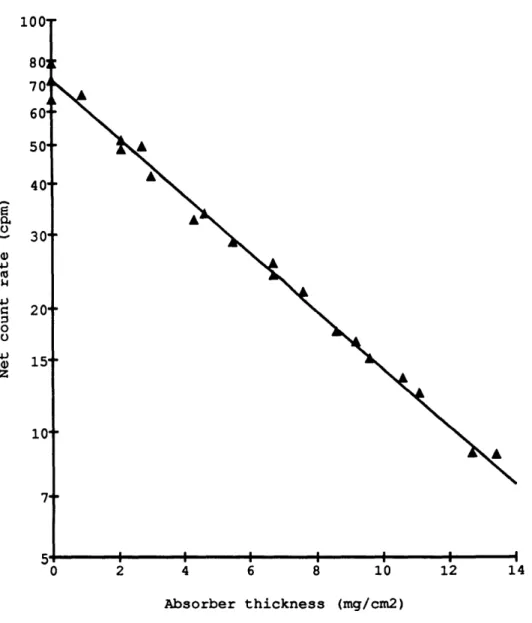
yield activities which differ by 1 % to 5 %. In the case of 3 3 P, a foil of only 4.3 + 0.1
Absorber thickness (mg/cm2)
300
Figure 1.1. Net count rate of 3P as a function of external absorber thickness.
0 2 4 6 8 10 12 14
Absorber thickness (mg/cm2)
This half-thickness is in close agreement with x1/2 of 4.9 mg/cm2 found for 4 5 Ca
(E =0.255 MeV) in Al (Libby, 1957). Thus from the absorption curves of 3 2 P and 33 P
rm
one can choose a thickness of aluminum that will block essentially all the radiation from 3 3 P and decrease the radiation from 3 2
P
by a known small amount. The thickness of aluminum was chosen so that the estimated activity of 33p in the source would be decreased to less than 0.02 cpm when the source was counted with the absorber.In order to separate 3 2 P and 3 3 p the samples were counted repeatedly in time with and without external absorber. The time-dependent curve generated without absorb-er represents the total activity of the sample. The curve with absorbabsorb-er represents the activity of 3 2 P, decreased slightly due to the absorption of 0 particles in the absorbing material. The initial net count rates 3 2 No and 3 3 No of 3 2 P and 3 3 P, i.e., the net count
rates at the time the sample was first counted, are then determined by the difference of the two time-dependent curves. The activities at the time the sample was collected were calculated from the known decay rates of 3 2 P and 3 3 P. The equations describing the total gross count rates without absorber G and with absorber G at a given time are the
ta following: (1.1) G = N
+ B
= 3 2N
+3 3N+B=N
0 exp (-, t)+B
t t t (1.2) G =N+ B =
3 2 N 3 2p
+ 3 3 N 3 3p
+ B
=32No 32 exp (_ 3 2 X t)+ B
a a whereN : total net count rate in cpm
t
N a: net count rate with absorber in cpm B : background count rate
32 N: net count rate of 3 2 P in cpm 3 3 N: net count rate of 3 3 P in cpm
3 2
p:
fraction of 3 2 P transmitted through the absorber.3 2 0 = exp(-
In 2
x/71.6).x: thickness of the absorber, in mg/cm2.
3 3
p:
fraction of 3 3 P transmitted through the absorber. 3 3 0 = exp(- In 2 x/ 4.3).3 2 X: decay constant of 3 2 p.
In practice each sample was counted long enough to obtain 8% or less counting error both with the external absorber and without. Typically the thickness of the absorber ranged from 6 to 40 mg/cm2 for the low count rate (plankton samples) to the high count
rate samples (rainwater samples), respectively. N (i.e., 3 2 N 3 2 p + 3 3 N 3 3 p) was usually approximated by 3 2 N 3 2 P, since the absorber was chosen to allow absorbtion of essentially all the radiation of 3 3 P so that 3 3 N 3 3 p < 0.02 cpm. This approximation was verified when 3 2 No and 3 3 No were determined, by calculating 3 3 N0 3 3
p.
Thetwo curves Nt (t) and Na (t) were then fitted by least squares. The source was counted repeatedly over 30 to 60 days, allowing a minimum of 10 points on N and 5 on N . The
t a
general equations used for the fit are:
N = a exp(- a t)
Na b exp(- 3 2 X t)
The values of the initial net count rates 3 2 No and 3 3 No were determined by the inter-cepts, a and b, of the two curves with y axes. At this point the term 3 3 No 3 3
p
was computed to verify that 3 3NO
33 0 was smaller than 0.02 cpm. For samples of ex-tremely low total activity, there was sometimes a remaining activity of 3 3 P in theabsorber curve (3 3 N 33 0 > 0.02 cpm) which was corrected for by substracting the estimated activity of 3 3 P from the curve with absorber. The correction was iterated until
VI DETERMINATION OF ABSOLUTE ACTIVITIES
The initial net count rates, 32 N" and 3 3 N*, were converted into absolute ac-tivities 3 2 A0 and 33 A0 by taking into account the counting efficiency, E, and the yield
of the procedure, y. The absolute activities were calculated as follows:
A
0= No / y e
The absolute activity at the time of collection is: A 0 = A0 exp( X t )
where, t is the time elapsed between collection and initial counting time, and X is the decay constant. The activity ratio r of 3 3 P to 3 2 P is:
r =
3 3A
0 / 3 2A"=3
3N0 3 2 E /3 2N 33
The counting efficiency, e, for a given radioisotope varies with the thickness of the source according to the following relationship (Libby, 1947):
(1.3) S / Eo = (1 - exp(- g d)) / (g d) where
s:
self-absorption coefficient in cm2 /mg d: thickness of the source in mg/cm2E: counting efficiency for a source of thickness d eo : counting efficiency for an infinitely thin source
Typically, the thicknesses of the samples, d, varied from 2 to 12 mg/cm2. Self-absorption and scattering processes in the source, Self-absorption in the air and window and backscattering processes on the backing material were all included in one parameter: Eo , the counting efficiency for an infinitely thin source. The thickness of the backing material is chosen to be the thickness of saturation (or close to it) to allow maximum backscattering. Experiments have shown that saturation is reached for a thickness of about 20% of the range of a nuclide (Price et al., 1958; Wang et al., 1975; Choppin and
Rydberg, 1980). The ranges in aluminum are 800 mg/cm2 for 3 2 P and 60 mg/cm2 for
3 3 P, and the saturation thicknesses are 12 mg/cm2 for 3 3 p and 160 mg/cm 2 for 3 2 p (Choppin and Rydberg, 1980). The fraction of the electrons backscattered increases with the atomic number of the backing material. Silver (A = 47) was chosen and gives a factor of 1.65 increase in the counting efficiency at saturation backscattering for 3 2 p (Choppin and Rydberg, 1980). For 3 3 P, absorption in air and in the window of the detector
eliminates some of the backscattered particles, and therefore the factor is lower, about
1.35. The thickness of the silver planchet used for backing material was about 140
mg/cm2, which is well beyond the saturation thickness of 3 3 P and very close to the saturation thickness of 32 P.
1- Counting efficiency
The overall counting efficiencies 32 E and 3 3 E were experimentally obtained by
counting sources of constant activity and of varying thickness. Previous studies by Nervik and Stevenson (1952) have shown that the efficiency curves are not simply described by equation (1.3), which models the effect of absorption only, because self-scattering in thin sources can also be an important process. Their study showed that the shape of the efficiency curve is a function of the composition of the source (nature of the precipitate) and the energy of the beta emitter. For the weak emitters S (E = 0.167
max
MeV) and 1 Pm (E = 0.244 MeV) the efficiency curves exhibit a maximum for very
max
thin sources (about 1-2 mg/cm2 ) followed by an exponential decrease with thickness.
For the high energy emitters32 P and Y (E = 2.28 MeV), the curves increase slightly
max
initially and reach a plateau (Nervik and Stevenson, 1952). The transition in the curve for both hard and soft beta emitters is due to the relatively higher importance of self-scattering versus self-absorption in the thin sources. The transition is also dependent on the composition of the source. The exponential decrease is due to self-absorption only and can be described by equation (1.3).
a)- Counting efficiency of P
Phosphorus-32 was commercially available from DuPont in a solution of KH2 PO4 . The 3
2 p purchased was not a standard and had to be standardized.
Verification of the purity of the tracer was obtained by determining the half-life and the half-thickness of absorption on the low level beta counting system. The half-life was, within the error, 14.28 days and the half-thickness was 71.6 mg/cm2 . The solution was then standardized by counting a thin source of 3 2 P, evaporated on a stainless steel plan-chet on a 2H gas-flow proportional counter (Nuclear Measurements Corporation, model PCC_1IT). The counter had been calibrated by the manufacturer with sources of beta emitters of different E on stainless steel, and I recalibrated it with standards of 2 3 4 Th and 1 7 Pm (Amersham). A standard of 2 3 4 Th was prepared by separation from a high purity U3 Os standard solution (NBS 950A) in which 2
34 Th had grown into radioactive
equilibrium (Fleer, 1991). My calibration agreed with that of the manufacturer and a 72 % counting efficiency was determined for 3 2 P on the 2r1 gas-flow proportional counter. The standardization of the 3 2 P in KH
2 PO4 solution from DuPont could then be done. A known amount of activity of 3 2 P was precipitated as NH4 MgPO4 .6H2 0 with varying amounts of stable P04 . The sources were dried until the weight was constant then sealed and counted. Phosphorus-32 is a hard beta emitter and the efficiency was almost constant in the range of thicknesses encountered in all the samples. The efficiency for an infinitely thin source, co , was calculated by evaporating drops of a standard solu-tion of 3 2 P on an area of 2.75 cm2 centered on the Mylar film. This was to ensure that all the activity was distributed on an area equal in size to the area of the precipitate, be-cause the counting efficiency is not the same in all the area of the source (Lal and Schink, 1960). A Milliporem filter and a silver planchet were placed on top of the source. The efficiency for an infinitely thin source and for all thicknesses from 2 to 8 mg/cm2 was 49%.
b)- Counting efficiency of 33P
A solution of KH2 PO4 of unknown activity of 33 P was obtained from DuPont.
A standard of 14 7 Pm was available from Amersham and was used as an analogue of
3 3P. 1 4 7Pm
(t = 2.6234 y) has an end point energy of 0.224 MeV which is extremely
close to that of 3 3 P (E = 0.249 MeV). It is therefore expected that the two
max
radioisotopes will have a similar half-thickness of absorption. A 14 7 Pm standard was
evaporated on a silver planchet and its absorption curve was generated (Figure 1.3). The exponent of that curve is 0.156 cm2 /mg and the half-thickness of absorption is 4.4 + 0.1
mg/cm2 . Within experimental errors it is identical to 4.3 + 0.1 mg/cm2 , the half-thickness of 3 3 P. Thus 1 47 Pm and 3 3 P were considered to be equivalent with respect to their properties of interaction with matter. A known activity of 147 Pm was evaporated on a Mylar film. A filter and a silver planchet were put on top so that this standard was as similar to the sample as possible. The ratio of the net count rate to the activity of this standard was the counting efficiency of 3 3 P, 3 3 Eo , for an infinitely thin source. To calculate 3 3 e for all thicknesses, a carrier free unknown activity of 3 3 P04 was precipitated as MgNH4 PO4 .6H2 0 with increasing amounts of stable P04 . A curve
was generated of the net count rate as a function of thickness. The expected decreasing curve was regressed with a least square method and the intercept at 0 mg/cm2 was deter-mined. That intercept was assumed to be the net count rate for an infinitely thin source,
3 3 Eo
.
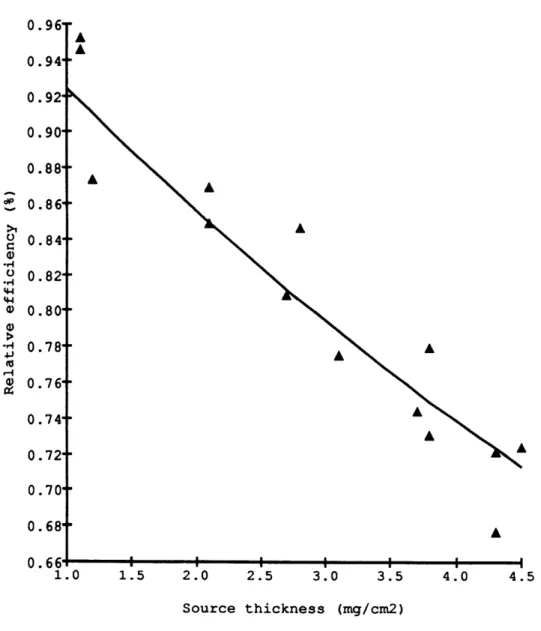
Since from our 14 7 Pm standard 3 3 Eo was already known (i.e. 26%) the rest of the curve could then be calibrated. The curve did not exhibit any maximum, possibly because (1) I could not make sources thinner than 1 mg/cm2 or (2) self-scattering is small in MgNH4 PO4 .6H2 0. I concluded that the efficiencies might be underestimated by upto 3 % when using equation (1.3) to calculate the efficiency of 3 3 P. Figure 1.4 shows the counting efficiency,3 3 e, as a function of sample thickness. The counting efficiencies for an infinitely thin source, 3 3 Eo , were the same within 1 % for all 4 counters. The relative
12 14 16
Absorber thickness (mg/cm2)
Figure 1.3. Net count rate of 1Pm as a function of external absorber thickness.
0.9 0.9 0.9 0.9 0.8 0.8 0.8 0.8 0.8 0.7 0.7 0.7 0.7 0.7 0.6 1.0 1.5 2.0 2.5 3.0 3.5 4.0 4.5 Source thickness (mg/cm2)
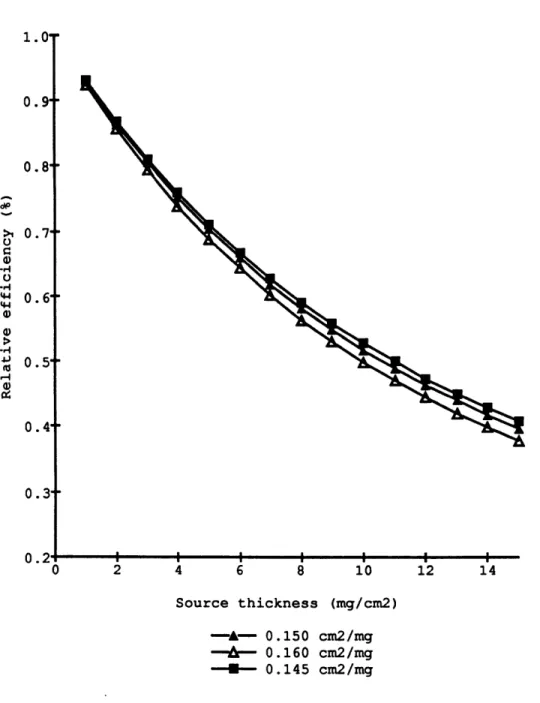
The exponent p of the curve was determined for each detector. It varied from 0.145 to 0.160 and averaged 0.150 + 0.01 cm2 /mg. These values all agreed within the
error of the regression. Figure 1.5 shows the effect of a change in p on the relative ef-ficiency. The error on the absolute efficiency is estimated to be less than 2 % for an error
of 0.01 cm2 /mg on p. The counter efficiency e (expressed in %) for a sample of
thick-ness x (expressed in mg/cm2 ) is calculated from the experimental relationship:
(1.4) e = 26 (1 - exp(-0.150 x)) /(0.150 x)
2- Yield of procedure
The chemical yield was calculated as the ratio of the amount of stable P in the source relative to the amount of stable P initially present. The determination of the yield was different according to the sample type. For rainwater samples 100 ptmoles KH2 P04
were added to the rainwater. The amount of P04 present in the final NH4 MgPO4 .6H2 0
precipitate was determined colorimetricaly with the classic molybdenum blue method (Murphy and Riley, 1962; Koroleff, 1983). This procedure was used because the amount of phosphate in the source could not be precisely determined from the weight of the precipitate. This was because the precipitate is hygroscopic and the stoichiometry is not always 6H2 0. For plankton and suspended particulate samples, the initial amount of
P04 was measured colorimetrically after digestion with nitric acid. In the case where the
amount of phosphate exceeded 100
smoles,
the sample was split so that thin sources could be obtained to minimize self-absorption of 3 3 P in the source. Experience showed that 50-100 pimoles of stable P in the source optimized the total net count rate and mini-mized self-absorption of 3 3p for samples collected in the Sargasso Sea. Usually, for plankton samples obtained from 15-20-minute tows, the initial amount of stable P0.9 0.8 4 0.7 0. 44 0.5 -4 0.4 0.3 0.2 I I I I I i 0 2 4 6 8 10 12 14 Source thickness (mg/cm2) -A- 0.150 cm2/mg
--
r- 0.160 cm2/mg --- 0.145 cm2/mgFigure 1.5. Relative counting efficiency as a function of source thickness calculated for different values of the absorption coefficient
s.
exceeded 100
smoles
and the sample was split. For suspended particles, the samples had typically 30-60srmoles
of P04 initially and were thus never split.The data for all the rain samples and plankton samples are listed in Appendix A. The data include the equations of the regressions of the curves Nt and Na in tables A.1 (rain samples) and in table A.2 (plankton samples). The thickness, d, the yield, y, the counting efficiencies, 3 2 s and 33 E, and the counting rates at the time of sampling 3 2 N
and 3 3 N are given, for all the samples, in appendix A in tables A.3 for the rain samples,
in tables A.4 to A.9 for the plankton samples and in table A.10 for the salt samples (see chapter 3).
VII COUNTING STATISTICS AND ERROR ANALYSIS
The errors on the absolute initial activities 32 A0 and 3 3 A0 were computed for the time the sample was put in the counter. These activities are derived from the two experimental curves Gt (t) and G a(t) of the gross count rate of the source as a function of time expressed in equations (1.1) and (1.2).
1- Error on the net count rates
The curves N t(t) and Na (t) were fitted with a least square method and the 2 inter-cepts N a and N t were determined. The errors were given by the non-weighted least
a t
squares fit (samples are counted in time typically until each count in time is 300 or 500 for low count rate samples and 1000 or more for rain samples). 3 2 No is equal to (Go a~ B) /3 2
I
or N 0 /3 2 p. The error on 3 2N0 , a32 No was deduced from the propagation theory (Friedlander et al.,198 1). 3 2 N0 is a function of 3 2 0, Ga and B. Thus the stan-dard error is given by: