Credit Derivatives in Brazil
byHenrique Riither
B.S. Chemical Engineering, Escola Polit6cnica-USP, 1997 Submitted to the MIT Sloan School of Management In Partial Fulfillment of the Requirements for the Degree of
Master of Business Administration at the
Massachusetts Institute of Technology June 2007
©2007 Henrique Rifther. All rights reserved. The author hereby grants to MIT permission to reproduce
and to distribute publicly paper and electronic copies
of this document in whole or in part in any medium now known or hereafter created.
Signature of Author:
-Henrique Rihther MIT Sloan School of Management May 11, 2007
Certified by: >
~-Jun Pan Associate Professor of Finance Thesis Supervisor
Accepted by: __ ....
S Debbie H. Berechman Executive Director, MBA Program MIT Slnnn r•hnnl nf Mnnnaoemnt MASSACHUSETTS INSTITUTE OF TECHNOLOGY
JUL 0 2 207
LIBRARIES
ARCHIVES
yl _i_·lCredit Derivatives in Brazil
byHenrique Rither
B.S. Chemical Engineering, Escola Politecnica-USP
Submitted to the MIT Sloan School of Management on May 11, 2007 In Partial Fulfillment of the Requirements for the Degree of
Master of Business Administration ABSTRACT
The amounts outstanding of credit derivatives have grown exponentially over the past years, and these financial intruments that allow market participants to trade credit risk have become very popular in Europe and in the United States. Although the Central Bank of Brazil passed regulation in 2002 allowing the trade of credit derivatives in the domestic market, almost nothing happened in this arena, and the credit derivatives market in Brazil barely exists.
This thesis aims at investigating why such a market has not developed in one of the largest economies of the world. The thesis starts by explaining the mechanism of one of the most popular credit derivatives - the credit default swap (CDS). Then, since bonds and CDS are closely related, the thesis provides short descriptions of the Brazilian market for government issued bonds and corporate bonds. Subsequently we assess the Brazilian regulation for credit derivatives and start to find some reasons why the market has not been developed. We then approach a real life example of estimating the CDS premium for a local company using the no-arbitrage argument and compare the results with the premium of the offshore CDS available for the same company. We find that the credit rating upgrades do not explain the changes in the domestic credit spread for the chosen company. Moreover, we observe that the domestic credit spread behaved very differently from the offshore CDS for the same entity, what suggests that more research on this direction would be interesting. Subsequently we address the benefits and risks provided by credit derivatives and examine the current situation of the market for these financial instruments in Mexico and Korea.
We found that the Central Bank of Brazil imposed restrictions to some market participants in the credit derivatives market and allowed only two products to be traded: CDS and total return swaps. These restrictions, together with a not very liquid corporate bond market and the lack of reforms granting for example stronger rights to secured and unsecured debt holders may be the reason why the credit derivatives market did not flourish in Brasil.
Thesis Supervisor: Jun Pan
1. Introduction
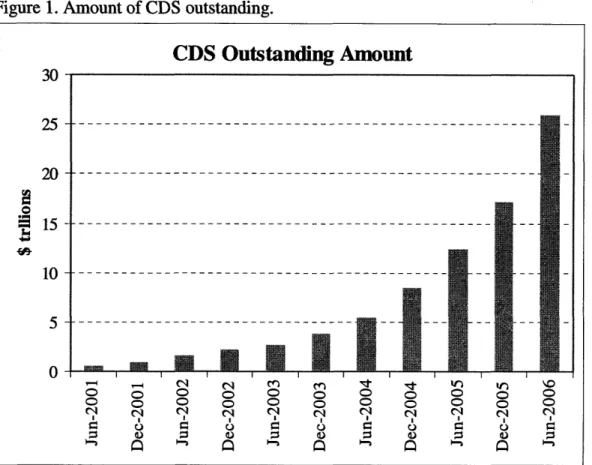
Credit derivatives allow market participants to manage credit risk in their portfolios without the need to sell or buy bonds or loans. One of the most popular credit derivatives is the credit default swap (CDS). In 2001 the total amount of CDS outstanding in the market was $919 billion, and only four years later, in 2005, this amount reached the impressive mark of $17 trillion'. The notional amount of CDS grew by 52% in the first six months of the year of 2006, reaching $26.0 trillion'. Prognostics for the amounts outstanding in the near future still assume high growth rates: the British Bankers Association (BBA) expects the global credit derivative market to expand from $20 trillion in 2006 to $33 trillion in 2008 2. Although the ISDA survey and the BBA report do not arrive at the same amount of CDS outstanding - the BBA report states for the year 2006 that 51% of the $20 trillion in credit derivatives are CDS - they share the same view: CDS and other credit derivatives will grow in importance for financial markets and amounts outstanding will continue to increase in the coming years.
Despite the fact that CDS and other credit derivatives are extremely important for the global markets, development of these financial instruments in some local markets has been negligible. Brazil, one of the largest economies in Latin America and a country with one of the most sophisticated financial systems in the world, implemented regulation for domestic credit derivatives in 2002. However, very few trades have been done since that year and the local credit derivative market barely exists. The regulation itself was not enough to stimulate the creation of a local market.
The objective of this thesis is to examine this situation more carefully, investigating the reasons why the market for local credit derivatives in Brazil has not flourished and advocating the advantages of a liquid credit derivative market for local market participants. We start by looking at the CDS mechanism and the market for CDS. Since credit derivatives and bonds are strongly related one to the other, we give short descriptions of the domestic markets for Brazilian government issued bonds and for
Market Survey, International Swaps and Derivatives Association - ISDA Credit Derivatives Report
corporate bonds. Subsequently we analyze the Brazilian regulation that addresses credit derivatives. We also try to price a domestic CDS for a local company and compare the results with the CDS traded in the international market for the same company. However, the low liquidity of the Brazilian corporate bond market and lack of data may limit the findings of this exercise. Finally we address the benefits and risks of credit derivatives and conclude by comparing the actual stage of credit derivatives in Brazil with the recent developments in the local markets from Mexico and Korea.
2. The Credit Default Swap (CDS)
2.1. How it works
In a typical CDS two parties - the credit protection buyer and the credit protection seller - agree that the protection buyer will pay the seller an annuity - the credit swap spread or premium - until there is a specific credit event by the reference entity or the CDS reaches maturity. In case of a credit event by the reference entity, the protection buyer discontinues the annuity payments, pays the accrued premium until the credit event date and sells the bond - the reference obligation - to the credit protection seller for the par value. Credit events that may trigger a CDS include, but are not limited to, bankruptcy, default, failure to pay, acceleration, moratorium and restructuring. The CDS premium is quoted as a percentage of the notional value of the reference obligation and the buyer is expected to pay it annually, usually in quarterly or in semi-annual installments.
To better illustrate how a CDS works, we will use the example provided by Longstaff (2003): on January 23, 2002 the credit protection buyer whishes to buy five years of protection against the default of 10,000 Worldcom 7.75% bonds maturing April 1, 2007 - the reference obligation. The bonds have a face value of $1,000 and the ask price for the 5-year CDS is 169 basis points considering quarterly payments. The buyer decides to purchase the credit protection for his total notional amount of $10,000,000.
Consequently, 90 days later, on April 23, 2002 the buyer will pay the seller 90/360 *
0.0169 * $10,000,000 = $42,250. The next payment the buyer will have to make would be of $42,719.443 (= 91/360 * 0.0169 * $10,000,000) on July 23, 2002. However, Worldcom - the reference entity - filed for bankruptcy on July 21, 2002. Therefore, the buyer pays the seller $41,780.56 (= 89/360 * 0.0169 * $10,000,000) - the accrued premium from April 23 to July 21 - and delivers the 10,000 bonds in exchange for a payment of $10,000,000 from the seller4. It is worth mentioning that in a typical CDS, although the buyer pays the accrued premium until the credit event date, the seller purchases the defaulted bonds for the face amount without accrued interest.
The settlement of a CDS may be the physical delivery of the reference obligation
- as illustrated above - or a set of bonds or loans, provided both parties agreed on that. The deliverable obligations are usually specified in the contract. As mentioned by Longstaff (2003) the contract may specify cash settlement. In this case the cash settlement amount would be the difference between the notional amount and the market value of the reference obligation polled from bond dealers or a predetermined fraction of the notional amount. In some circumstances, as in the sovereign CDS market, physical delivery is the predominant form of settlement because both buyers and sellers of protection prefer to avoid the dealer polling process of the price of the reference obligation in very illiquid market conditions that usually follow a credit event, as mentioned by Pan (2006).
2.2. The CDS market
The notional CDS outstanding amount showed an impressive growth in the recent years. Growth rates averaged 46% every six months, as can be seen in the graph below.
3 The amount is higher because there are 91 days between April 23 and July 23, 2002.
4 The payment can also be the difference between the face value and the market value of the reference
Figure 1. Amount of CDS outstanding.
Source: Market Survey, International Swaps and Derivatives Association - ISDA
According to the Bank for International Settlements (BIS), from a total of $20.4 trillion of CDS5, 68% ($13.9 trillion) are single-name instruments, i.e. have a single reference entity. The remaining 32% ($6.5 trillion) are considered multi-name instruments. From the single-name CDS, 8% ($1.1 trillion) have maturity up to one year, 67% ($9.3 trillion) have maturity between one and five years and the remaining 25% ($3.5 trillion) have maturity longer than five years. Regarding the reference entity, 78% ($10.9 trillion) of the single-name CDS are from corporations or banks while 22% ($3.0 trillion) are from sovereigns. In terms of the credit grade of the reference obligations, 67% ($9.3 trillion) are investment grade, 14% ($2.0 trillion) are below investment grade and 18% ($2.5 trillion) are non-rated.
According to the BBA Credit Derivatives Report 2002, the commercial banks are the most active market participant in the CDS market, being responsible for 52% of the
5 over-the-counter (OTC) derivatives market activity in the first half of 2006.
CDS Outstanding Amount
J3 25 20 l15 10 5 0 o ~0 0 0 0 0 0 0 0 0 0 0 0 0 0 0 0 Cl l C l C l C Cq Cl Cl Cl r. I I oC ; os 0 0 0 o ý3 (purchased amount of credit protection and 39% of the sold amount, resulting in a net purchase of 13% of the total amount. Investment banks appear next, with 21% purchased, 16% sold and 5% net. Since banks usually hold big credit portfolios and are the ones who most benefit from the fact that CDS enables them to manage credit risk without having to sell assets, thus avoiding damages to relationships with clients, it is not a surprise that banks are the most active participants in this market. The table below provides further
detail about the other market participants.
Table 1 - Credit protection purchased and sold in terms of the total amount of CDS outstanding.
Market Participant credit protection credit protection Net
Market Participant Net
purchased sold Commercial banks 52% 39% 13% Investments banks 21% 16% 5% Hedge funds 12% 5% 7% Insurance companies 6% 33% -27% Corporations 4% 2% 2% Pension funds 3% 5% -2% Government agencies 2% 0% 2% Total 100% 100% 0%
Source: BBA Credit Derivatives Report 2002
It is worth to highlight the important role of the insurance companies in the CDS market: they are the first net seller of credit protection with 27% of the total amount. The hedge funds, although not having such a big net exposure in CDS in 2002, became very active in this market. According to a study by consulting firm Greenwich Associates (Wall Street Journal, 2006) credit derivatives are very popular with hedge funds, which were responsible to more than 55% of the traded volume. Clearly insurance companies and hedge funds have significant importance in supplying credit protection and in providing liquidity for the CDS market.
As mentioned before, there is no CDS in the Brazilian domestic market. In the international market, CDS whose reference entities are Brazilian corporations have low liquidity. However, it is possible to get indicative quotes from trading desks and from the Bloomberg system for names such as Petrobrais and CVRD. On the other hand, sovereign
CDS from Brazil are very liquid (Raciere, 2002 and Chan-Lau, 2004), being one of the most traded among the emerging markets.
3. The Brazilian Bond Market
3.1. Government issued bonds
According to the Central Bank of Brazil on March 1 6th, 2007 there were R$1.1
trillion ($528.7 billion) worth in treasury bills and bonds in the Brazilian local market. Together, the floating-rate bills - LFT - and the fixed-rate bills - LTN - comprise the majority of that amount: R$436 billion (39.4%) and R$338 billion (30.6%), respectively. The other 30% of public debt is comprised mainly of inflation linked bonds - NTN-B and NTN-C - and fixed-rate bonds - NTN-F. There are R$178 billion (16.1%) of NTN-B, linked to the IPCA6, R$65 billion (5.9%) of NTN-C, linked to the IGP-M7, and R$73
billion (6.6%) of NTN-F. Approximately R$16 billion (1.4%) of the total public debt in the market consists of bonds that were issued in the past but have not been issued recently, such as NTN-A, NTN-D, NTN-I, NTN-M and NTN-P. Roughly 52% of the public debt is due in less than two years and 81% has less than four years to maturity. The Brazilian public debt has short term, especially the fixed-rate portion of it - the LTN. The table below provides an indication of the public debt maturity profile and composition.
6 IPCA - Extended National Consumer Price Index -has as its target population families whose monthly income ranges from 1 to 40 minimum salaries. IPCA is used by the Central Bank of Brazil in order to monitor objectives set in the inflation target system.
Table 2. Public Debt in the Brazilian Market
Type of bill or bond (values in R$ millions as of March 16 ", 2007)
Maturity LTN LFT NTN-B NTN-C NTN-F other Total
2007 153,171 141,946 9,543 3,005 307,666 27.8% 2008 134,580 108,741 12,178 14,827 3,444 1,552 275,323 24.9% 2009 50,692 90,366 43,072 319 184,449 16.7% 2010 56,471 34,813 37,255 175 128,714 11.6% 2011 24,815 22,102 3,709 294 50,921 4.6% 2012 7,204 22,730 464 30,399 2.8% 2013 4,606 2,221 379 7,205 0.7% 2014 1,501 6,220 347 8,070 0.7% 2015 305 19,450 122 19,877 1.8% 2016 46 45 0.0% 2017 6,390 3,022 23 9,436 0.9% 2018 17 17 0.0% 2019 6 6 0.0% 2020 3 3 0.0% 2021 13,197 49 13,246 1.2% 2022 0 0 0.0% 2023 792 0 792 0.1% 2024 7,674 8,793 16,467 1.5% 2031 26,600 0 26,600 2.4% 2033 9,887 0 9,887 0.9% 2035 3,639 0 3,639 0.3% 2045 12,561 0 12,561 1.1% TOTAL 338,443 435,956 177,932 64,722 72,673 15,594 1,105,321 100.0% 30.6% 39.4% 16.1% 5.9% 6.6% 1.4% 100.0%
Source: Central Bank of Brazil
Once a week the Brazilian National Treasury carries out auctions of LTN, NTN-F and, sometimes, LFT. Auctions of NTN-B and NTN-C usually occur once a month, a couple of days before the 15th of each month and at the end of the month, respectively. However, NTN-C auctions are rare nowadays, and the Brazilian Treasury is putting more emphasis on the NTN-B instead of the NTN-C. Whenever necessary, the Treasury holds purchase and exchange auctions to level the liquidity in the market, to smooth the impact of the maturity of a bill or bond and/or to provide price level for the market participants.
Custody System, managed by the Central Bank of Brazil. SELIC also performs the settlement of all public debt auctions.
In addition to the public debt auctions, SELIC does also the settlement of the secondary market trades involving public debt, which occur in a delivery-versus-payment basis. Public debt is traded over-the-counter and through two main trading platforms: CETIP and SISBEX. CETIP is Center for Custody and Financial Settlement of Securities and SISBEX is the trading system provided by the Brazilian Mercantile and Futures Exchange - BM&F. The former is more present in broker houses and banks' trading desks while the latter can be found in banks' trading desks as well as in pension funds.
3.2. Corporate issued bonds
According to ANDIMA (1998) and Leal (2006) the corporate bond market in Brazil can be divided in four phases of development. The first phase starts in 1882 and goes to 1965. During this period bankruptcy law was introduced and a strong corporate bond market could have started if inflation had been under control. High inflation rates in the 1950s put an end to the incipient bond market. In the period from 1965 to 1976 - the second phase - major changes in local financial markets regulations and a new law allowing the issuance of bonds linked to inflation, made the corporate bond market feasible. During the third phase, from 1976 to 1993, the Securities Commission was created and new laws addressing the capital markets and public companies in general were introduced. The new laws allowed the issuance of different kind of bonds such as subordinated, warrants, with or without collateral and denominated in foreign currencies. The corporate bond market developed as much as it could, given that high inflation was always present and holding down the progress of the market. Anderson (1999) presents more details about this period. In 1994, with the introduction of the Real stabilization plan, the Brazilian corporate bond market entered its current phase. According to Leal (2006) new securities commission rules and simplified standard bond treaty and tax law changes are in discussion, with the objective of improving the liquidity of the secondary market for domestic corporate bonds.
Leal (2006) classifies the Brazilian corporate domestic debt in four types: debentures, commercial papers, mortgage-backed securities and funds composed by receivables. This thesis focus on debentures, a very traditional debt instrument and the most issued and traded in local markets.
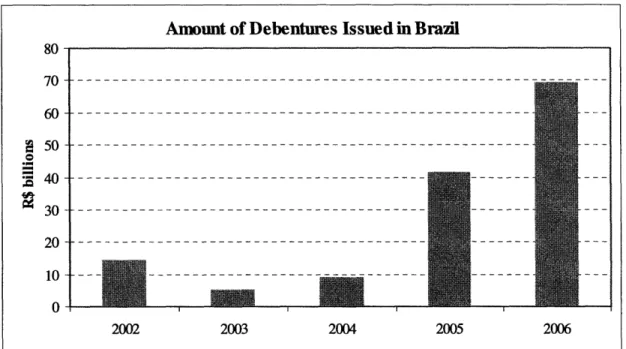
After a decrease from R$14.6 billion in 2002 to R$5.2 billion in 2003, the total amount of debentures issued in the local market increased year after year, exceeding R$70.0 billions in 2006. The yearly growth rate of the amount of debentures issued during the last years is impressive - 362% from 2004 to 2005 and 70% from 2005 to
2006.
Figure 2. Amount of debentures issued in Brazil.
Source: ANBID, Boletim de Mercado de Capitais, December 2006
Banks act as coordinators of the book building process which determines the yield of the debenture. According to ANDIMA (2006) 95% of the debentures issued in 2006 are linked to the rate of interbank certificate of deposit - CDI, 3% linked to the USD and 2% liked to inflation index (IGP-M). ANBID (2006) shows that the maturity of the debentures issued increased from less than 3 years in 2003 to more than 8 years in 2006.
Amount of Debentures Issued in Brail
70- 60-5 60- 50- 40- 30-20 -10 - 0-2002 2003 2004 2005 2006 ~" ~~"~""~
---
----
---
---
---
----
---
---
---Financial institutions and utilities (electric) were responsible for 61% and 12% of the debentures issued in 2006, respectively.
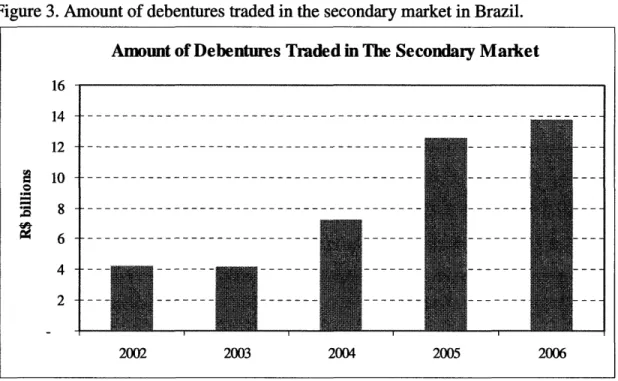
CETIP and CBLC8 do the settlement of the secondary market trades involving corporate debt, which occur in a delivery-versus-payment basis. Regarding trading platforms for the secondary market, both CETIP and BOVESPA - Sho Paulo Stock Exchange - offer trading systems for corporate debt, and some Brazilian banks are using Bloomberg to show indicative prices. However, the largest traded amount is done over-the-counter. According to www.debentures.com.br, the volume of debentures traded in the secondary market followed the same trend from the primary market: it increased dramatically in the last years, from R$4.1 billion in 2003 to R$13.8 billion in 2006. Although the volume of debentures traded showed a sharp increase, it is still well below the traded volume for the public debt - R$16.0 billion for the month of December 2006 and R$138.2 billion for the whole year of 2006. (See Tesouro Nacional, 2006).
Figure 3. Amount of debentures traded in the secondary market in Brazil.
Source: www.debentures.com.br
8 CBLC - Brazilian Clearing and Depository Corporation - is also responsible for the settlement of stock trades conducted in the BOVESPA - Sdo Paulo Stock Exchange.
Amount of Debentures Traded in The Secondary Market
10 -14 -12 -2 10 -10 PC
8-6
4-2 2002 2003 2004 2005 2006 ~---I -- -- - ---- --- · --- - -- -- -- -- -- -- -- - --- -- --- - -- - --- -- -- --- -- -- - -- -- --- -- -- -- - -- -- -- -- -- -- -- - --- -- -- --- - -- - -- -- --- -- -- -- -__ -2002 2003 2004 2005 2006In addition, there is no short selling of corporate bonds in Brazil, therefore the operational aspect of the hedge for a CDS position is more difficult than in the US or European markets, where short selling of bonds is available.
4. The Brazilian Regulation for Credit Derivatives
In 2002 the Central Bank of Brazil published Resolugdo 2.933/02, Circular 3.106/02 and Carta-circular 3.073/02 authorizing the use of credit derivatives in the domestic market and specifying what kind of credit derivatives were allowed and which market participants would be able to use them. In addition, the Central Bank also specified how the credit derivatives would impact the capital requirement for local financial institutions to operate in Brazil.
The Resolu!do 2.933/02 describes clearly which market participants are allowed to sell and to buy credit protection through the use of credit derivatives and which assets may be considered reference obligations. Commercial and investment banks, real estate, credit and financing companies and leasing companies are allowed to sell credit protection (i.e. buy credit risk). However, the leasing companies may only sell protection if the underlying asset has been originated from leasing activity. The buying of credit protection is less strict and, in addition to the institutions mentioned above, corporations, pension funds, mutual funds and hedge funds are eligible to buy credit protection. However, if the reference obligation is not regularly traded and its price cannot be observed in the market, the protection buyer has to own the reference obligation, may not sell it or rent it and is not allowed not buy more protection than the existing amount of the reference obligation in its portfolio. Loans, securities, financial or commercial contracts with credit risk and credit derivatives found in the domestic markets are eligible to be reference obligations for credit derivatives contracts. In addition, the Central Bank requires the buyer and seller of credit protection to register the credit derivatives with an institution authorized for that end, such as BM&F or CETIP.
The Circular 3.106/02 provides more details about the credit derivatives. Among several issues addressed in this document it asserts that the credit derivatives allowed in the domestic market are only the CDS and total return swap (TRS) and that it is forbidden to write options on such swaps. Moreover, the CDS and the TRS should be denominated in the same currency and/or index as the reference obligation. The Circular also defines, but does not limit, some credit events that should be in the scope of the CDS and the TRS.
Finally, the Carta-circular 3.073/02 provides information about the registration and accounting procedures to be taken by financial institutions when dealing with credit derivatives.
Comparing a hypothetical market for credit derivatives in Brazil (Brazilian market) given the regulation discussed above with the markets for credit derivatives that exists in the United States and Europe it is possible to note some striking differences regarding the kind of credit derivatives that may be traded, market participants, restrictions to buy and to sell credit protection and registration of the credit derivatives.
In the Brazilian market only CDS and TRS are allowed, while in developed markets it is possible to find CDS, TRS, Credit Linked Notes (CLN), Collateralized Debt Obligation (CDO), Collateralized Loan Obligations (CLO), synthetic CDO, Credit Default Swaption, CDS Index, CDS Index options among other credit derivatives. Consequently, the market participants in Brazil have limitations concerning structuring deals and trades that involve credit derivatives as well as hedging their credit portfolios.
Only financial institutions are allowed to sell credit protection in the Brazilian market, while hedge funds, insurance companies and pension funds may do so in developed markets. Due to the low number and diversity of credit protection sellers in the Brazilian market, liquidity tends to be much lower than in the developed countries.
Market participants in Brazil suffer restrictions in buying credit derivatives, such as owning the reference obligation and not being allowed to sell it during the life of the CDS. As a result, speculators are left out of the market and liquidity tends to be low.
In developed markets CDS trades are over-the-counter and the registration is responsibility of both the buyer and the seller, while in Brazil the CDS or TRS has to be registered with an institution authorized by the Central Bank, such as CETIP and BM&F. As a consequence the credit derivatives traded in Brazil tend to be less flexible and participants may lack the proper instruments to address their specific needs.
5.
Pricing a CDS for the Brazilian Domestic Corporate Market
One way to price a CDS is by using other traded instruments9(Duffie, 2003). Under the no-arbitrage argument and assuming that:1. There are par bonds issued by the reference entity - the reference obligation - and by a default-free entity with the same maturity and coupon dates.
2. There are no transaction costs, such as bid-ask spreads, when buying or selling bonds.
3. There are no costs associated with short selling bonds and investors can short the reference obligation and/or the default-free bond.
4. The parties involved in the CDS transaction - the buyer and the seller
-are default-free.
5. Interest rates are constant and par bonds stay par bonds.
6. In the case of a credit event, all the payments and bond exchanges occur immediately following the coupon date of the reference obligation, including the coupon payment of the defaulted bond.
7. There are no taxes.
Another way to price a CDS involves using a default intensity-based model - as explained by Duffie (2003) and employed by Logstaff (2003).
An arbitrageur could profit if the yield from a par bond issued by the reference entity minus the CDS spread is significantly different from the yield of a par Treasury of the same maturity.
Suppose and investor short sells the par reference obligation and with the proceeds buys the default-free par bond. If there is no credit event, on the coupon dates the investor will have to pay the coupon on the reference obligation (c) and will receive the coupon of the default-free par bond (crf). Since c is greater than crf, the net payment s is the spread of the reference obligation over the default-free bond (s = c - crf). In case of a credit event occurring before maturity, the investor liquidates the portfolio immediately after the coupon date, collecting 100 after selling the default-free par bond, purchasing the reference obligation for its market value V, receiving a net amount of 100-V. The investor's portfolio is a synthetic CDS, analogous to a long position on a CDS in which the premium is s. If there is a bid quote for a CDS on the reference obligation (Sm) higher than s, the investor could sell the CDS for Sm and build a portfolio as described - long in the default-free par bond and short on the par reference obligation - and the result would be a series of cash flows equal to (s,, - s) until maturity or a credit event. Therefore, if there is no arbitrage for the protection seller and buyer, sm, should be equal to s and s =
(y-rf), where y is the yield of the par reference obligation and rf is the yield of the par default-free bond.
As showed above, the credit spread - the spread of the reference obligation on the default-free bond - can, under certain assumptions, provide us the premium of the CDS. Building on that, we will use this approach to estimate the CDS premium for a domestic Brazilian bond issued by a local company. The company chosen is Petrobrais (NYSE: PBR), the Brazilian oil company with revenues of more than $55 billion in 2005, "engaged in the exploration, exploitation, and production of oil from reservoir wells, shale, and other rocks. The company supplies oil, liquefied natural gas, and natural gas to
,10
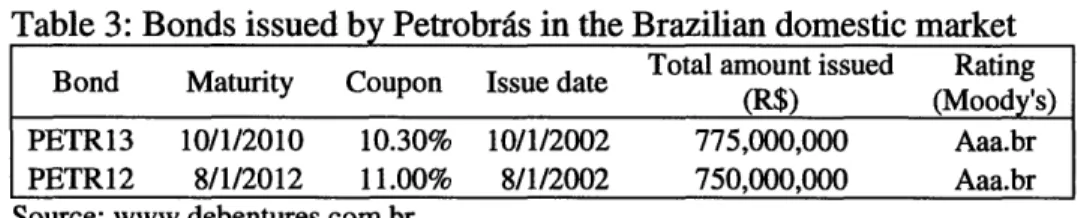
refineries in Brazil, as well as sells surplus production in Brazil and foreign markets" l The table below shows the bonds that Petrobris has issued in the domestic market.
Table 3: Bonds issued by Petrobras in the Brazilian domestic market Total amount issued Rating Bond Maturity Coupon Issue date Total amount issued Rating (R$) (Moody's) PETR13 10/1/2010 10.30% 10/1/2002 775,000,000 Aaa.br PETR12 8/1/2012 11.00% 8/1/2002 750,000,000 Aaa.br Source: www.debentures.com.br
Both PETR12 and PETR13 are linked to the IGP-M, have annual coupon payments and had face value of R$1,000.00 on the issue day. ANDIMA, the National Association of Financial Market Institutions, collects and provides information regarding debentures in Brazil, including indicative prices and secondary market data. During 2006 ANDIMA recorded 226 trades for PETR13 in 86 days and 226 trades for PETR12 in 33 days. In order to avoid using information that may not represent actual market prices and yields, we considered only the days when notional amounts greater than R$ 1 million were traded. Consequently, our sample is comprised of 19 days of trading for PETR13
and 24 days of trading for PETR12 with the respective average prices of the bonds in those days. The sample includes 4 days in 2006 when both PETR12 and PETR13 traded. We then used the bond prices to compute the yields to maturity of both bonds for the
sample.
The next step was to compute the yield of the default-free bond. The most obvious choice for the IGP-M-risk-free rate is the zero curve provided by bootstrapping the NTN-C yields, since bonds issued by a government in its own currency have no credit risk and their yields can be used to derive a risk-free curve. However, factors such as liquidity, taxation and regulation can affect the yield on bonds (Hull, 2004), and this applies to the Brazilian market as well, where banks are required to hold a lower amount of capital when keeping treasury bonds than the amount required when keeping corporate bonds or loans, and banks and pension funds in Brazil may use local treasury bonds to fulfill many regulatory requirements, such as compulsory deposits at the Central Bank. In addition to the yield issue for treasury bonds, the credit default swap market appears to use the swap rate as the risk-free rate (Houweling and Vorst, 2002) and the risk-free swap rate provides a better fit to CDS spreads and bond yields than the risk-free treasury rate
(Hull, 2004). With that in mind we decided to use the DI x IGP-M11 swap zero curve provided by BM&F as the free yield curve to compute the yield of a synthetic risk-free bond.
The bonds yields and respective synthetic risk-free bonds derived from the swap curve as well as the theoretical CDS spread (s) are showed below.
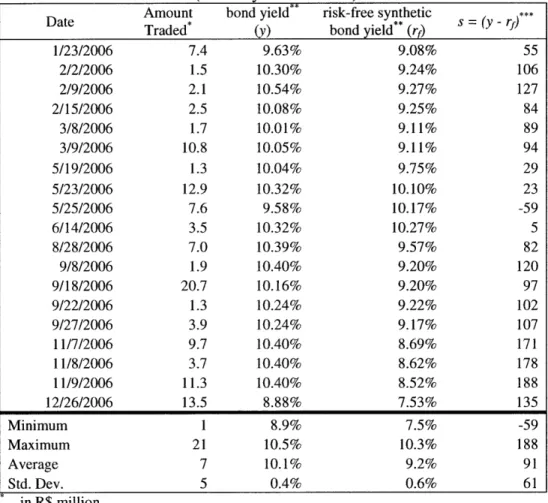
Table 4: Data for PETR13 (maturity: 10/01/2010).
Amount bond yield** risk-free synthetic ***
Date Traded* (y) bond yield** (rf) s = (y - rf)
1/23/2006 7.4 9.63% 9.08% 55 2/2/2006 1.5 10.30% 9.24% 106 2/9/2006 2.1 10.54% 9.27% 127 2/15/2006 2.5 10.08% 9.25% 84 3/8/2006 1.7 10.01% 9.11% 89 3/9/2006 10.8 10.05% 9.11% 94 5/19/2006 1.3 10.04% 9.75% 29 5/23/2006 12.9 10.32% 10.10% 23 5/25/2006 7.6 9.58% 10.17% -59 6/14/2006 3.5 10.32% 10.27% 5 8/28/2006 7.0 10.39% 9.57% 82 9/8/2006 1.9 10.40% 9.20% 120 9/18/2006 20.7 10.16% 9.20% 97 9/22/2006 1.3 10.24% 9.22% 102 9/27/2006 3.9 10.24% 9.17% 107 11/7/2006 9.7 10.40% 8.69% 171 11/8/2006 3.7 10.40% 8.62% 178 11/9/2006 11.3 10.40% 8.52% 188 12/26/2006 13.5 8.88% 7.53% 135 Minimum 1 8.9% 7.5% -59 Maximum 21 10.5% 10.3% 188 Average 7 10.1% 9.2% 91 Std. Dev. 5 0.4% 0.6% 61 in R$ million
per annum, 252 business days per year, basis points
daily capitalization
11 DI is the equivalent for the overnight LIBOR in the Brazilian local market and, as the DI x IGP-M swap, the PETR12 and PETR13 bonds, it is quoted in percent per annum considering 252 business days per year with daily capitalization.
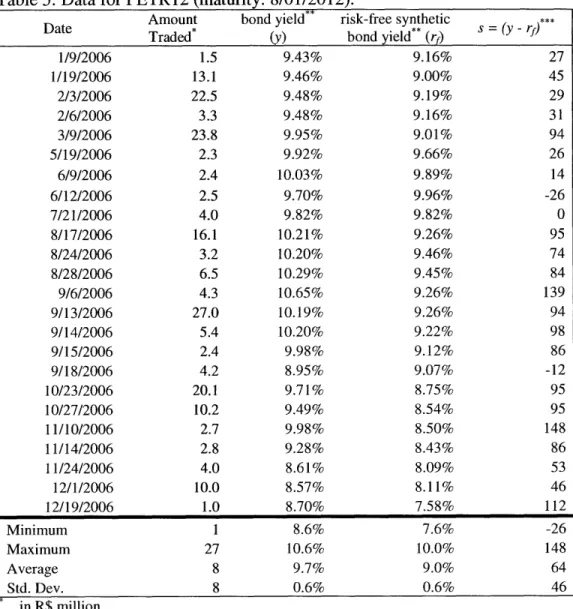
Table 5: Data for PETR12 (maturity: 8/01/2012).
Amount bond yield** risk-free synthetic ***
Date Traded (y) bond yield** (rf) = (- rf)
1/9/2006 1.5 9.43% 9.16% 27 1/19/2006 13.1 9.46% 9.00% 45 2/3/2006 22.5 9.48% 9.19% 29 2/6/2006 3.3 9.48% 9.16% 31 3/9/2006 23.8 9.95% 9.01% 94 5/19/2006 2.3 9.92% 9.66% 26 6/9/2006 2.4 10.03% 9.89% 14 6/12/2006 2.5 9.70% 9.96% -26 7/21/2006 4.0 9.82% 9.82% 0 8/17/2006 16.1 10.21% 9.26% 95 8/24/2006 3.2 10.20% 9.46% 74 8/28/2006 6.5 10.29% 9.45% 84 9/6/2006 4.3 10.65% 9.26% 139 9/13/2006 27.0 10.19% 9.26% 94 9/14/2006 5.4 10.20% 9.22% 98 9/15/2006 2.4 9.98% 9.12% 86 9/18/2006 4.2 8.95% 9.07% -12 10/23/2006 20.1 9.71% 8.75% 95 10/27/2006 10.2 9.49% 8.54% 95 11/10/2006 2.7 9.98% 8.50% 148 11/14/2006 2.8 9.28% 8.43% 86 11/24/2006 4.0 8.61% 8.09% 53 12/1/2006 10.0 8.57% 8.11% 46 12/19/2006 1.0 8.70% 7.58% 112 Minimum 1 8.6% 7.6% -26 Maximum 27 10.6% 10.0% 148 Average 8 9.7% 9.0% 64 Std. Dev. 8 0.6% 0.6% 46 in R$ million
per annum, 252 business days per year, daily capitalization basis points
The datasets form PETR13 and PETR12 have similar minimum, maximum and average values for the amount traded, only the standard deviation is higher for the PETR12. We observed negative values for the theoretical CDS spread - s - three times, twice for PETR12 and once for PETR13. These negative values do not make sense, since under normal circumstances the synthetic risk-free bond should always have the lowest yield. One possible reason for these negative values could be the fact that the data from the bonds are average prices from the trades that took place during those specific days, while the DI x IGP-M swap is built with data from the very end of the day. The average
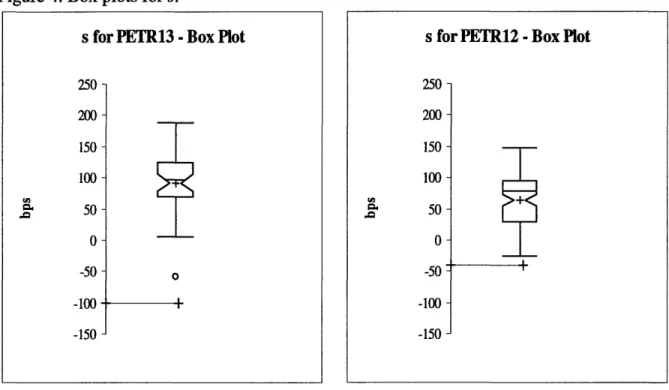
value of s was higher for PETR13 (91bps) than for PETR12 (64bps). We hadn't expected the bond with longer maturity to have a lower average value for s; however, the standard deviations are high, what might explain this apparent "inverted CDS term structure". A closer look at the data, using box plots, seems to give the impression that s is higher for PETR13 than for PETR12.
Figure 4. Box plots for s.
s for PETR13 - Box Plot
25U - 200- 150- 100-S 5 0- -50- -100-~10n
-On the other hand, the data we are looking at involves mainly values of s for different days when PETR12 or PETR13 were traded. The comparison between the values of s would allow us to draw more conclusions if we had data from the days when both bonds were traded. The sample comprises only four of such days, and it is worth
looking more carefully at these dates:
0
s for PETR12 -Box Plot
250 200 150 100- 5 0-0 -50 -100 -150 + -, ,
Table 6. Data for PETR12 and PETR13 on selected dates.
PETR12 PETR13
Date Yield Amount Traded s Yield Amount Traded s
(R$ million) (bps) (R$ million) (bps)
3/9/2006 9.95% 23.8 94 10.05% 10.8 94
5/19/2006 9.92% 2.3 26 10.04% 1.3 29
8/28/2006 10.29% 6.5 84 10.39% 7.0 82
9/18/2006 8.95% 4.2 -12 10.16% 20.7 97
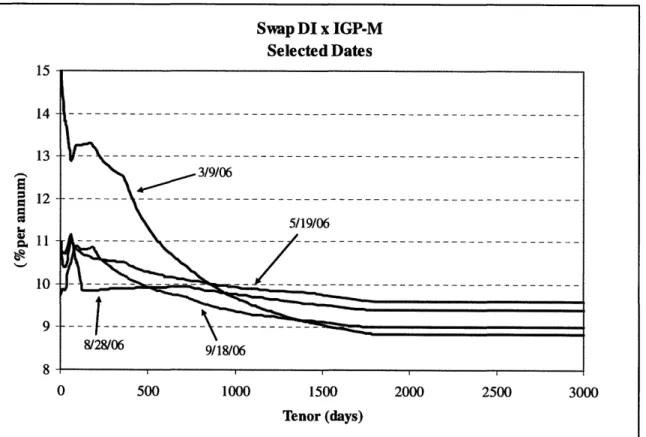
The fact that PETR12 - the longer maturity bond - shows yields of PETR13 can be explained by the inverted term structure of the DI x these four dates (see figure below).
Figure 5. Term structure of the DI x IGP-M swap on selected dates.
lower than those IGP-M swap on
Source: BM&F.
Among these data observed on the four different days, on one day the value of s
was the same for both bonds, 94bps. On another day PETR12 showed a value of s 3bps lower than that of PETR13. On 8/28/06 the opposite happened: PETR13 showed a value of s 2bps lower than that of PETR13. And finally, on 9/18/06 PETR12 showed a negative
value of s, what makes any comparison meaningless on this specific date. Consequently, the data from these four dates suggest that one could argue that the term structure for s
between the maturities from PETR13 (10/1/2010) and PETR12 (8/1/2012) is flat. However, the low number of data points prevents us from asserting that.
6. Analyzing and Comparing the Domestic and the Offshore CDS
Bloomberg provides quotes for the USD denominated 5-year CDS for Petrobrais, which is a CDS traded offshore Brazil that has the same characteristics as a CDS for an American company traded in the United States. The data starts in 3/17/2006 and provides us quotes for 70 days during the year 2006. The table gives the some key statistics from these data and from the s computed for PETR12 and PETR 13.
Table 7. Statistics from the USD CDS and s for PETR12 and PETR13.
USD 5-year CDS s - PETR12 s - PETR12* s - PETR13 s - PETR13*
Minimum 43 -26 14 -59 5
Maximum 160 148 148 188 188
Average 76 64 75 91 104
Std. Dev. 26 46 38 61 49
not considering the data points where s was less than or equal to zero.
Both maximum and minimum values for the USD CDS are closer to the average value of the series when compared to the s from PETR12 and PETR13, and the standard deviation is lower for the USD CDS than for the s from the local bonds. If we do not include the s values that where equal to or below zero - as we mentioned, such values do not make much sense - the average USD CDS gets very close to the s from PETR12. But again, it is tough to draw conclusions comparing average values computed from data originated from different trade dates. The figure and table below provide a closer look at these data.
Figure 6. Data from USD 5-year CDS and s from PETR12 and PETR13
Source: Bloomberg, UBS.
Table 8. Data from USD 5-year CDS and s from PETR12 and PETR13 on selected dates. USD CDS s - PETR12 s - PETR13 b) (ac)
(a) (b) (c) (ab) (ac)
5/23/2006 130 23 107 6/9/2006 160 14 146 6/14/2006 150 5 145 8/24/2006 63 74 -12 9/6/2006 75 139 -64 9/8/2006 60 120 -60 9/13/2006 66 94 -28 9/14/2006 68 98 -31 9/22/2006 73 102 -30 9/27/2006 71 107 -36 10/23/2006 58 95 -38
The figure above shows disperse data points from s around and mainly above the USD CDS for Petrobris. During the days when the USD CDS for Petrobris and PETR12 or PETR13 were traded (table 8), the value of the USD CDS was more than 100bps higher than s for PETR12 and PETR13 in the end of May 2006 and beginning of June 2006. After August the USD CDS was between 12 and 64bps lower than the values of s.
Comparing the USD CDS for Petrobris with the 3-year and 5-year sovereign CDS for Brazil, it is possible to notice that the 5-year CDS from Petrobrdis tends to be closer to the 3-year sovereign than to the 5-year one. Only during May 2006 the USD CDS for Petrobris was closer to the 5-year sovereign, and this can be explained by an increased aversion to emerging market risk during this period, as discussed by Pan (2006). In sum, the data throw some doubts regarding how well the s values for PETR12 and PETR13 represent a measurement of the domestic CDS for Petrobris.
Looking at the data on figure 6 also raises three questions:
1. What drives the value from s- the credit spread- for PETR12 and PETR13? 2. What drives the difference between s for PETR12 and PETR13 and the USD
CDS for Petrobris?
3. Why is the USD 5-year CDS for Petrobris lower than the 5-year sovereign CDS for Brazil?
To address these questions we decided to consider the whole dataset comprised of all 86 and 33 days when PETR13 and PETR12 were traded, respectively, regardless of the amount traded. We put more focus on PETR13 because of the higher number of data points. We believe that the benefits from the extra information and the following analysis will overcome the noise in the data brought by the low amounts traded in certain days.
6.1. What drives the value from
s -
the credit spread?
The difference between the yield of a local currency government bond - or a synthetic risk-free bond - and the yield of a corporate bond with the same coupon and maturity represents the premium demanded by investors to bear the credit risk of the corporate bond issuer. According to Longstaff (2004), this difference - the credit spread
- is in majority explained by compensation due to default risk. However, in some cases the credit spread was more than eight times the expected loss from default (Amato, 2003).
The credit spread is expected to change when the credit risk perceived by investors varies (e.g. upgrades or downgrades by rating agencies), when the state of the economy changes (e.g. credit spreads tend to widen during recessions and to shrink during expansions), and when investors' risk aversion changes (e.g. the higher the risk aversion, the higher the credit spread).
Figure 7 gives us more details about the behavior of the credit spread from PETR13 and PETR12 and the major credit rating changes for Petrobrnis during 2006. Although there were two credit rating upgrades from Moody's and two other from Fitch for Petrobris during 2006, none of them seem to have affected the credit spread for PETR13 and PETR12, as can be seen in figure 7.
Figure 7. Risk-free yields for the synthetic bonds equivalent to PETR13 and PETR12, respective credit spreads and main credit rating changes.
We ran multiple linear regressions where s was the dependent variable and the independent variables were four dummy variables for the credit rating upgrades (see regressions #1-4 in appendix A). We also added the risk-free yield for the bond as independent variable in two other regressions. The high p-values - from 0.26 to 0.83
-for the upgrade dummies in both PETR13 and PETR12 regressions where the risk-free yield was an independent variable suggest that the changes in credit rating do not explain the changes in the credit spread. We also observed high p-values for the credit rating upgrade dummies in the regression of s for PETR12 when they were the only independent variables. For the regression of s for PETR13 where the credit rating upgrade dummies were the only independent variables - regression #2 - the p-values for credit upgrade 1 and credit upgrade 4 were 0.0070 and 0.0045, respectively. However, the coefficient for credit upgrade 4 was positive, what suggests that the last credit rating
PETR13 and PETR12 -Risk-Free Yields and Credit Spreads (s)
11.0% 1000 10.0% --- -- --- 800 S9.0% ---- --- 600 7.0% ...-- - -- 200 6.0% 5.0% -... ...- 200
- risk-free synthetic bond yield for PETR13 -yield 1 -BB+ (Senior Unsecured debt -FITCH) * risk-free synthetic bond yield for PETR12 -yield 2 - Ba2 (LT Corp Family Rating -Moody's)
*-- s for PETRI3 - bps 3 - BB+ (LT FC Is suer Deafult -FITCH) * s for PETRI2 -bps 4 - Bal (LT Corp Famrily Rating -Moody's)
upgrade increased the value of s for PETR13 -i.e. the credit risk perceived by investors increased - what goes against what we expected. Consequently, the high p-values and the fact that the credit rating upgrade dummies showed coefficients that the were both negative and positive in different regressions prevent us from relying on the regression results to explain the behavior of s for PETR12 and PETR13. The fact that both PETR12 and PETR13 have the highest credit rating for domestic Brazilian corporate bonds from Moody's - Aaa.br - may explain why the credit rating changes mentioned before did not play a significant role in explaining the behavior of s.
In order to verify if changes in the state of the economy could explain the changes of s, we used an approach similar to the one used by Lamdin (2003): we ran a regression of s for PETR1312 and the employment data from the Central Bank of Brazil (appendix
B). The results were not inspiring (see regression #5 in appendix A). The high p-value of the coefficient for the independent variable employment index - 0.88 - prevents us from explaining the changes in s for PETR13 using the regression results.
Investors' risk aversion can be behind the unexpected behavior of s during May, June and July 2006. As noted by Pan (2006), during the spring of 2006 there was an increase in aversion to exposure in emerging markets credit risk, what is exemplified by the sharp increase of the sovereign 5-year CDS for Brazil at that time, as showed by figure 8 below. On the last days of June 2006 the sovereign 5-year CDS for Brazil started to decrease, and around the middle of July it reached the same level it was trading before the risk aversion soared. As figure 8 shows us, between 5/15/06 and 7/18/06, when the sovereign 5-year CDS for Brazil traded consistently above 150bps, reaching a peak of 204bps on June 2 7th and recovering after that day, s for PETR13 showed the opposite
trend, although the risk-free rate from the synthetic bond equivalent to PETR13 followed the sovereign CDS trend (figure 7). The results from a regression for s for PETR13 as the dependent variable and the sovereign 5-year CDS for Brazil and a dummy for the period described above as independent variables corroborate this finding, as showed by the table below (see appendix A for more details about regression #6).
Figure 8. 5-year sovereign CDS, s and amount traded for PETR13.
Source: Bloomberg and www.debentures.com.br
Table 9 - Selected data from Regression #6 Dependent variable: s for PETR13.
Independent variables: sovereign 5-year C period between 6/15/06 and 7/18/06.
DS for Brazil and a dummy variable for the
Variable Coefficient Std. Error t-Statistic Prob. 5_YEARSOVEREIGN_CDS -0.797146 0.197042 -4.045557 0.0001
DUMMY -32.23962 14.89656 -2.164232 0.0334
C 204.7612 27.47935 7.451457 0.0000
R-squared
Adjusted R-squared
0.393910 Mean dependent var 0.379127 S.D. dependent var
The negative coefficient for the sovereign 5-year CDS variable in regression #6 suggests that s for PETR13 decreases (increases) as the sovereign 5-year CDS spread increases (decreases). The coefficient for the dummy is also negative, showing that s for PETR13 tends to decrease during times when risk aversion varies considerably. The low p-values allow us to accept the fact that the behavior of s for PETR13 is negatively
5-year sovereign CDS, s for PETR13 and Amount Traded
I2U 100 80 60 40 20 250 200 150 100 50 0 -50 1Ifu)
I Amount traded (PEFR13) - 5-year sovereign CDS - bps N s for PETR13 - bps
82.23610 52.87359 -Ivv
related to the risk aversion of investors outside Brazil. One possible explanation for this could be low liquidity, as can be seen in figure 8 - most trades of PETR13 were below
R$10 million. Another explanation could be the fact that the investors who hold Brazilian
sovereign credit risk are different from the ones that hold securities like PETR13 and PETR12. The former type of investor trades offshore Brazil and has access to a diverse array of emerging market credit risks while the latter type of investor holds only domestic securities and feels comfortable with corporate credit risk in the portfolio. In fact, when sovereign credit risk aversion increases offshore, the local investor may see the domestic corporate credit risk as a way to diversify his portfolio, what explains a behavior similar
to the "flight to quality".
6.2. What drives the difference between
s
for PETR12 and PETR13
and the USD CDS for Petrobrais?
The facts that neither PETR12 nor PETR13 are par bonds, interest rates - the swap DI x IGP-M rates - are not constant and the term structure is not flat, and the fact that in the CDS the protection buyer does not get the accrued coupon of the reference obligation13 once there is a credit event may be answers to the question above. However, we argue that if those reasons explain the behavior for s for PETR13 and PETR12, we should observe a similar difference of behavior between the credit spread of a global bond issued by Petrobris and the 5-year USD CDS for the company. In favor of our argument is the fact that the credit spread for a bond issued by Petrobris in the global market -i.e. denominated in USD issued by Petrobris International Finance, based in the Cayman Islands - presents a behavior very similar to the 5-year USD CDS for Petrobris, as showed by figure 9 below. It is worth mentioning that this bond is not a par bond and that the structure of the yield curve was not flat or constant during the whole year of 2006.
Figure 9. Spread over US Treasury for a Petrobris USD-denominated bond issued in the global market and the 5-year USD CDS for Petrobris.
250 200 150 100 50 0
Petrobras: offshore credit spread and 5-year USD CDS
- credit spread for Petrobras Global bond* N 5-year USD CDS Petrobras
* Petrobris International Finance, coupon 9.125%, maturity: 7/2/2013. Source: Bloomberg.
The table below shows us data from a regression where the dependent variable was the 5-year USD CDS for Petrobris and the independent one, the credit spread over US Treasury for the Petrobris global bond.
Table 10 - Selected data from Regression
Dependent variable: 5-year USD CDS for Petrobris.
Independent variables: credit spread over US Treasury for the Petrobri-s global bond. Dependent Variable: 5-year USD CDS for Petrobris
Method: Least Squares Sample (adjusted): 1 69 Included observations: 69
Variable Coefficient Std. Error t-Statistic Prob. credit spread for the Petrobrais global
bond 0.908638 0.064909 13.99861 0.0000
C -56.50874 9.533789 -5.927208 0.0000
R-squared 0.745210 Mean dependent var 75.20420
Adjusted R-squared 0.741407 S.D. dependent var 25.11460
S.E. of regression 12.77129 Akaike info criterion 7.960834
Sum squared resid 10928.10 Schwarz criterion 8.025591
Log likelihood -272.6488 F-statistic 195.9612
Durbin-Watson stat 1.763517 Prob(F-statistic) 0.000000
As expected, the coefficient for the credit spread is lower than 1.0. Since the CDS takes into account that in a credit event the protection buyer will not receive the accrued coupon of the reference obligation, its spread should be lower than the credit spread for the same reference obligation. However, since the CDS and the bond have different maturities, we cannot rely on this fact to explain the value of the coefficient in this regression. An R-squared of 0.74 the p-values being practically zero corroborate our view that the accrued interest of the reference obligation, the fact that the bonds are not par bonds and the shape of the term structures are not the reasons why s for PETR13 and PETR12 showed a behavior very different from the one from the 5-year USD CDS for Petrobrais.
Another explanation could be the effect of the currency, since s is in terms of basis points for bonds issued in Brazilian Reais (BRL).
Figure 10. s for PETR13, the 5-year USD CDS for Petrobris and the (BRL/USD).
Brazilian currency
s for PETR13, 5-year USD CDS for Petrobras and BRIJUSD L.O 2.5 2.4 2.3 2.2 2.1 2.0 O
* s for PETR13 (bps) * 5-year USD CDS Petrobras (bps) - BRIJUSD Source: Bloomberg and Central Bank of Brazil.
In order to investigate the influence of currency on the value of s we ran a regression and the results are showed below.
Table 11 - Selected data from Regression Dependent variable: s for PETR13
Independent variables: 5-year USD CDS for Petrobris and BRL/USD. Dependent Variable: s for PETR13
Method: Least Squares
Sample (adjusted): 3/29/2006 10/31/2006 Included observations: 26 after adjustments
Variable Coefficient Std. Error t-Statistic Prob. 5-year USD CDS for Petrobras -0.439473 0.434600 -1.011214 0.3224
BRL/USD -230.2102 212.2032 -1.084858 0.2892 C 619.2966 438.1533 1.413425 0.1709 150 100 -50 -100
-50
-100
10 \C ý \p ý? ~1 kAdjusted R-squared S.E. of regression Sum squared resid Log likelihood Durbin-Watson stat 0.210799 42.05107 40670.73 -132.5096 1.396444 S.D. dependent var Akaike info criterion Schwarz criterion F-statistic Prob(F-statistic)
However, few data points, low R-squared and high p-values from the regression above prevent us from drawing any conclusion relating the changes in the s for PETR13 with the changes in the 5-year USD CDS for Petrobris and the changes in the Brazilian Real quotes.
The fact that the data available for PETR13 and PETR12 is constituted by average prices from days when those bonds traded and that the risk-free swap rates are end of day quotes may be responsible for the differences between s for PETR13 and PETR12 and the 5-year USD CDS for Petrobris. Another issue that raises concerns is that these bonds are inflation linked, and the release of information that affects inflation expectations may amplify this average price/end of day quote issue. Consequently, with the data available we were not able to explain the peculiar behavior of s for PETR13 and PETR12.
6.3. Why is the 5-year USD CDS for Petrobris lower than the 5-year
sovereign CDS for Brazil?
Looking at figure 6 we noticed that the 5-year USD CDS for Petrobris is lower than the 5-year sovereign CDS for Brazil. This fact can be explained by the credit rating
showed in the table below.
Table 12 - Credit ratings for The Republic of Brazil (sovereign) and for Petrobris. Brazil Sovereign Rating* Petrobris**
Moody's Ba2 Baa2
Fitch BB BB+
* Bond maturing on 1/11/2012. Coupon: 11.00%
** Bond issued by Petrobris International Finance, Cayman Islands, maturing on 7/2/2013. Coupon: 9.125% Source: Bloomberg. 47.33509 10.42381 10.56898 4.338800 0.025189
Since Petrobrais has better credit ratings than Brazil according to Moody's and Fitch, it is expected that the CDS for the company will have a lower spread than the one for Brazil, assuming both CDS have the same maturity.
7. Benefits and Risks from a Liquid CDS Market
Credit derivatives provide many benefits to many market participants. Banks can use credit derivatives to better manage credit risk exposure in their portfolios while keeping ownership from loans or bonds and avoiding damaging their relationships with the borrowers or bond issuers. Buying credit protection provides banks regulatory capital relief and enables better capital allocation at a low cost. Selling credit protection allows portfolio diversification by geography, industry or reference entity and can enhance the yield from portfolios.
Insurance companies can also better manage their portfolios, lowering credit risk exposure by purchasing credit protection (without needing to sell bonds) and enhancing yields and increasing diversification by selling credit protection. Credit derivatives, such as CDO and synthetic CDO, provide different instruments to match the maturity profile of liabilities while meeting specific credit risk criteria.
Asset managers and hedge funds may use credit derivatives to profit from positive or negative views on credit risk with leverage and without having to buy or sell bonds. Since it is possible to achieve the return of an asset without having to own that asset, the use of credit derivatives increases the liquidity available.
In addition to allowing better capital allocation and better portfolio management, credit derivatives enhance investors' appetite for corporate debt. New assets that are created by the use these financial tools, such as CDO, can offer an array of risk and return combinations that were not available to investors before. Consequently, borrowers and bond issuers benefit from credit derivatives as well, since higher demand for corporate debt can lower the cost of capital for debtors.
On the other hand, credit derivatives enable financial institutions, such as banks, to transfer credit risk to entities that are not under the supervision from central banks. The fact that these unsupervised entities can leverage their bets in credit views by using credit derivatives may create concerns regarding systemic risk. If credit risk is not well diversified among market participants and there is an economic or financial downturn, with many companies defaulting on their bonds and loans, these highly leveraged entities may go bankrupt and pose a huge risk for the entire system.
Credit derivatives may also create a moral hazard. Companies borrow from investors by issuing bonds or contracting loans. If investors are very confident that they will be able to sell on those bonds or loans in the short term, they may not care if the companies who borrowed from them will be able to repay their debt when maturity arrives. Consequently, the quality of the borrower may play a secondary role in the lending process, and quantity may become more important for lenders.
Nevertheless the benefits from credit derivatives seem to overcome the risks, especially if we consider the recent past years when the amount of credit derivatives in the market increased dramatically without any news regarding bankruptcy by the use of such instruments. However, economic conditions have been benign, with modest recessions and low interest rates. The real test for the credit derivatives is still to come:
times of economic downturn with high number of defaults.
8. Conclusion
The approach used to compute the domestic CDS spread for Petrobrais - the no-arbitrage argument - did not provide results that were comparable to the CDS traded offshore for the same reference entity. Changes in credit ratings and changes in the state of the economy could not explain the changes in the domestic credit spread, proxy for the domestic CDS. However, the fact that the domestic credit spread showed the opposite behavior of the sovereign offshore CDS, especially during times when credit risk aversion varied significantly, suggests that more research in this field can bring
interesting results. There is the possibility that local investors in Brazil view domestic corporate bonds as safe investments during high credit risk aversion times. Although bond yields and CDS spreads are related, the lack of data, the fact that the bonds are inflation linked and the prices available are averages from days when those bonds traded may have posed extra difficulty to compute the domestic CDS spread. Moreover, the risk-free swap rates are end of day quotes and the term structure varied considerably during the period when data was available.
Credit derivatives have brought many benefits to market participants, such as better capital allocation, more effective portfolio credit risk management and lower cost of capital for borrowers. Although the outstanding notional amount of credit derivatives has grown dramatically the last years in Europe and the United States, countries such as Brazil, Mexico and Korea were not able to let their local markets benefit from the use of these financial instruments.
Among these three countries Korea seems to be in a more advanced position regarding credit derivatives. Local regulation allows the trade of credit derivatives and an increasing number of Korean domestic financial institutions and companies have become more involved in this market. The number of credit products, CDO and synthetic CDO is increasing, allowing insurance companies to diversify their exposures and providing investors with a broader range of assets and investments opportunities. Regarding the local regulation, the Financial Supervisory Commission and the Financial Supervisory Service are seeking to relax the regulations on credit derivatives by financial institutions, helping the credit derivatives market to evolve more rapidly (Park, 2006). The main challenge for continued market development in Korea is awareness among investors of the risk factors involved in credit derivatives and the relatively smaller number of fixed income investors.
In Mexico, where the derivatives markets are dominated by peso-dollar and inter-bank interest rate futures, the central inter-bank passed a new regulation in January 2007 that allowed commercial banks to trade protection against credit defaults. However, since pension funds, mutual funds, hedge funds and insurance companies were left out of this
market, it is difficult to expect significant growth in the near future. These market participants have an important role in the developed credit derivative markets, providing much of the liquidity, as we discussed earlier. Banco de Mexico, the central bank, decided to play safe in the local credit derivatives market, and this may delay the market development.
The Central Bank of Brazil, although not as restrictive as the Mexican one regarding the market participants that are allowed to trade credit derivatives in the local market, decided to play safe as well. Only banks, real estate, credit and leasing companies are allowed to sell credit protection. Corporations, pension funds, mutual funds and hedge funds may only purchase credit protection, and there are limits for the amount of protection they can purchase depending on the liquidity of the reference obligation. Hedge funds, that are very active players in the credit derivatives market in the US, providing much of the liquidity, and insurance companies, that have an important role as credit protection sellers, have only limited roles in the Brazilian domestic credit derivative market. Moreover, the central bank allowed only CDS and TRS in the local market, leaving CDO, synthetic CDO and many other credit structured products out of the reach of the market participants. Clearly these issues regarding market participants' restrictions and low availability of structures will make the local credit derivatives market less attractive in Brazil. Consequently, its development is likely to take long time.
Although the size of the bond market in Brazil is not an impediment for the development of credit derivatives, some limitations, such as the low liquidity of the corporate bonds and the difficulty of short selling bonds, impose another hurdle for market participants to develop credit derivatives. In addition, Brazil needs reforms that address the efficiency of the judicial sector, better enforcement of contracts, stronger rights for secured and unsecured creditors, stronger accounting standards to improve the quality of information available about borrowers and the development of a legal and regulatory framework that facilitates the exchange among financial institutions of positive and negative information about borrowers (Beck, 2000).
Such reforms will enable the existence of a more liquid corporate bond market. And, together with a more flexible regulation, the market participants in Brazil may be able to benefit from the many advantages and possibilities provided by using credit derivatives.