HAL Id: hal-02344591
https://hal.archives-ouvertes.fr/hal-02344591
Submitted on 4 Nov 2019
HAL is a multi-disciplinary open access
archive for the deposit and dissemination of
sci-entific research documents, whether they are
pub-lished or not. The documents may come from
teaching and research institutions in France or
abroad, or from public or private research centers.
L’archive ouverte pluridisciplinaire HAL, est
destinée au dépôt et à la diffusion de documents
scientifiques de niveau recherche, publiés ou non,
émanant des établissements d’enseignement et de
recherche français ou étrangers, des laboratoires
publics ou privés.
Sensor Array for Secondary Structures of DNA
Michela Zuffo, Xiao Xie, Anton Granzhan
To cite this version:
Michela Zuffo, Xiao Xie, Anton Granzhan. Strength in Numbers: Development of a Fluorescence
Sensor Array for Secondary Structures of DNA. Chemistry - A European Journal, Wiley-VCH Verlag,
2019, 25 (7), pp.1812-1818. �10.1002/chem.201805422�. �hal-02344591�
Strength in Numbers: Development of a Fluorescence Sensor
Array for Secondary Structures of DNA
Michela Zuffo,
[a,b]Xiao Xie,
[a,b]and Anton Granzhan*
[a,b]Abstract: High-throughput assessment of secondary structures
adopted by DNA oligonucleotides is currently hampered by the lack of suitable biophysical methods. Fluorescent sensors hold great potential in this respect; however, the moderate selectivity that they display for one DNA conformation over the others constitutes a major drawback to the development of accurate assays. Moreover, the use of single sensors impedes a comprehensive classification of the tested sequences. Herein, we propose to overcome these limitations through the development of a fluorescence sensor array constituted by easily accessible, commercial dyes. Multivariate analysis of the emission data matrix produced by the array allows to explore the conformational preferences of DNA sequences of interest, either by calculating the probability of group membership in the six predefined structural categories (three G-quadruplex groups, double-stranded, and two groups of single-stranded forms), or by revealing their particular structural features. The assay enables rapid screening of synthetic DNA oligonucleotides in a 96-well plate format.
Introduction
DNA is highly polymorphic, being capable of forming single-stranded (random coil), double-single-stranded (A-, B- and Z-DNA), triple-stranded,[1] three- and four-way (Holliday) junctions,[2-3]
i-motifs,[4] G-quadruplex (G4)[5] as well as tetrahelical non-G4
structures.[6-7] Among the plethora of secondary structures,
G4-DNA are particularly intriguing due to their plasticity and ability to form various topologically diverse isoforms, defined by the number (intra- vs. intermolecular) and mutual orientation of the strands (parallel, hybrid or anti-parallel topologies), as well as the length and topology of the loops.[8-10] In view of this conformational
diversity, experimental probing of secondary structures is not straightforward, even with short oligonucleotides. High-resolution methods such as NMR or X-ray crystallography can provide detailed structural information, but are time-consuming, require specialized equipment, and often fail if a sample presents a mixture of isoforms. Other biophysical techniques, such as thermal denaturation,[11] thermal difference spectroscopy,[12]
hydrodynamic,[13] mass-spectrometric,[14-15] chromatographic[16]
and gel-electrophoretic methods [17] may be employed in order to
assess the secondary structure of DNA oligonucleotides; however, they provide only limited structural information and are poorly suited for high-throughput analysis. Vibrational circular dichroism (VCD)[18-19] and electronic circular dichroism (CD) spectroscopy
can furnish a more detailed picture of DNA conformation (such as quantitative analysis of structural elements in G4-DNA),
especially when coupled with chemometric analysis.[20-21]
Nonetheless, major drawbacks of CD spectroscopy are the requirement of significant amount of material, long acquisition times and lack of high-throughput equipment.
Optical sensors represent an attractive alternative to many biophysical methods and have found countless applications in diverse fields. Among optical methods, fluorescence is most widely utilized, due to simplicity, sensitivity and rapidity of experi-mental protocols. Moreover, suitable instruments (fluorimeters and plate readers) are available in most laboratories, allowing widespread implementation of high-throughput assays. In recent years, fluorescent sensing has found large application in probing
secondary structures of DNA, notably G4-DNA.[22] Thus,
numerous fluorescent probes for detection of G4-DNA were discovered or rationally designed by many groups.[23-25] In the best
cases, such probes demonstrate selective response towards one or another G4 topology.[26-33] However, most probes do not
provide an exclusive selectivity. Moreover, even if they allow a DNA sample to be ascribed to a certain topology group, currently available fluorescent probes do not allow a comprehensive conformational analysis of DNA. Finally, individual probes may provide false outputs with DNA sequences that adopt unusual or non-G4 conformations.[34-35] In this context, application of two
dyes for conformational analysis of G4-DNA structures represents a promising step forward.[36-37] Thus, a fluorimetric method that
would allow a full conformational analysis of a given DNA sample would be highly desirable.
Sensor arrays (i.e., combinations of several probes) represent useful tools in domains where exquisite specificity is problematic to achieve. Rather than relying on specific interactions with a single analyte, they yield a differential response pattern for each target, enabling its identification. Optical sensor arrays have been developed for numerous analytes and applications (e.g., metal cations, nutrients or contaminants in food, bacteria in patient sam-ples, pollutants in air, soil and water).[38-39] However, most of them
only aim at distinguishing individual analytes (e.g., different small molecules of interest), rather than attempting more far-reaching categorizations. Moreover, the applications of this method in the field of nucleic acids sensing are scarce and mainly limited to the recognition of specific sequences, in line with usual appli-cations.[40-42] Herein, we describe the first fluorescence sensor
[a] Dr. M Zuffo, Dr. X. Xie, Dr. A. Granzhan CNRS UMR9187, INSERM U1196 Institut Curie, PSL Research University F-91405 Orsay (France)
E-mail: [email protected]
[b] CNRS UMR9187, INSERM U1196
Université Paris Sud, Université Paris Saclay F-91405 Orsay (France)
Supporting information for this article is given via a link at the end of the document.
Figure 1. Principle of the proposed assay. A) Selection of fluorescent dyes; B) preparation of dye–DNA sample combinations in a 96-well plate format and fluorescence emission measurement; C) data pre-treatment (intra-channel normalization); D) multivariate analysis.
array designed for secondary structure analysis of DNA samples. Our work aims at providing a proof-of-concept of the applicability of such an approach to the categorization of oligonucleotides based on their secondary structure instead of their specific identity.
Results and Discussion
For the implementation of an initial sensor array, we selected 11 commercially available dyes with documented affinity for nucleic acids (Figure 1 and Supporting Information, Table S1). The assay is performed in a 96-well plate format, suitable for testing of small amounts of DNA (4–5.5 nmol of oligonucleotide) in an automa-tized, high-throughput fashion. Following data pre-treatment, DNA conformation is assigned after multivariate analysis of emis-sion dataset for all DNA–dye pairs, recorded at the wavelengths suitable for each dye (Figure 2 and Supporting Information, Figure S1).
Figure 2. Excitation (dashed) and emission (solid lines) spectra of A) ethidium bromide and B) NMM (c = 2.5 µM in K-100 buffer) in the presence of two molar equiv. of G4 (c-myc, blue) or duplex DNA (ds26, red), recorded after 1 h of incubation at room temperature. Emission spectra were also recorded for the dye alone (black lines). Excitation (green) and emission (blue) intervals represent the passbands of the filters used in the plate reader measurements.
We began our study with a set of 34 DNA samples (33 oligonucleotides of 15 to 34-nt length and highly polymerized calf
thymus DNA, used at roughly equivalent nucleotide
concentration) with well-established conformations (Supporting Information, Table S2). These samples were chosen to uniformly represent the five groups of interest, namely parallel, anti-parallel and hybrid G4s, single-stranded and double-stranded structures.
The CD spectra of all samples were in agreement with literature reports, confirming their expected conformations (Supporting Information, Figure S2). The raw fluorescence intensity data for each dye (c = 2.5 µM) in the presence of all DNA samples (2 molar equiv.) demonstrated an extreme variability of fluorimetric responses (Supporting Information, Figure S3). As such, these results were not suitable for classification of samples through univariate analysis, as demonstrated by Tukey plots obtained by grouping the data according to their expected conformation (Supporting Information, Figure S4). This multi-dimensional data-set (12 emission channels) was thus subjected to intra-channel normalization, followed by Principal Component Analysis (PCA) as described in the experimental section. PCA is a multivariate analysis method that describes the variance in a sample set through a reduced number of principal components (PCs), greatly simplifying the interpretation of multivariate data.[43] Of note, PCA
is an unsupervised method that clusters data points based on their similarity, rather than utilizing a predefined classification to orient their disposition: this feature is particularly useful to test the discriminatory power of our sensor array, without considering the conformational premises of samples.
The variance of the full dataset (three replicates for each of the 34 DNA samples) could be described at 95% with six PCs out of 12 (Supporting Information, Table S3), in contrast to most arrays, in which the first two components are sufficient. However, a scree plot of dye eigenvalues (Supporting Information, Figure S5) suggested that only the first four PCs were statistically significant: altogether, they represented 89% of total variance. Analysis of eigenvalues according to the Kaiser rule yielded similar results (Supporting Information, Table S3). A score plot of PC1 vs. PC2 would thus represent alone 65% of sample variance. Visual inspection of the plot allowed us to identify six clusters, highlighted by different colors (Figure 3 A–B). Remarkably, the clustering mirrors, to a large extent, the expected structural classi-fication of samples, with the group of single-stranded samples further dividing into two clusters. These were found to correspond to the sequences containing (ss2, ss3, ss4, ss6, ss7) or not containing (ss1, ss5, dT26) guanosine residues (light blue and orange datasets in Figure 3 A–B, respectively). Depending on the specific dye, such behavior might be ascribed either to the prompt photoinduced oxidation of dG (EdG•+/dG = 1.47 V vs. NHE)[44] or to
the conservation of some structured domains, allowing partial intercalation of dyes in the guanine-containing strands.
400 500 600 700 800 0.0 0.5 1.0 Norma liz ed fl uo re sc en ce in ten si ty Wavelength (nm) 400 500 600 700 800 Wavelength (nm) A B
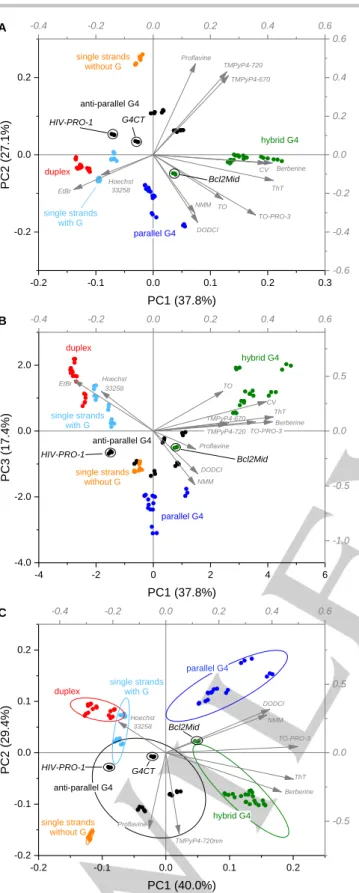
Figure 3. A) PC1 vs. PC2 and B) PC1 vs. PC3 score plots derived from PCA analysis of the training set (34 DNA samples × 3 replicates, plotted separately as colored dots) using the data from the full sensor array (11 dyes, 12 variables). C) PC1 vs. PC2 score plot representing the PCA analysis of the data from the reduced sensor array (8 dyes). Grey arrows: loading vectors for each variable. Ellipses represent 90% confidence intervals for each group.
Figure 4. Schematic representation of G4 structures adopted by Bcl2Mid (PDB: 2F8U)[45-46] and HIV-PRO-1.[47]
Notably, some sequences were found to fall relatively far from the centers of the expected conformation clusters (highlighted in Figure 3 A–B). This is the case of Bcl2Mid, HIV-PRO-1 and, to some extent, G4CT. Interestingly, this positioning correlates with the presence of structural peculiarities, which distinguish them from other members of their groups and could impact the response of our array. Specifically, hybrid G4 Bcl2Mid contains an additional A:T base pair, partially hindering one of the external G tetrads.[45-46] Similarly, HIV-PRO-1 contains an additional
Watson–Crick G:C base pair of top of a bi-layered anti-parallel G4 structure (Figure 4).[47] Finally, G4CT was shown to adopt two
possible conformations, parallel and anti-parallel G4, at high and low potassium concentrations, respectively.[48] Except for these
cases, all clusters appeared well separated, considering both the PC1 vs. PC2 (Figure 3, A) and the PC1 vs. PC3 (Figure 3, B) plots. This is particularly remarkable, taking into account the high intra-group polymorphism characterizing the tested sequences.
Next, we attempted to reduce the size of the array, in order to implement a simpler but equally efficacious assay. First, we examined the coefficients of each dye for the first four PCs (Supporting Information, Table S4) and kept only the dyes providing maximal contribution to each of them (PC1: ThT, PC2: Proflavine, PC3: NMM, PC4: Hoechst 33258). However, the separation achieved with such four-dye array did not prove satisfactory (Supporting Information, Figure S6). We thus attempted a less restrictive approach, allowing up to 8 dyes to be part of the array. As evidenced by loading values (grey arrows in Figure 3 A), some pairs of dyes provide similar information (e.g., TO and TO-PRO-3), allowing the exclusion of one of the pair components. We thus retained Berberine, TO-PRO-3 and TMPyP4 (720 nm reading), which gave higher loadings with respect to their companions (i.e., Crystal Violet, TO and TMPyP4-670 nm reading) in the first two, and most significant, PCs. Contextually, we excluded EtBr in favor of Hoechst 33258, which had previously been selected for the four-sensor array. The resulting eight-sensor array proved efficacious and preserved the pattern observed with the full array (Figure 3 C). In fact, only small overlaps were observed in the PC1 vs. PC2 plot between the zones of G-containing single strands, duplexes and anti-parallel G4s. We then attempted to further reduce the array size by eliminating DODCI, according to the same criteria applied for EtBr. However, this resulted in a significant increase of the overlap regions (Figure S7), prompting us to proceed to the following steps with eight sensors.
TO Thiof lav in T Prof lav in Ethidium Br Berberine CV Hoechst 33258 DODCI NMM TMPy P4 (670) TMPy P4 (720) TO-PRO-3 -4 -2 0 2 4 6 -4.0 -2.0 0.0 2.0 PC3 (1 7.4 %) PC1 (37.8%) -0.4 -0.2 0.0 0.2 0.4 0.6 -1.0 -0.5 0.0 0.5 B single strands without G Proflavine TMPyP4-720 TMPyP4-670 anti-parallel G4 duplex single strands with G EtBr Hoechst 33258 parallel G4 DODCI NMM TO TO-PRO-3 CV ThT Berberine hybrid G4 Bcl2Mid HIV-PRO-1 TO Thiof lav in T Prof lav in Ethidium Br Berberine CV Hoechst 33258 DODCI NMM TMPy P4 (670) TMPy P4 (720) TO-PRO-3 -0.2 -0.1 0.0 0.1 0.2 0.3 -0.2 0.0 0.2 PC2 (2 7.1 %) PC1 (37.8%) A duplex single strands with G parallel G4 hybrid G4 single strands without G anti-parallel G4 Proflavine TMPyP4-720 TMPyP4-670 Berberine CV ThT TO-PRO-3 TO NMM DODCI EtBr Hoechst 33258 Bcl2Mid HIV-PRO-1 G4CT -0.4 -0.2 0.0 0.2 0.4 0.6 -0.6 -0.4 -0.2 0.0 0.2 0.4 0.6 Thiof lav in T Prof lav in Berberine Hoechst 33258 DODCI NMM TMPy P4 (720) TO-PRO-3 -0.2 -0.1 0.0 0.1 0.2 -0.2 -0.1 0.0 0.1 0.2 anti-parallel G4 PC2 (2 9.4 %) PC1 (40.0%) single strands without G duplex single strands with G parallel G4 hybrid G4 Hoechst 33258 DODCI NMM TO-PRO-3 ThT Berberine TMPyP4-720nm Proflavine C HIV-PRO-1 Bcl2Mid G4CT -0.4 -0.2 0.0 0.2 0.4 0.6 -0.5 0.0 0.5 HIV-PRO-1 G A C T Bcl2Mid 5′ 3′ 5′ 3′
Table 1. Assignment of Pu24T, c-kit87up, UpsB-Q3 and EBR1 samples to the relevant conformation groups by LDA.
Sequence
Assignment probability[a]
Predicted group
Hybrid G4 Anti-parallel G4 Parallel G4 Duplex Single strands (with dG) Single strands (without dG)
Pu24T 0.99 3.88 × 10⁻⁶ 4.15 × 10⁻¹¹ 8.67 × 10⁻¹⁵ 4.18 × 10⁻⁶ 2.42 × 10−42 Hybrid
c-kit87up 0.98 1.66 × 10⁻² 3.02 × 10⁻¹¹ 8.83 × 10⁻¹³ 1.04 × 10⁻⁴ 1.50 × 10⁻²⁷ Hybrid
UpsB-Q3 1 2.25 × 10⁻⁵ 1.88 × 10⁻²⁸ 1.27 × 10−38 4.34 × 10⁻¹⁹ 2.62 × 10⁻²⁹ Hybrid
EBR1 3.77 x 10⁻⁶ 0.99 6.90 × 10⁻¹⁸ 8.78 × 10⁻²⁰ 6.18 × 10⁻⁵ 1.08 × 10⁻¹¹ Anti-parallel
[a] Analysis performed using average values calculated from three independent replicates for each sample.
-8 -6 -4 -2 0 2 4 6 8 10 12 -6 -4 -2 0 2 4 6 8 Cano nical Va riab le 2 Canonical Variable 1 anti-parallel G4 single strands without G hybrid G4 single strands with G parallel G4 duplex Pu24T c-kit87up EBR1 UpsB-Q3
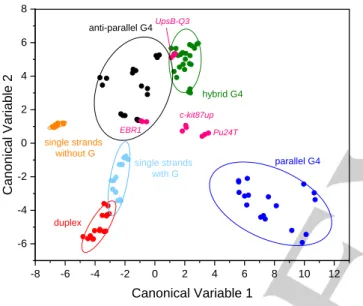
Figure 5. LDA analysis of the training set (34 DNA samples × 3 replicates, plotted separately as colored dots). Ellipses represent 85% confidence intervals for each group. Samples colored in magenta represent the test samples (Pu24T, c-kit87up, EBR1 and UpsB-Q3, 3 replicates per sample), analyzed according to the established canonical variables.
As a next step, we analyzed the dataset originating from this optimized array by Linear Discriminant Analysis (LDA). Similar to PCA, this method defines linear discriminant functions that best separate data points from a set. However, LDA is a supervised method, which utilizes the information on each analyte’s group membership to optimize the separation of groups.[43] The practical
interest of such analysis resides in the possibility to assign an unknown analyte to one of the predefined groups. We thus defined the relevant functions (up to 5 canonical variables) using the 34 DNA samples as a training set. Validation of the method by the leave-one-out test proved satisfactory, with only one mis-classified DNA sample out of 34 (2.9% error, Supporting Infor-mation, Table S5), confirming the potential of the sensor array approach even when applied to a task as complex as ours. The classification is determined upon calculation of the probability for each sample’s membership in each of the six predefined groups,
taking into account the whole set of canonical variables. A visual representation of the outcome is provided by the 2D LDA plot (Canonical Variables 1 vs. 2, Figure 5). As previously observed in PCA, the six groups form as many independent clusters, with minimal overlaps. A similar result is observed in the 3D plot obtained upon addition of the third canonical variable (Supporting Information, Figure S8).
Further, we tested several practical applications of our assay. First, we examined multiple DNA sequences whose CD spectra were problematic to interpret. In some cases, CD spectra suggest a simplified structure with respect to the conformation established by high-resolution methods. For example, CD signatures of the sequences Pu24T and c-kit87up (cf. Supporting Information, Table S2) suggest a parallel G4 conformation (Supporting Information, Figure S9). However, their solution structures are much more complex, as demonstrated by NMR analysis (PDB: 2A5P and 2O3M, respectively).[49-50] Interestingly, PCA analysis
highlighted these peculiarities, positioning them in between the parallel and hybrid groups (Supporting Information, Figure S10). This was also confirmed by visual inspection of the LDA plot and the derived classification, which ascribed both Pu24T and
c-kit87up to the hybrid G4 group with high probability (Figure 5
and Table 1). Likewise, solution structure of 22GGG as established by NMR (PDB: 2KF8) features a bi-tetrad, anti-parallel (basket-type) conformation,[51] whereas its CD spectrum
suggests a hybrid conformation (Supporting Information, Figure S2). Instead, PCA analysis (Supporting Information, Figure S11 A) indicated the similarity of 22GGG to other members of the anti-parallel G4 group, as further confirmed by LDA assignment (Supporting Information, Figure S11 B and Table S6). In some other cases, CD spectra allow dual interpretation, as in the case of UpsB-Q3[52] and EBR1[53] (cf. Supporting Information, Table S2).
CD spectra of both sequences display a negative maximum at 240 nm and a positive maximum at 263 nm, with a shoulder between 283 and 310 nm (Figure S12). The presence of these two positive bands might arise either from a single hybrid conformation, or from the co-existence of two distinct structures. PCA (Supporting Information, Figure S13) and LDA assessments (Figure 5 and Table 1) prompted us to confirm the assignment of
UpsB-Q3 to the hybrid G4 group. For EBR1, instead, the data
that is, between the parallel and anti-parallel G4 groups. In good agreement, EBR1 was not classified as hybrid by LDA (Figure 5 and Table 1). Therefore, these results support the interpretation of its CD spectrum in favor of a mixture of secondary structures.
Next, we examined the proficiency of our sensor array at dealing with secondary structures different from the ones used in the training set. This is the case of several sequences displaying CD signatures non-typical for single strands (Supporting Information, Figure S14), despite the lack of obvious hydrogen bonding patterns allowing the formation of double-stranded or G4 structures, namely scr26, ss8, 24non096, dA26 and (TGA)8T, as well as VK2 forming a peculiar non-G4 tetraplex structure (cf. Supporting Information, Table S2).[7] The results of PCA analysis
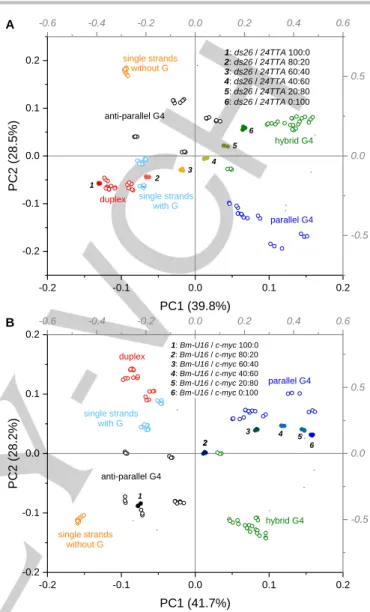
revealed a positioning of data points that was ambiguous, but clearly falling outside the expected single-strand groups (Supporting Information, Figure S15 A). A similar result was observed using LDA (Supporting Information, Figure S15 B). Although our approach does not allow to precisely identify the conformation of such oligonucleotides, it still provides valuable information on the presence of unexpected secondary structures. Finally, we evaluated the capability of our assay to analyze mixtures of analytes. For this purpose, we tested samples containing varying molar fractions of ds26 (self-complementary duplex) and 24TTA (hybrid G4), as well as c-myc and Bm-U16 (parallel and anti-parallel G4s, respectively). In both cases, CD spectra of mixtures represented arithmetical sum of the ones of individual components, resulting in complex shapes unsuitable for simple qualitative analysis (Supporting Information, Figure S16). A PC1 vs. PC2 score plot for the ds26 / 24TTA mixtures revealed a progressive shift from the group of duplexes to the one of hybrid G4s (Figure 6 A), with only pure samples clearly falling into the corresponding clusters. Interpretation of the data for mixtures
c-myc / Bm-U16 was more complex, since all samples containing
more than 20 mol% of c-myc spotted in the parallel G4 group zone (Figure 6 B). This is likely due to higher affinity of some of the sensors (e.g., NMM) for the parallel G4 structure. In all cases, though, data sets for all mixtures were clearly distinguishable from pure samples.
Conclusions
In this work, we presented a novel fluorescence-based method, based on a sensor array composed of easily available dyes (which allows an easy implementation by other users) and allowing the assessment of secondary structures adopted by DNA oligonucleotides in a high-throughput fashion. Our first-generation array is able to satisfactorily discriminate among the three topological classes of G4-DNA, single-stranded and duplex oligonucleotides, correctly assigning 97.1% of tested sequences through the use of multivariate analysis tools (PCA and LDA), available in commonly used and/or freeware analysis software (such as Origin and R). Moreover, we demonstrated that the cases appearing rather far from the barycenter of expected groups (HIV-PRO-1, Bcl2Mid, G4CT) can be interpreted as an indication of particular structural features of a given sample, distinguishing them from typical members of the expected group.
Figure 6. PC1 vs. PC2 score plot derived from PCA analysis of the training set (empty dots) and A) ds26 / 24TTA mixtures or B) Bm-U16 / c-myc mixtures (filled dots).
Thus, this method may be exploited not only for categorization of samples but also for the discovery of particular motifs.
We explored some practical applications of this assay and demonstrated that it provides useful insights on a variety of sequences whose conformation cannot be assessed by simple interpretation of CD spectra. The assay also proved efficacious at distinguishing mixtures of analytes, folded into different conformations, with respect to pure samples. Of note, the assay design allows plenty of room for improvement through, e.g., optimized selection of dyes and wavelength settings, and may be easily adapted to other DNA conformations, such as i-motif, triple-helical or junction structures, through inclusion of corresponding sequences into the training set. It may also constitute the basis for a high-throughput method to experimentally assess the G4-folding potential and the preferentially adopted topology of novel DNA sequences. Of course, this approach, similar to most in vitro biophysical techniques (NMR, ESI-MS, CD spectroscopy) is
Thiof lav in T Prof lav in Berberine Hoechst 33258 DODCI NMM TMPy P4 (720) TO-PRO-3 -0.2 -0.1 0.0 0.1 0.2 -0.2 -0.1 0.0 0.1 0.2 PC2 (2 8.5 %) PC1 (39.8%)
duplex single strands
with G without G single strands anti-parallel G4 hybrid G4 parallel G4 1 2 3 4 5 6 1: ds26 / 24TTA 100:0 2: ds26 / 24TTA 80:20 3: ds26 / 24TTA 60:40 4: ds26 / 24TTA 40:60 5: ds26 / 24TTA 20:80 6: ds26 / 24TTA 0:100 A -0.6 -0.4 -0.2 0.0 0.2 0.4 0.6 -0.5 0.0 0.5 Thiof lav in T Prof lav in Berberine Hoechst 33258 DODCI NMM TMPy P4 (720) TO-PRO-3 -0.2 -0.1 0.0 0.1 0.2 -0.2 -0.1 0.0 0.1 0.2 PC2 (2 8.2 %) PC1 (41.7%) hybrid G4 parallel G4 anti-parallel G4 single strands without G single strands with G duplex 1 2 2 3 4 5 6 1: Bm-U16 / c-myc 100:0 2: Bm-U16 / c-myc 80:20 6: Bm-U16 / c-myc 0:100 4: Bm-U16 / c-myc 40:60 5: Bm-U16 / c-myc 20:80 3: Bm-U16 / c-myc 60:40 B -0.6 -0.4 -0.2 0.0 0.2 0.4 0.6 -0.5 0.0 0.5
limited to relatively short synthetic oligonucleotides. However, the strong advantage of sensor arrays, along with its versatility, is the potential of high-throughput analysis (up to thousands of sequences), which is currently unreachable with other techniques.
Experimental Section
Buffer and dye solutions: All experiments were performed using a ‘K-100’ buffer containing 0.1 M KCl and 0.01 M lithium cacodylate in MilliQ water, pH 7.2. Dyes were purchased from Sigma-Aldrich (Thiazole Orange, Crystal Violet, DODCI, TMPyP4), TCI (Berberine hemisulfate, Thioflavin T), Fluka (Hoechst 33258, Proflavine, Ethidium Bromide), Invitrogen (TO-PRO-3) or Frontier Scientific (NMM), and used as supplied without further purification. Stock solutions of dyes were prepared in DMSO at a concentration of 4 mM and stored at −20 °C. Working solutions (25 µM) were prepared by diluting the stock solutions with a mixture of milliQ water and DMSO (9:1, v/v) containing 0.1 M KCl and 0.01 M lithium cacodylate (pH 7.2), and stored at 4 °C. The absence of precipitation in such conditions was verified for all dyes by centrifugation and visual inspection of the resulting solutions.
DNA samples: Oligonucleotides were purchased from Eurogentec (RP-HPLC purification grade) and used without further purification. Stock solutions of oligonucleotides (strand concentration: 100 µM, except for 46AG: 50 µM) were prepared in K-100 buffer and stored at 4 °C. Working solutions (c = 5.6 µM, except for 46AG: c = 2.8 µM) were prepared by dilution of stock solutions in the same buffer. Heteroduplexes (ds 3 + 4, ds 5 + 8 and ds 6 + 7) were prepared by mixing equal volumes of the corresponding single strands. The final concentration of heteroduplexes was 2.8 µM, to account for the doubled number of nucleotides. Calf thymus DNA (ct DNA, Invitrogen, 10 mg mL−1) was diluted with K-100 buffer to c ≈3 mM in base pairs, as calculated by absorption measurement at 260 nm based on εnucleotide = 6650 cm−1 M−1,[54] and then further diluted so as to obtain a working solution with a comparable nucleotide concentration as in oligonucleotide samples (i.e., 123 µM, considering 22 as an average length of oligonucleotides, cf. Supporting Information, Table S2). Working solutions were subsequently annealed (5 min at 95 °C) and then let equilibrate overnight. Annealed solutions were stored at 4 °C. For DNA mixtures, the components were annealed separately at a concentration of 5.6 µM, according to the same procedure and, after equilibration, mixed in relevant quantities (DNA1 : DNA2 = 100:0, 80:20, 60:40, 40:60, 20:80, 0:100, v/v).
CD spectra: CD spectra were recorded with a Jasco J-1500 spectropolarimeter. Spectra were recorded using working solutions of the pure DNA samples or of their relevant mixtures in K-100 buffer, in quartz cuvettes with a path length of 0.5 cm. For all samples, total strand concentration was 5.6 µM, except for 46AG (2.8 µM) and ct DNA (123 µM nucleotides). In the case of DNA mixtures, the total oligonucleotide concentration was also 5.6 µM. Parameters for spectra acquisition: wavelength range, 210 to 330 nm; scan speed, 50 nm min–1; number of scans, 3; data pitch, 0.5 nm; bandwidth, 2 nm; integration time, 1 s; temperature, 22 °C. Spectra were subsequently corrected for the blank. Finally, spectra were converted to molar dichroic absorption Δε [M−1 cm−1]
= θ/(32980 × c × ℓ), where θ is the CD ellipticity in millidegrees (mdeg), c
is DNA concentration in M, and ℓ is the pathlength in cm.
Fluorescence excitation and emission spectra: Fluorescence excitation and emission spectra were recorded with a HORIBA Jobin– Yvon Fluoromax-3 spectrofluorimeter, in quartz cuvettes (path length of 1 × 0.5 cm for emission and excitation beams, respectively). Sample solutions contained 2.5 µM of dye and 5 µM of the relevant DNA (G4 c-myc
or duplex ds26), unless otherwise stated, in K-100 buffer. After mixing, the solutions were left to equilibrate for 1 h in the dark, before performing the measurements. Emission and excitation wavelengths are listed in Supporting Information, Table S1 and correspond to those used in the following high-throughput assay.
Assay experimental procedure: Working solutions of DNA samples (5.6 µM or equivalent in K-100 buffer, 1.1 mL) or buffer alone were filled into 1.4-mL round-bottom tubes (Micronic). Working solutions of the dyes prepared as described above (25 µM, 5 mL) or buffer alone were filled into a 12-column reservoir (Porvoir Sciences). The solutions were transferred into 96-well black, flat-bottom microplates (Corning model 3650) using an automated pipetting system (Gilson PIPETMAX-268). Specifically, 90 µL of DNA solution (or buffer) were transferred into each of the 12 columns of the plate. Afterwards, 10 µL of dye solution (or buffer) were transferred into the appropriate columns. Final concentrations were 2.5 µM of the dye and 5 µM of DNA (or equivalent, cf. Supporting Information, Table S2), in a total volume of 100 µL per well. The final solvent mixture contained 1% v/v of DMSO. The plates were stirred for 1 min at 400 rpm and then let equilibrate in the dark for 1 hour at ambient temperature. Fluorescence emission was recorded using a microplate reader (BMG FluoStar Omega), exciting each dye at the appropriate wavelengths, with the aid of appropriate filters (see Supporting Information, Table S1 for excitation and emission wavelengths, and Figure S1 for filter passbands). The instrument gain was set for each channel and kept constant throughout all analyses. All samples were analyzed by three independent preparations and measurements.
Multivariate analysis: The acquired emission intensity data were normalized to a 0 to 1 scale separately for each dye. The emission intensity of the dye alone was included in the pre-treatment and then excluded from multivariate analysis, since it does not belong to any conformational group. Normalization is recommended for PCA to avoid biases due to different orders of magnitude for the various variables. Other pre-treatment methods (sample/free dye fluorescence intensity ratio,[55]autoscaling[56]) were also tested, but did not produce significantly different results. Multi-variate analysis (PCA and LDA) was performed using Origin Pro 2018b (OriginLab, Northampton, MA). Data for PCA are presented as score plots of PC1 vs. PC2, unless otherwise stated. Data for LDA are presented as Canonical Variables 1 vs. 2 plots, unless otherwise stated. Leave-one-out test was used for internal validation of the LDA method.
Acknowledgements
The authors thank Dr. M.-P. Teulade-Fichou for helpful and stimulating discussions. Financial support by Institut Curie (post-doctoral fellowship to M.Z.) and National Research Agency (ANR-17-CE07-0004-01, to A.G.) is gratefully acknowledged.
Keywords: fluorescence sensor array • DNA secondary
structures • G-quadruplex • multivariate analysis • high-throughput conformational analysis
[1] A. Jain, G. Wang, K. M. Vasquez, Biochimie 2008, 90, 1117-1130. [2] C. Altona, J. A. Pikkemaat, F. J. J. Overmars, Curr. Opin. Struct. Biol.
1996, 6, 305-316.
[3] P. S. Ho, Biochem. Soc. Trans. 2017, 45, 1149-1158.
[4] H. A. Day, P. Pavlou, Z. A. Waller, Bioorg. Med. Chem. 2014, 22, 4407-4418.
[5] S. Burge, G. N. Parkinson, P. Hazel, A. K. Todd, S. Neidle, Nucleic Acids Res. 2006, 34, 5402-5415.
[6] S. Tripathi, D. Zhang, P. J. Paukstelis, Nucleic Acids Res. 2015, 43, 1937-1944.
[7] V. Kocman, J. Plavec, Nat. Commun. 2014, 5:5381.
[8] A. I. Karsisiotis, C. O'Kane, M. Webba da Silva, Methods 2013, 64, 28-35.
[9] S. A. Dvorkin, A. I. Karsisiotis, M. Webba da Silva, Sci. Adv. 2018, 4. [10] A. Varizhuk, D. Ischenko, V. Tsvetkov, R. Novikov, N. Kulemin, D.
Kaluzhny, M. Vlasenok, V. Naumov, I. Smirnov, G. Pozmogova, Biochimie 2017, 135, 54-62.
[11] Y. Zhang, J. Chen, H. Ju, J. Zhou, Biochimie 2019, 157, 22-25. [12] J.-L. Mergny, J. Li, L. Lacroix, S. Amrane, J. B. Chaires, Nucleic Acids
Res. 2005, 33, e138-e138.
[13] N. C. Garbett, C. S. Mekmaysy, J. B. Chaires in G-Quadruplex DNA: Methods and Protocols (Methods in Molecular Biology), Vol. 608 (Ed. P. Baumann), Humana Press, 2010, pp. 97-120.
[14] A. Marchand, A. Granzhan, K. Iida, Y. Tsushima, Y. Ma, K. Nagasawa, M.-P. Teulade-Fichou, V. Gabelica, J. Am. Chem. Soc. 2015, 137, 750-756.
[15] M. J. Lecours, A. Marchand, A. Anwar, C. Guetta, W. S. Hopkins, V. Gabelica, Biochim. Biophys. Acta, Gen. Subj. 2017, 1861, 1353-1361. [16] E. Largy, J.-L. Mergny, Nucleic Acids Res. 2014, 42, e149.
[17] I. K. Moon, M. B. Jarstfer in G-Quadruplex DNA: Methods and Protocols (Methods in Molecular Biology), Vol. 608 (Ed. P. Baumann), Humana Press, 2010, pp. 51-63.
[18] V. Andrushchenko, D. Tsankov, M. Krasteva, H. Wieser, P. Bouř, J. Am. Chem. Soc. 2011, 133, 15055-15064.
[19] A. F. Bell, L. Hecht, L. D. Barron, J. Am. Chem. Soc. 1998, 120, 5820-5821.
[20] J. Jaumot, R. Eritja, S. Naveac, R. Gargallo, Anal. Chim. Acta 2009, 642, 117-126.
[21] R. del Villar-Guerra, J. O. Trent, J. B. Chaires, Angew. Chem. Int. Ed. 2018, 57, 7171-7175.
[22] Y. V. Suseela, N. Narayanaswamy, S. Pratihar, T. Govindaraju, Chem. Soc. Rev. 2018, 47, 1098-1131.
[23] E. Largy, A. Granzhan, F. Hamon, D. Verga, M.-P. Teulade-Fichou in Quadruplex Nucleic Acids, (Eds.: J. B. Chaires and D. Graves), Springer Berlin Heidelberg, Berlin, Heidelberg, 2013, pp. 111-177.
[24] B. R. Vummidi, J. Alzeer, N. W. Luedtke, ChemBioChem 2013, 14, 540-558.
[25] A. C. Bhasikuttan, J. Mohanty, Chem. Commun. 2015, 51, 7581-7597. [26] B. Jin, X. Zhang, W. Zheng, X. Liu, C. Qi, F. Wang, D. Shangguan, Anal.
Chem. 2014, 86, 943-952.
[27] H. Lai, Y. Xiao, S. Yan, F. Tian, C. Zhong, Y. Liu, X. Weng, X. Zhou, Analyst 2014, 139, 1834-1838.
[28] L. Zhang, J. C. Er, X. Li, J. J. Heng, A. Samanta, Y.-T. Chang, C.-L. K. Lee, Chem. Commun. 2015, 51, 7386-7389.
[29] V. Grande, F. Doria, M. Freccero, F. Würthner, Angew. Chem. Int. Ed. 2017, 56, 7520-7524.
[30] M. Zuffo, F. Doria, S. Botti, G. Bergamaschi, M. Freccero, Biochim. Biophys. Acta, Gen. Subj. 2017, 1861, 1303-1311.
[31] X. Xie, O. Reznichenko, L. Chaput, P. Martin, M. P. Teulade-Fichou, A. Granzhan, Chem. Eur. J. 2018, 24, 12638-12651.
[32] M. Zuffo, A. Guedin, E. D. Leriche, F. Doria, V. Pirota, V. Gabelica, J. L. Mergny, M. Freccero, Nucleic Acids Res. 2018, 46, e115.
[33] N. C. Sabharwal, V. Savikhin, J. R. Turek‐ Herman, J. M. Nicoludis, V. A. Szalai, L. A. Yatsunyk, FEBS J. 2014, 281, 1726-1737.
[34] A. Renaud de la Faverie, A. Guedin, A. Bedrat, L. A. Yatsunyk, J. L. Mergny, Nucleic Acids Res. 2014, 42, e65.
[35] X. Xie, A. Renvoise, A. Granzhan, M.-P. Teulade-Fichou, New J. Chem. 2015, 39, 5931-5935.
[36] D. Zhao, X. Dong, N. Jiang, D. Zhang, C. Liu, Nucleic Acids Res. 2014, 42, 11612-11621.
[37] A. Kreig, J. Calvert, J. Sanoica, E. Cullum, R. Tipanna, S. Myong, Nucleic Acids Res. 2015, 43, 7961-7970.
[38] A. T. Wright, E. V. Anslyn, Chem. Soc. Rev. 2006, 35, 14-28.
[39] J. R. Askim, M. Mahmoudi, K. S. Suslick, Chem. Soc. Rev. 2013, 42, 8649-8682.
[40] J. Gao, A. Granzhan, X. Qian, K. Severin, Chem. Commun. 2010, 46, 5515-5517.
[41] C. S. Eubanks, A. E. Hargrove, Chem. Commun. 2017, 53, 13363-13366. [42] C. S. Eubanks, J. E. Forte, G. J. Kapral, A. E. Hargrove, J. Am. Chem.
Soc. 2017, 139, 409-416.
[43] S. Stewart, M. Adams Ivy, E. V. Anslyn, Chem. Soc. Rev. 2014, 43, 70-84.
[44] C. A. M. Seidel, A. Schulz, M. H. M. Sauer, J. Phys. Chem. 1996, 100, 5541-5553.
[45] T. S. Dexheimer, D. Sun, L. H. Hurley, J. Am. Chem. Soc. 2006, 128, 5404-5415.
[46] J. Dai, D. Chen, R. A. Jones, L. H. Hurley, D. Yang, Nucleic Acids Res. 2006, 34, 5133-5144.
[47] S. Amrane, A. Kerkour, A. Bedrat, B. Vialet, M.-L. Andreola, J.-L. Mergny, J. Am. Chem. Soc. 2014, 136, 5249-5252.
[48] C. Rehm, I. T. Holder, A. Groß, F. Wojciechowski, M. Urban, M. Sinn, M. Drescher, J. S. Hartig, Chem. Sci. 2014, 5, 2809-2818.
[49] A. T. Phan, V. Kuryavyi, H. Y. Gaw, D. J. Patel, Nat. Chem. Biol. 2005, 1, 167-173.
[50] A. T. Phan, V. Kuryavyi, S. Burge, S. Neidle, D. J. Patel, J. Am. Chem. Soc. 2007, 129, 4386-4392.
[51] K. W. Lim, S. Amrane, S. Bouaziz, W. Xu, Y. Mu, D. J. Patel, K. N. Luu, A. T. Phan, J. Am. Chem. Soc. 2009, 131, 4301-4309.
[52] N. Smargiasso, V. Gabelica, C. Damblon, F. Rosu, E. De Pauw, M.-P. Teulade-Fichou, J. A. Rowe, A. Claessens, BMC Genomics 2009, 10, 362.
[53] E. Belmonte-Reche, M. Martínez-García, A. Guédin, M. Zuffo, M. Arévalo-Ruiz, F. Doria, J. Campos-Salinas, M. Maynadier, J. J. López-Rubio, M. Freccero, J.-L. Mergny, J. M. Pérez-Victoria, J. C. Morales, J. Med. Chem. 2018, 61, 1231-1240.
[54] E. Chargaff, R. Lipshitz, J. Am. Chem. Soc. 1953, 75, 3658-3661. [55] P. Anzenbacher Jr., P. Lubal, P. Bucek, M. A. Palaciosa, M. E. Kozelkova,
Chem. Soc. Rev. 2010, 39, 3954-3979.
Entry for the Table of Contents
FULL PAPER
Text for Table of Contents
Michela Zuffo, Xiao Xie, Anton Granzhan*
Page No. – Page No.
Strength in Numbers: Development of a Fluorescence Sensor Array for Secondary Structures of DNA