MIT LIBRARIES 3
9080 02618 4603
I I ' .1,ma
f")\r'u,
ii/i i';ff
^itihf^ Ino
MM^*^'^^
DEWEY
MIT
Sloan
School
of
Management
MIT
Sloan
Working
Paper
4474-04
January
2004
Costly
Dividend
Signaling:
The
Case
of
Loss
Firms
with
Negative
Cash Flows
PeterR.Joos
and
George
A. Plesko©
2004 byPeter R. JoosandGeorge A.Plesko.Allrightsreserved.Short sectionsoftext,nottoexceed twoparagraphs,
may
be quotedwithoutexplicitpermission,providedthatfullcreditincluding
©
noticeisgiventothesource. Thispaper alsocan bedownloadedwithoutchargefromtheSocialScienceResearchNetworkElectronicPaperCollection:
!
MASSACHUSETTS
INSTITUTEi OF
TECHNOLOGY
DEC
3im
Costly dividend
signaling:
The
case
of
lossfirms with
negative
cash
flows
PeterJoos
and
George
A. PleskoFirstDraft:
November
2003
ThisDraft:January
2004
Abstract
We
examine
the dividend-signalinghypothesisin asample offirms forwhich
dividendincreases are particularly costly,
namely
loss firms with negative cash flows.When
compared
tolossfirmswithpositivecashflows,we
findthepredictivepower
of dividendincreases for future returnonassetstobegreaterforlossfirmswithnegativecashflows, consistentwiththepredictive
power
ofthedividendsignalbeingstrongerwhen
itscostishigher.
Our
results provide support for the dividend-signaling hypothesisand
have broaderimplications sincelossfirms comprisea largeand
increasingshareof publicly-traded firms.Contactinformation:
Sloan Schoolof
Management
MassachusettsInstituteofTechnology
E52-325,
50
Memorial
Drive Cambridge,MA
02142-1347
Joos: 617-253-9459,
pioos@mit.edu
(correspondingauthor) Plesko: 617-253-2668.gplesko@mit.edu
Whether
firms signal futureprospectsthroughdividendchanges hasbeenasourceof
debateand
researchinthecorporate financeliteraturesince the earlypapersby
Lintner(1956)
and
Millerand
Modigliani(1961). Despite considerableresearch, thedebate overtheempirical validityofthedividend-signalinghypothesisremainsaliveintheliterature.
Nissim
and
Ziv (2001) present evidence consistent with the dividend-signalinghypothesis
by
showing
dividend increases (but not decreases) relate to fiiture profitability.However, two
recentpaperscome
todifferentconclusions. Grullonetal. (2003) arguetheresults inNissim and
Ziv (2001) followfrom
amisspecificationofthe earnings expectationsmodel
used topredictexpectedearnings.They
find theevidence supportingthedividend-signalinghypothesis disappearswhen
theearnings expectationsmodel
accounts fornon-linear patterns in the behaviorofearnings.' In amore
generalreview of dividend policy. Skinner (2003) concludes structural changes in dividend
policy
and
thenatureofcorporateearnings over timeruleout signaling,atleast inrecentdecades.
He
finds dividends havebecome
toosmooth and
earnings too volatile fordividendchangestobe an informativesignal for futureearnings changes.
Although not conclusive, this recentempirical evidence appears to be
moving
towardsrejecting the dividend-signaling hypothesis.^ Inthispaper,
we
contributetothedebate with a different approach to test the dividend-signaling hypothesis. Instead of
examining
dividend behavior for all firms in the market,we
examine
thedividend-signalinghypothesisina setting
where
useof dividendstosignalisparticularly costlytothefirm.
Spence
(1973) argues the cost of sending aneconomic
signal determines itsincrease their dividend
payment
(i.e., cash outflow) while experiencing current lossescaused
by
negativecash flows.^We
arguethat, since investorscanreadilyobservethe current loss and its components,management
will need to send a strongand
credible signal to convincemarketparticipants thatperformancewillimprove.We
assume
thatincreasingcash dividendsatatimethefirmhasanegativecash flowconstitutes astrong
and
costly signal offuture performance fortwo
reasons. First, the increase in currentcashdividendswillimmediatelyaffectthe liquidityofthefirm. Second,anincrease in
thecashdividendimpliesa strong
commitment
tomaintainthehigherlevelof dividendsinthefuture,given previousstudies
document
areluctanceofmanagers
tocutdividends(e.g.,Lintner1956
and
Brav
etal.2003).We
testour hypothesisby comparing
thepredictivepower of
dividendincreasesbetween
loss firms with positiveand
negative cash flowcomponents
for futureperformance.
We
collectasample oflossobservationsfrom 1970-2001and
testwhetheradividendincreaseprovides incremental informationinpredicting firms' return
on
assetsbeyond
thatcontainedincurrentearningsand
anumber
ofcontrol variables.Our
main
resultsshow
that, condifioningon
cash flows, the signalingpower
of dividendincreases for loss firmsexistsonlyfornegativecashflowfirms,consistentwiththehypothesisthatthecostlierthesignalisthe
more
informationitcontains.We
verifyour
main
results in additional analyses focusingon
subsamples offirms with multiple losses forwhich
increaseddividend pajmientsareincreasingly costly,and
on
augmented
specificationsof ourbasicmodel.
Although
some
resultsareconsistentwithalossbeingsufficient for adividendincreasetoimproveforecastsoffuturereturns irrespectiveofthe sign of the cash flow, all robustness analyses demonstrate the predictive
power
ofdividendincreasesislargerforloss firmswithanegativecash flow thanforlossfirms
withapositivecashflow.
Our
study extends the dividend signaling literatureby
identifying a particularsegment
of firms forwhich
we
hypothesize the decision to increase dividends isparticularly costly. Consistent with Spence'scriterion for informative signals,
we
finddividends helptopredicta firm'sfiitureperformance
when
thedividendsignaliscostly.We
also extend previous researchon
the relationbetween
lossesand
dividendsby
focusing
on
the particularquality oflosses thatrenders the dividend signal costlyand
credible,
namely
thecashflowcomponent
oftheloss.In thenextsection,
we
discuss relatedresearchand
motivateourstudy. InsectionII
we
provide descriptive statisticsof
thesample
and
present our empirical model.SectionsIII
and
IV
containourmain
resultsand
theresults of robustnessanalyses.We
concludeinafinalsection.
I.
Background
and
motivationTo
testthedividend-signalinghypothesis,we
evaluate the predictivepower
of anincrease in cash dividendsforfuture firmperformance ina sample
of
firms thatreport current losses.We
argue the cost of the dividend signal will determine its informativeness and distinguishbetween
losseswith a negative versus a positive cashflow
component
tocapture thedifferentialcostofthedividendincreaseacrossloss firms.We
arenot thefirsttoinvestigate the relafionbetween
dividendsand
losses.LikeDeAngelo
etal. (1992) [hereafter,DDS],
we
focuson
loss firmsto studythe dividend-signaling hypothesis,arguingthatdividendswill have informationcontentwhen
currentearnings areanunreliable indicatoroffutureprofitability,
and
thatlossesprovidesucha specialcontext. In asample of 167firmsovertheperiod 1980-1985,DDS
show
alossisa necessary, but not sufficient, condition for a firm to decrease dividends.
They
find firms that decrease dividends experiencemore
severeand
more
persistent losses than firmsthatdo
not.Further,unusualincome
items(e.g.,specialitems) area larger factorinthe earningsoflossfirmsthat
do
notreduce dividends thanofthefirms that do. Focusingexplicitly
on
dividend signaling, they find dividend decreases provide incremental informationtopredict futureearnings,althoughtheirforecastingpower
diminishesinthepresenceof unusual
income
items.Using
a larger sample over a longtime period. Skinner (2003) finds thatwhen
firmspayinglargedividends experiencealoss,the lossis
more
likelycausedby
special items,and
more
likely toreversethana lossreportedby
a firmthat does notpay
large dividends. In related work, Joosand
Plesko (2003)examine
a largesample
oflossfirms,
and
thetiming oflossreversals.They
show
the lossesoffirms thatcontinuetopay
dividendsare
more
likely toreverse thanthose of non-dividendpayingfirms,and
thateliminating adividendisassociatedwithadecreaseinthelikelihood the loss will reverse
inthe
immediate
future.^We
extendthis lineofresearchby comparing
whetherincreasesincash dividendsby
loss firms signal future performance betterwhen
negative cash flows rather than negative accruals drive theloss.Whereas
previousresearch focuses specificallyon
the role ofspecial itemswhen
studying the relationbetween
dividendsand
losses,we
differentiate
between
losseswitha positiveand
negative cash flowcomponent
tocapture therelativecostofthe decision to increasedividend cashoutflows.The
evidenceinJoosand
Plesko (2003)showing
losseshave
become
more
persistentinrecent years,oftendue
to persistent negative cash flows, emphasizes thepotential cost of an increase in cash dividendsforlossfirms.
The most
recent paperson
the dividend-signaling hypothesis find a reducedsignaling rolefor dividendsovertime, consistentwithfindingsthatfirms have
changed
their dividend-paying behavior (see Skinner
2003)7
In light ofthe evidence ofthereducedsignaling role of dividends ina general cross-sectional time-series context,
we
complement
theliteratureby
focusingon
anarrowersettingthatprovidesa powerfiiltestofthedividend-signaling hypothesis.
II.
Sample
constructionand
descriptivestatisticsOur
sample
consists of firm-yearobservationsfrom
Compustat's Industrialand
Research
Annual Data
Basesfortheyears 1971-2000. ConsistentwithHayn
(1995)we
defineour earningsvariable as
income
(loss)before extraordinaryitemsand
discontinuedoperations or
IB
(annualCompustat
data item #18).We
definetwo main
variables tocapturedividend
payments by
the firm.We
defineDIVCF
asthetotaldollaramount
of cash dividends paidby
the firm (annualCompustat
data item #21).^We
focuson
(changesin) thetotal
amount
paidratherthandividends persharetobeconsistent with ourview
thatthetotaldividend cash outflowestablishes the cost to afirm alreadyfaced with bothalossand
a negativecash flowina particular year. Sinceitispossiblethatthedividend cash outflow in a particular year increase without dividends per share being
affectedifthefirm's
number
of outstandingshareschanges,we
define asecondvariabledataitem#25).
TableIpresents descriptiveinformationforthesample. Panel
A
shows
ourinitial samplecontains206,420 firm-year observations: 146,394profitobservationsand
60,026loss observations
(29.08%
ofthe total).The
panel flirthershows
a relationbetween
dividend
payments and
loss occurrence: consistentwith the evidenceinSkinner (2003)we
find dividend-paying firms are less likelyto incur losses than non-dividend-payingfirms. Focusingfirst
on
thedividendpayments
of ourfirm-year observationsintheyearprior to the current observation,
we
observe 117,618 firm-year observations withno
dividends
and
88,802 firm-yearobservations with cashdividends.Of
thefirms thatpay
no
dividends44.43%
incur a currentloss;by
contrast,ofthedividend payingfirmsonly8.74%
incur a currentloss.The
contrastbetween
dividend-payingand
non-dividend-payingfirms
becomes
sharperwhen
we
focuson
thecontemporaneous
relationbetween
dividend
payments and
firm profitability: ofthe firm-year observations not paying a dividend,45.90%
have acontemporaneous
loss,compared
to only6.69%
offirms currentlypayingdividends.Panel
B
provides adescriptionof dividendchanges occurringin our sample. In theftiUsamplethemajorityoffirmsneverchange
theirdividend payments:measured
astotal cash outflow (or per share)
56.49%
(54.40%) offirm-year observationsdo
not change dividends in a given year,33.00%
(28.85%) increase dividends, and10.51%
(16.75%) decreasedividends.
The
percentageschange significantlywhen
we
partition the samplebetween
profit and loss firm-year observations: profitable firms increasedividends
payments
farmore
oftenthanlossfirms.By
contrast,the largemajorityofloss firmsdo
notchange
theirdividendpayments (86.98%
or86.04%
dependingon
whetherwe
measure
dividendsastotal cash outfloworpershare).The
high percentagereflectsthefactthatlossfirms are less likelyto
pay
dividends,andthatonlyasmallfractionoflossfirmsthat
pay
dividendsincreasedividendpayments (4.20%
or3.80%
dependingon
how we
measure
thedividendvariable).Panel
C
in Table I cross-tabulates ourtwo
measures of dividend changes.The
diagonal percentages in panel
C
show
that in the vast majority ofcases both proxiesreflectthe
same
directionof dividend change.However,
changesinthenumber
ofshares outstanding, with or without a constant dividend per share, can lead to non-zerooff-diagonalpercentages. For example,
we
observethat in20.54%)ofcases firm'stotalcash dividendpayments
increaseina particular year, yet thedividend pershare variableshows
adividenddecrease.
Such
a combination istheresult of an increasein thenumber
ofsharesinthe
same
year (e.g., as a resultofequityissuances orstock optionexercises).The two
variablesthereforecomplement
eachother asproxies fordividenddecisionsby
management.
While
we
focus primarilyon
the dollarvalueof dividend payments,sinceit best captures the
amount
of cash the firm is using,we
present results using bothvariables toillustratethesignaling roleof dividendincreases.
In Table II,
we
present evidence for ourmain
variables ofinterest. Sincewe
hypothesizethatthesignofthecashflowcomponent
of negative earningswilldeterminetherelativecostofadividendincrease
we
presentourdescriptivestatistics forasample oflossobservations partitionedby
thesignofthecashflowcomponent
ofthelosses.We
define the cash flow
component
of earnings(CFO)
as cash flow from operations,measured
asnetincome
(annualCompustat
dataitem# 172)lessaccruals.We
measure
(data item #5)
+ ADebt
in Current Liabilities (data item #34)+
Depreciationand
Amortizations(dataitem#14).Panel
A
of TableIIshows
themean,
standard deviation,and median
for four variablesofinterest. First,we
define Size asmarket value ofthefirm (stock pricetimesthe
number
of outstanding shares, orannualCompustat
dataitem#199*data item #25).Second,
we
defineROA
as earnings before extra-ordinary itemsand
discontinuedoperations (or
IB
asdefinedbefore) scaledby
laggedtotalassets{TA, annualCompustat
dataitem#6). Third,
we
defineCFO
asbefore. Finally,we
includeSPI, or specialitems (annualCompustat
data item #17) scaledby
lagged assets {TA,.i), in the Panel sincepreviousresearch singles out
SPI
asthe specificcomponent
oflosses relatedtoboththe qualityoflosses(i.e.,degreeofpermanence)
andthe dividend-payingbehavioroffirms(Skinner2003).
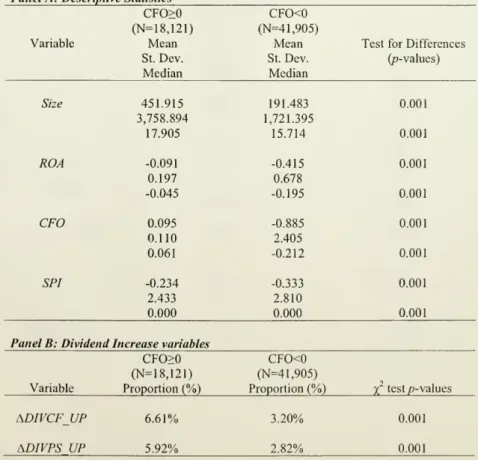
Panel
A
reports significant differencesbetween
themeans and medians
ofthetwo
subsamples (based
on
two-sided t-testsand
two-sidedWilcoxon
tests forthemean
and
median)
asafiinctionofthesignoftheircash flow component. Generallyspeaking, lossobservations with a positive cash flow are larger
and
exhibit stronger profitability(smaller losses)than loss observationswith a negative cash flow
component.
Positivecash flow loss firms
on
average also report less negative SPI, withboth types oflossfirmshaving
median
SPI of
zero though. Alldifferencesbetween
means and medians
arestatisticallysignificant.
Panel
B
of Table IIprovides descriptive statisticson
the incidence of dividendincreases in the sample ofloss observations as a functionofthe signofthe cash flow
thattakes the value of1 ifthe
change
in dividend cash outflow (dividend payout pershare)ispositive,
and
zero otherwise,withDIVCF
and
DIVPS
asdefinedbefore. PanelB
shows
a significantlysmallerproportionoflossobservationswithanegativecashflowcomponent
increases dividends, consistent with a dividend increase being costly:regardless ofthe dividend variable used, the percentage ofpositive
CFO
loss firms increasing theirdividendsismore
thantwicethepercentageof negativeCFO
lossfirms.Table11provides evidenceconsistentwithloss observations beingdifferentasa
fiinction
of
the sign ofthe cash flowcomponent
ofthe loss: a negative cash flowcomponent
suggests a greater deterioration in profitabilityand
a lower incidence ofdividend increases. In Table III,
we
formally test the relationbetween
currentprofitability, the signofcurrentcashflows,
and
(changes in) dividendpayments
in thesample ofloss observations. Specifically,
we
estimate a logisticregression to evaluate the relation of profitabilityand
itscomponents
to the decision to increase current dividends. Focusingon
ourtwo
dividend variableswe
estimate the following four specifications:Prob
(ADIVCFJJP) =
og+
a,ROA,
+
asCFONEG,
+
asROA,*CFONEG,
+
a^LSize,
+
Si (1)Prob
(ADIVPSJJP) =
bg+
biROA,
+ b2CFONEG, +
bjROA,*CFONEG,
+
b4LSizet+
82 (2)where
ADIVCFUP,
ADIVPSUP,
ROA
are asdefinedbefore;CFONEG
isanindicatorvariable equal to
one
ifthe firm reports a negative cash flow,and
zero otherwise;variables ofinterest,
ROA,
CFONEG,
and
the interactionbetween
both variables,we
include a control variable for the sizeofthefirmineachspecificationsince
Hayn
(1995) and Joosand
Plesko (2003)relate the sizeofthe firmto thepersistenceofthe lossandtherefore the potential costofadividendincrease.
Our
sizevariableisLSize, thelogofthemarket value ofthefirm.
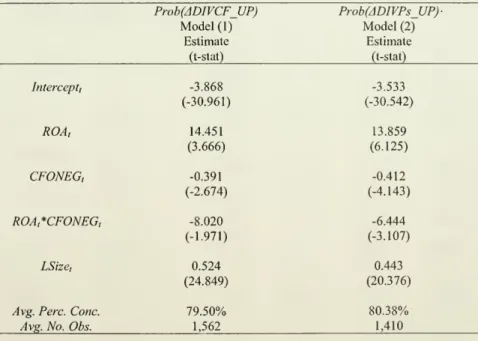
Table IIIreports the results ofestimating
models
(1)and
(2) usingthemethod
detailed
by
Fama
and
Macbeth
(1973). Inbothmodels
the coefficienton
ROA
ispositiveand
highly significant, consistent with a relationbetween
higher profitabilityand
dividendincreases.
However,
the negative coefficienton
CFONEG
indicatesthat, onaverage, loss firmswith negative cash flows are less likely to increasetheir dividend. Further, the negative and significant coefficient
on
ROA*CFONEG
shows
that the relationbetween
higherprofitabilityand
dividend increasesinthefullsample
issmallerfor firms with a negative cash flow.
The
size control variable has a positiveand
significant coefficient, suggesting that larger firms are
more
inclined to increasedividendsinthecurrentlossyearregardlessofthesignofthecashflow.^
Insum,theanalysesinTablesIthroughIIIsuggesta positive relation
between
a firm's profitabilityand
its propensity to increase dividends. Focusingon
lossobservationsinparticular,
we
findthepresence ofanegativecashflowcomponent
oftheloss reducesthe probabilityofadividend increase,consistentwith negative cash flows fromoperations increasing the costofadividendincrease.
III.
Do
dividend increases forecast futureprofitability?To
examine
whethercostlydividendincreases constitutestrong signalsoffiatureprofitability
we
estimate an earnings forecastingmodel
in our sample of lossobservations. Since
we
arguethatincreasesindividend outflows aremore
costlywhen
cash flows are negative,we
predict the decision to increase dividends is a stronger predictoroffutureprofitability fornegative cash flowloss firms than forpositivecash flowloss firms.We
considertwo
forecasthorizons,one and
three years,and
focuson
futureaccountingprofitability
by
estimating thefollowingparsimonious models:'"AROA,+r
=
ao+
a,CFONEG,
+
ajROA, +
ajADIVCF_UP,+
a4
ADIVCF_UP*CFONEG,
+05
SPI,+
a^ LSize,+
83 (3a)AROA,^,
=
Po+
/^iCFONEG,
+
yff,ROA, +
y9jADIVPS_UP,+
P4
ADIVPS_UP*CFONEG,
+^5
SPI,+
PeLSize,+
£3 (3b)We
define futureprofitability as average ftitureROA
overthe forecast horizon:AROA,+^=(Z,+r ROA,+/t,
where
t=1 or 3)and
estimatemodels
(3a)and
(3b).The
firstspecification (3a) focuses
on
increases inDIVCF,
and
the second (3b)on
increasesinDIVPS.
ROA^
SPI,CFONEG,
LSizearedefinedas before.Our
main
variablesofinterestin
model
(3) are dividend increases(ADIVCFUP
orADIVPSUP),
and
dividendincreases interacted with the negative cash flow indicator variable
CFONEG.
If ourprediction that the decision to increase dividends is a stronger predictor of future
profitabilityfornegative cash flow loss firmsthanforpositive cashflow lossfirms, a^
and
^4willbothbepositiveand
significant.We
include controlsforcurrentprofitability (ROA), special items,and
size.We
include special items {SPI) for the reason
mentioned
earlier,namely
that previousresearchrelates
SPI
to both the qualityoflosses (i.e., degree ofpermanence)
and thedividend-paying behavior offinns (Skinner 2003).
We
include LSize to control forpotentially omitted variables such as risk or growth ofthe firm.
We
estimate bothspecificationsusingthe
Fama-MacBeth
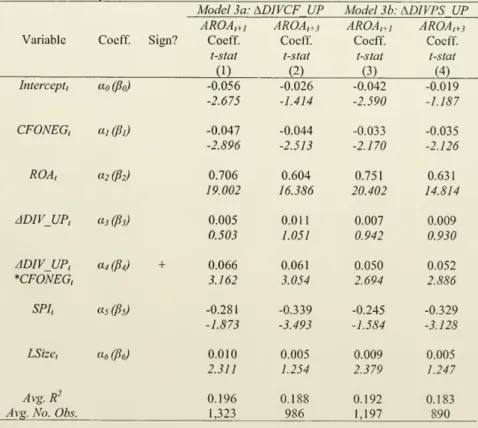
methodology.Table
IV
presents theresultsofthe estimationof equations(3a)-(3b). All four estimationresults(columns(1)through(4)),focusingon
differentdividendmeasuresand
forecast horizons,
show
thesame
result for the dividend increase variables: the coefficients asand
/5jon
the dividendincrease variables are not significant, indicatingthat a dividend increase for loss firms with apositive cash flow
component
does notsignal future profitability controlling for other factors in the model.
By
contrast, the coefficients a^and
y9^on
the dividend increase variable interacted withCFONEG
are positiveand
significant in all specifications. Inuntabulated analysis,we
also find thesum
ofOi+a^ and ^3+^4
arepositiveand
statisticallysignificantinallspecifications.The
evidence isconsistent with dividend increases signaling futureprofitability, even after
controlling forotherfactors,
when
thecash flowcomponent
oflossesisnegative. Thisfindingsupports the hypothesisthat dividendincreases constitutean informative signal
when
the costofthe signalisrelativelyhigh.Table
IV
alsoshows
the coefficientson
CFONEG
{aj or ^/) are negativeand
significant in all four specifications, consistent with losses with negative cash flows
signaling persistent profitabihtyproblems(see alsoJoos
and
Plesko2003).By
contrast,the coefficients
on
ROA
(a2or ^2) are positiveand
highly significantinallspecifications, consistentwiththepreviousfindingson
theserialcorrelationandmean
reversionofROA
(e.g., Sloan 1996).
The
coefficientson
SPI
(as or (is) are negative in all fourspecifications,butthe levelofsignificance variesdepending
on
the forecast horizon: the coefficients aremarginallysignificantinthe one-year horizonmodels
(columns (1)and
(3)),but highlysignificantoverthethree-yearhorizon (columns(2)
and
(4)),suggestingspecial items affect firm profitability
more
over the longer horizon,and
are lessinformative overtheshorterhorizon. Finally, sizepredicts fiitureprofitabilityonlyone year ahead (columns(1)
and
(3)),but not threeyearsahead (columns(2)and
(4)).In
summary,
theresultsforbothdividendvariablesand
bothforecasthorizonsareconsistentwitha dividendincrease providing information
on
the futureperformance oflossfirms only
when
currentcash flows arenegative.We
interprettheresults toindicate theusefulnessofadividendincreasetosignalfuturefirmperformanceisdirectlyrelatedtotheexpectedcostofthedividendincrease.
IV.
Robustness
analysesWe
carryout three (unreported)analysesto testthe sensitivityand
robustnessof ourfindings. Inourfirstanalysis,we
focuson
asubsample
offirmswithmore
thanone
sequential loss, omitting observations for
which
the current loss is precededby
a profitable year.We
assume
that forthesefirms the costto increasedividendsshouldbegreaterthanforfirmsexperiencingafirstloss."
We
findchangesindividendsvaryasafianctionof whethera lossisthefirstloss(i.e.,the prior year'searnings
were
positive) orwhether the loss is
one
in a sequence (a repeat loss):10.38%
(9.08%) of first lossobservations increase dividend cash outflows (dividend cash outflows pershare) versus
1.44%
(1.27%) ofrepeat loss observations. This finding is consistent witha string oflosses revealingcontinuingprofitabilityproblems,
making
itmore
difficult forthe firmtoincrease dividend payments.
The
proportion ofrepeat losses with negative cash flows (74.90%) is also largerthan the corresponding proportion offirst losses with negativecash flows (58.60%). Repeat losses with negative cash flows also exhibit lower
profitabilitythanthosewitha positivecashflowcomponent.
The
descriptiveevidencesuggests the decisiontoincreasedividendswhen
afirm faces repeat losses constitutes apowerfulsignalregardlessofthe signofthecash flow.The
existence of such a strong signal forall multiple loss firms could diminish the signalingvalue ofa dividendincrease forloss firms with negativecash flows.We
re-estimate the predictiontestsin the sample ofrepeat lossobservations
and
observethat,consistent with our conjecture that increasing dividends
when
facing repeat losses iscostly evenforpositive
CFO
firms,the coefficients ajand
P}become
significant(atthe10%
level) in the one-yearmodels
but not in the three-yearmodels.More
important though, consistentwith our previousresults, the coefficients a4and
P4in(3a)and
(3b)remainpositive
and
significantinallspecifications. Allotherresultsremainqualitatively thesame.In a secondanalysis,
we
include additional control variables in (3a) and(3b)tocapture the levelofliquidity
and
recentgrowth ofthe firm.We
include cashand
short-termsecuritiesscaled
by
assets(annualCompustat
dataitem#1 scaledby
dataitem #6)as a
proxy
for liquidityand
the logofSales/Salesi.i (whereSales isannualCompustat
dataitem #12)as aproxyforgrowth.
When
we
includebothvariablesinthemodels,we
findthe coefficient
on
liquidityisinsignificantinallspecifications,whilethe coefficienton
thegrowth
proxyispositiveand
significant(atthe5%
level) inallspecifications.As
in theprevious robustnesstest, the coefficientsaj
and
fijbecome
significant atthe5%
level intheone-year horizon
models
(correspondingtocolumns
(1)and
(3) inTableIV), butremain insignificant inthe three-yearhorizonmodels. Throughout,the coefficients a4and
^4 remain positiveand
significant in all specifications, reinforcing the stronger predictive role for fiiture profitability of dividend increaseswhen
the cash flowcomponent
oflossesisnegative. Allotherresultsremainqualitativelythesame.In a final test,
we
re-estimate (3 a)and
(3b) in separate samples of lossobservations determined
by
the sign of cash flows. That is, ratherthan incorporatingCFONEG
and
the interaction term,we
estimate a simplifiedversionof(3a)and
(3b) inseparate samples, allowing the coefficients
on
ROA,
SPI,and
LSize to vary in both samples.The
procedure allows usto evaluatewhetherthe coefficientson
the dividendincrease variable
and
on
the interactionterminModels
(3a)and
(3b)capturedifferentialforecasting
power
oftheother variablesincludedintheequationwith'fixed'coefficients.Our
estimationsshow
thatthe coefficients a^and
^2on
ROA
varyasafunctionofthesignofthecash flow
component
oflosses;the coefficientson
SPI and
LSizehowever
arenotdifferent across the subsamples.
The
coefficienton
the dividend increase variable issignificantatthe
5%
levelin allspecifications,indicatingthatdividendincreases signal futureprofitabilityirrespectiveofthe signofthecash flowcomponent
ofthelosswhen
we
estimate themodels
inseparatesubsamples.Most
importantlythough,in supportof ourpredictionand
previous results, the magnitude ofthe coefficienton
the dividendincrease variable remains significantly larger in the subsample of negative
CFO
lossfirms thaninthesubsample ofpositive
CFO
losses.Summarizing,theresultsoftheadditionalanalysesinsubsamplesoflossfirms or
for different specifications of
Models
(3a)and
(3b) are all consistent with dividendincreases
by
loss firmsbeingmore
informativeabout futureprofitabilitywhen
thecashflow
component
ofthe lossisnegative thanwhen
itispositive.We
interpretourresultstoindicatethatthe
more
costlyadividendsignalis,themore
informativethedividendis aboutthe firm'sftitureperformance.V.
Conclusion
This paper provides
new
evidenceon
the role of dividends in signaling firms' future performance.We
examine
whether firms that report a current lossand
have a negativecashflowsignalftitureperformance ofthefirmthroughcostlyincreasesincashdividends.
We
distinguishbetween
losses determinedby
negative cash flows versusnegative accruals to capture the cost ofa current dividend increase.
We
argue thatincreasingdividend
payments
when
thefirmisalready losingmoney
constitutesa strong signaloffiatureperformancefortwo
reasons. First,theincreaseincurrentcash dividendsaffectsthecurrentliquidityofthefirm. Second,theincreaseincashdividendsimplies a strong
commitment
to an increased level of dividend cash outflows in the fiature sincepreviousresearch
documents
ahighreluctanceofmanagers
tocutdividends.The
evidencein thepaperstrongly supports thehypothesis thatcostly dividendincreases
by
loss firmswith negative cash flowsconsistently predict future measures of performance betterthan dividendincreasesby
other loss firms.While
recent empiricalresultshave discounted the role of dividendsas a signaling
mechanism
in large cross-sectional samples(Benartzi etal. 1997, Grullon etal. 2003, Skinner 2003), ourresultssuggest costly dividend increases are informative for a
narrow
group of firms. Fornegativecashflowlossfirms,theuseof cashto
pay
a dividend,ratherthantoreinvestintheongoingoperationsofthefirm,suggests
management
judgesthe prospectsofthefirmtobe good, even thoughcurrentearningsarenot.
Our
focuson
lossfirmshasbroaderimplications as researchshows
thatlossfirmscomprisea large
and
increasingshareofpublicly-tradedfirms(e.g.,Hayn
1995,Joosand
Plesko 2003, Skinner 2003). Therefore, an increasingly larger set of
managers
isconfi-onted with reporting negative earnings that are generally
much
less informative aboutfutureperformance ofthe firm.As
aresult,theyface theneed
torelyon
additionalmechanisms beyond
reportedprofitabilitymeasurestoprovideinvestorswith informationaboutthefirm'sprospects.
References
Aharony, Joseph,
and
Itzhak Swary, 1980. Quarterly dividendand
earningsannouncements and
stockholders' returns:An
empirical analysis.Journalof
Finance,35, 1,1-12.
Asquith, Paul,
and David
W.
MuUins,
Jr, 1983.The
impact of initiating dividendpayments on
shareholders' wealth.Journalof
Business, 56, 1,77-96.Bemartzi,
Shlomo,
Roni
Michaely,and
RichardThaler, 1997.Do
changes individendssignalthe future or the past?Journal
of
Finance,52,3,1007-1043.Brav, Alon, John R.
Graham, Campbell
R. Harvey,and
Roni
Michaely, 2003, Payoutpolicyinthe21stcentury.
Working
paper.Duke
University.DeAngelo,
Harry, Linda E.DeAngelo, and Douglas
J. Skinner, 1992. Dividendsand
losses.Journal
of
Finance,47, 1837-1863.DeAngelo,
Harry, Linda E.DeAngelo, and Douglas
J. Skinner, 2003.Are
dividendsdisappearing?dividendconcentration
and
theconsolidationofearnings.Forthcoming
Journal
of
FinancialEconomics.Fama, Eugene
F.,and
Kenneth
R.French, 2001. Disappearingdividends:changingfirmcharacteristicsorlower propensitytopay? Journal
of
FinancialEconomics,60, 3-43.Fama,
Eugene
F.,and James
D.MacBeth,
1973. Risk, returnand
equilibrium:Empiricaltests.Journal
of
PoliticalEconomy,
81,607-636.Grullon, Gustavo,
Roni
Michaely,Shlomo
Benartziand
Richard H. Thaler, 2003. Dividend changesdo
not signalchanges infutureprofitability.Working
paper.RiceUniversity,CornellUniversity,Universityof Chicago.
Hayn,
C,
1995.The
information content of losses. Journalof
Accountingand
Economics,20, 125-153.
Healy, Paul. M.,
and
Krishna G. Palepu, 1988. Earnings informationconveyed by
dividendinitiations
and
omissions.Journalof
FinancialEconomics, 21,2, 149-175.Joos,Peter,
and
George
A. Plesko,2003. Lossreversals,and
earnings-basedvaluation.Working
paper,MIT.
Lintner, J., 1956. Distribution of
incomes
ofcorporationsamong
dividends, retained earnings,and
taxes.American
Economic
Review,46, 97- 113.Miller,Merton,
and
Franco Modigliani, 1961.Dividendpolicy, growth andthevaluationMiller, Merton,
Kevin
Rock, 1985, Dividend policy under asymmetric information Journalof
Finance,40, 1031-
1051.Nissim, Doron,
and
Ziv,Amir, 2001. Dividend changesand
futureprofitability.Journalof
Finance, 56,2111-2133.Sloan,Richard, 1996.
Do
stock pricesfully reflectinformationinaccrualsand
cash flowsfor futureearnings?
The Accounting
Review, 71,3, 289-315.Skinner,
Douglas
J., 2003.What
do
dividendstellus aboutearnings quality?Working
paper, University of
Chicago
Graduate School of Businessand
University ofMichigan
BusinessSchool.Spence, Michael, 1973.Jobmarketsignaling.
The
QuarterlyJournalofEconomics,
87,3,355-374.
Watts,Ross, 1973.
The
informationcontentofdividends.Journalof
Business, 46,2,191-211.
Earlier
work by
Benartzietal. (1997)discusseshow
previous empiricalwork
provides evidencethemarkettreatschangesindividendsasnewsworthy
(seeAharony and Swary
1980, Asquith
and
MuUins
1983).They
also point out it is not clear that dividend changessignal futureearnings changes,as thehypothesispredicts.The
authorsconclude changes in dividendssummarize
information about the past,namely
past earnings increases,ratherthanthefuture,i.e.,upcoming
earnings increases.Other
examples of
studies thatfailtofindevidenceor findevidencethatismixed on
the question whether dividend changesmap
intofuture earningschanges areWatts (1973),Healy and
Palepu(1988),DeAngelo
etal.(1992)." Previousresearch
proposescostsassociatedwithdividend payments,for
example
Millerand
Rock
(1985) arguethesignaling costof
dividendsisforgone investment.However,
we
know
ofno
researchthatstudies thepower
ofthedividendsignal asaftinctionoftherelativelevelofthecost.
Skinnerdefines largedividend-payingfirms as firms
whose
dividendisinthe top quartileof dividends paidineach decade.^
Note
the results inJoosand
Plesko (2003)
and
Skinner (2003) are at odds withthe findinginBenartzi etal. (1997)"thatdividendcuts reliably signal anincreasein fiitureearnings."(p. 1031-1032, emphasisintheoriginal).
DDS
reportthatdividendreductionsoccurlessoftenwhen
the lossesincludeanaccrual for special items, butdo
not differentiate whether the underlying loss is drivenby
accruals or cash flows. Further, the results ofBenartzi et al. (1997) suggest that if
dividendshave
any
signalingpower,itisthrougha reduction,ratherthananincrease.^
The
findingsofFama
and
French (2001)
who
report adecreaseintheproportion ofdividend-payingfirmsinthe
US
over timeand
DDS
(2003)who
show
a large increaseintheconcentrationof dividend
payments
over timealsounderline thechangesindividend-paying behavior of
US
firms.^
We
winsorizeallvariablesofinterest atthe1st
and
99' percentile.' In unreported analyses,
we
estimate additional specifications ofmodels
(1) and (2).
Specifically,
we
also include SpecialItems inone ofthe specificationsand
findthatthey obtain a significant negative coefficient, whereas the other resuhs remain qualitativelyunchanged. Similarly,
we
includeanindicatorvariable todistinguishbetween
firstandrepeat losses
and
find a positive coefficient on this variable, with all other resultsremainingqualitativelyunchanged. Finally,
we
alsoestimate a versionofmodels
(1)and
(2) that includes a control variable forthedividendpolicyofthe firm sinceunreportedanalysis
shows
theincidenceof dividendincreasesrelates towhetherthefirmpreviously paidadividendornot:we
includeanindicatorvariablethattakeson
thevalueof one ifthe firmpays adividend(i.e., annual
Compustat
data item #21 islargerthanzero),andzerootherwise
and
findtheresultsdo
notchangequalitatively.We
alsoestimatetwo-year horizonmodels
with results similarto the oneand
three-yearhorizon models. Also, consistentwith previousresearch
we
focusonthe predictionof an accounting variable only (e.g.,
Nissim and
Ziv 2001). Benartzi et al. (1997) furthermorepoint outthatthe relationbetween
dividendincreasesand
futureaccountingvariables or future returnsisdistinct:whereasthey find
no
evidenceofa relationbetween
dividend changes
and
future earningschanges, they observepositiveexcess returnsforthe three yearsfollowingadividendincrease.
'
'Joos
and
Plesko (2003)document
thattheprobabihtyofalossfirm returningtoprofitabilityishigherfor firms incurring afirstlossthanforfirmswithrepeatlosses.
'^
We
alsocompare
the descriptivestatisticsinTableIItodescriptivestatisticsforrepeat losses
and
find the repeat loss observations generally exhibit significantly lowerprofitabilitythan thetotalgroup oflossfirms.
TABLE
ISample
Information
Ourinitialsampleconsistsoffirm-year observations fromCompustaVsIndustrialand ResearchAnnual Data Basesforthe years 1971-2000.
We
defineour earnings variableasincome(loss)before extraordinary items anddiscontinued operations orIB(annualCompiistat data item #18).We
defineADIVCF
as thechangeintotal dollaramount ofdividends paidbythefirm (annualCompustatdataitem #21).
We
defineADIVPS
asthechangeintotaldollaramount ofdividends paidbythe firm per share (annualCompustatdata item #21/ annualCompustatdataitem #25).
Panel
A:
FullSample:
Profitvs.Loss
ObservationsIB,>0
N
%
IB,<0
N
%
TOTAL
FullSample
146,39470.92%
60,02629.08%
206,420Profitvs.Loss
and
Past DividendsDiv,.,
=
65,35655.57%
52,26244.43%
117,618Div,.,>0
81,03891.26%
7,7648.74%
88,802Profit
and
Lossand
Current DividendsDiv,
=
63,77154.10%
54,10545.90%
117,876TABLE
IILoss
Firm
Sample:
DescriptiveStatisticsOurinitialsampleconsists offirm-yearobservationsfromCompustafs Industrialand ResearchAnnual DataBasesforthe years 1971-2000. Thetableshowsdescriptivestatisticsfor lossfirm-year observations
(N=60,026). Sizeis marketvalue (priceorannual Compustatdata item#199* numberofoutstanding shares or data item #25).ROA, =IB/TA,.],wherewedefineour earnings variableasincome(loss)before extraordinary itemsanddiscontinued operations orIB(annualCompustatdataitem #18).
We
define the cash flowcomponent ofearnings orCFO
ascashflowfi-omoperationsscaledbylaggedassetswherewemeasurecashflowfromoperationsasnetincome(annualCompustatdataitem #172)-accruals. Accruals
is(ACurrentAssets (data item #4)-ACash(dataitem #1)-ACurrentLiabilities(dataitem #5)+ADeblin
CurrentLiabilities(dataitem#34) +DepreciationandAmortizations(dataitem #14).SPIisspecialitems (annualCompustatdata item#17)scaledbylaggedassets {TA,.i). Thetablereportstestsofdifferences
betweenthemeans and medians ofthetwo subsamplesdeterminedbythesignofthe
CFO
variable (two-sidedt-testsandtwo-sidedWilcoxontestsforthemeanandmedian).ADIVCFUP
(ADIVPSUP)
isan indicatorvariablethattakes thevalueof1 ifthechangeindividend cashoutflow (dividendpayoutpershare), and zero otherwise, where dividends are annual Compustat data item #21 and number of
outstanding sharesisannualCompustatdataitem #25.
TABLE
IIILogisticRegression
Model
ofProbability ofDividend
IncreaseThetablecontains theresultsofa logisticregressionwithasindependent variable an indicator variablethat
takes the valueof1ifthecompanyincreasesitsdividends(measuredasatotalcashflow(DIVCF)orcash flow per share(DIVPS)) andzero otherwise.
Prob(ADIVCFJJP)
=ao
+ a,ROA, +OiCFONEG, +a,ROA,*CFONEG,
+a^LSize,+e, (1)Proh
(ADIVPSUP)
=bg+ b,ROA, +bsCFONEG,+b,ROA,*CFONEG,
+b^LSize,+£2 (2)ADIVCFJUP (ADIVPSUP)
isan indicator variablethattakesthevalueof1 ifthechangeindividend cashoutflow (dividendpayoutpershare),andzero otherwise,wheredividendsareannualCompustaldata item #21 andnumberofoutstanding sharesisannualCompustatdataitem #25. ROA, =IB/TA,.i,where IBis
income(loss)before extraordinary itemsanddiscontinued operations (annualCompustatdataitem #18)
and TAistotalassets (annualCompustatdataitem#6);
CFONEG
isanindicator variablethattakesonthe valueofoneifthe firmreportsa negative cash flow(CFO), andzero otherwise;ROA
*CFONEG
istheinteractionvariablebetween
ROA
andCFONEG;
LSizeislog(market valueof the firm)wherewe
definemarket value as closing price (annual Compustat data item #199) times shares outstanding (annual
Compustatdata item#25)atfiscal-yearend. Ourinitialsampleconsistsoffirm-yearobservationsfrom CompustafsIndustrialand ResearchAnnual DataBasesfortheyears 1971-2000, and
we
carry outour analysis in asubsample of 60,026 loss firm-year observations.We
report the resultsofthe logisticTable
IV
Prediction TestsThetablereportstheresultsofthe
OLS
regressions,estimatedusingtheFama-Macbethmethodology: AROA,^,=
ao+a,CFONEG,
+a^ROA, +a,ADIVCFJJP,+
a^ADIVCF_UP*CFONEG,
+asSPI,+«« LSize,+Eia (3a)
AROA,^,=fio+
P,
CFONEG,
+y3,ROA, +P3AD1VPS_UP,+fi^ADIVPS_UP*CFONEG,
+P,SPI,+P6 LSize,+Eib (3b)
whereaveragefuture
ROA
overtheforecasthorizonisAROA,+,=(£,+r ROAi+/t) whereROA, =IB/TA,.i,IBis annual Compustatdataitem #18, TA istotal assetsorannual Compustatdataitem#6 (t=1 or 3);
CFONEG
isan indicator variablethattakes thevalueof1 ifCFO
isnegative,andzero otherwise;we
measureCFO,orcashflowfromoperationsasnetincome(annualCompustatdataitem#172)-accruals.
We
measureaccruals orACC
as {ACurrentAssets (data item #4) - ACash (dataitem #1) - ACurrentLiabilities(dataitem #5)+ ADebtinCurrentLiabilities(dataitem#34)+DepreciationandAmortizations (dataitem #14);SPIisspecial items(annualCompustatdataitem#17) scaledby laggedassets {TA,.i);
ADIVCFUP
{ADIVPSJUP)isanindicatorvariablethattakesthevalueof1 ifthechangeindividend cash outflow (dividendpayoutpershare),andzero otherwise,wheredividendsareannualCompustatdataitem #21andnumberofoutstanding sharesisannualCompustatdataitem #25; LSizeislog(market valueofthe firm)wherewe
define marketvalueas closing price (annualCompustatdata item#199)times shares outstanding(annualCompustatdataitem#25)atfiscal-yearend. Ourinitialsampleconsistsoffirm-year observationsfrom Compustat'sIndustrialand Research Annual Data Basesfor theyears 1971-2000,andwe
carry out the analysis reportedinthetable inasampleconsistingof 60,026lossfirm-year observationsMITLIBRARIES