HAL Id: hal-01669807
https://hal.archives-ouvertes.fr/hal-01669807
Submitted on 6 Oct 2020
HAL is a multi-disciplinary open access
archive for the deposit and dissemination of
sci-entific research documents, whether they are
pub-lished or not. The documents may come from
teaching and research institutions in France or
abroad, or from public or private research centers.
L’archive ouverte pluridisciplinaire HAL, est
destinée au dépôt et à la diffusion de documents
scientifiques de niveau recherche, publiés ou non,
émanant des établissements d’enseignement et de
recherche français ou étrangers, des laboratoires
publics ou privés.
supernova remnant HESS J1731–347 (G353.6-0.7)
V. Doroshenko, G. Pühlhofer, A. Bamba, F. Acero, W.W. Tian, D. Klochkov,
A. Santangelo
To cite this version:
V. Doroshenko, G. Pühlhofer, A. Bamba, F. Acero, W.W. Tian, et al.. XMM-Newton observations
of the non-thermal supernova remnant HESS J1731–347 (G353.6-0.7). Astron.Astrophys., 2017, 608,
pp.A23. �10.1051/0004-6361/201730983�. �hal-01669807�
DOI:10.1051/0004-6361/201730983 c
ESO 2017
&
Astrophysics
XMM-Newton observations of the non-thermal supernova remnant
HESS J1731
−
347 (G353.6-0.7)
V. Doroshenko
1, G. Pühlhofer
1, A. Bamba
2, 3, F. Acero
4, W. W. Tian
5, 6, 7, D. Klochkov
1, and A. Santangelo
11 Institut für Astronomie und Astrophysik, Sand 1, 72076 Tübingen, Germany
e-mail: [email protected]
2 Department of Physics, The University of Tokyo, 7-3-1 Hongo, Bunkyo-ku, Tokyo 113-0033, Japan
3 Research Center for the Early Universe, School of Science, The University of Tokyo, 7-3-1 Hongo, Bunkyo-ku, Tokyo 113-0033,
Japan
4 Laboratoire AIM, IRFU/SAp – CEA/DRF – CNRS, Université Paris Diderot, Bât. 709, CEA-Saclay, Gif-sur-Yvette Cedex, France 5 Key Laboratory of Optical Astronomy, National Astronomical Observatories, Chinese Academy of Sciences, Beijing 100012,
PR China
6 Institute of Astronomy and Department of Physics, National Tsing Hua University, Hsinchu, Taiwan 7 Department of Physics and Astronomy, University of Calgary, Calgary, Alberta T2N 1N4, Canada
Received 13 April 2017/ Accepted 5 August 2017
ABSTRACT
We report on the analysis of XMM-Newton observations of the non-thermal shell-type supernova remnant HESS J1731−347 (G353.6-0.7). For the first time the complete remnant shell has been covered in X-rays, which allowed direct comparison with radio and TeV observations. We carried out a spatially resolved spectral analysis of XMM-Newton data and confirmed the previously reported non-thermal power-law X-ray spectrum of the source with negligible variations of spectral index across the shell. On the other hand, the X-ray absorption column is strongly variable and correlates with the CO emission thus confirming that the absorbing material must be in the foreground and reinforcing the previously suggested lower limit on distance. Finally, we find that the X-ray emission of the remnant is suppressed towards the Galactic plane, which points to lower shock velocities in this region, likely due to the interaction of the shock with the nearby molecular cloud.
Key words. ISM: supernova remnants – cosmic rays – X-rays: ISM – X-rays: individuals: HESS J1731−347
1. Introduction
HESS J1731−347 (G353.6-0.7) belongs to a small group of su-pernova remnants (SNR) with associated TeV and non-thermal X-ray synchrotron emission from the expanding supernova shock fronts. The observed X-ray emission is evidence of relativistic TeV electrons that are accelerated in the SNR shocks. The TeV emission from HESS J1731−347 could stem from relativistic electrons (through inverse Compton emission) or, alternatively, from protons (through π0-decay). In order to disentangle the two
processes and derive corresponding energy budgets, the param-eters of the environment into which the shocks are propagating need to be known. The progenitor of HESS J1731−347 must have been a massive star as its central compact object (CCO), i.e. a neutron star is detected in its centre. Therefore, the rem-nant is likely surrounded by and is possibly expanding into an area of high molecular density. However, in order to achieve its current size (∼30 pc diameter assuming a distance of ∼3.2 kpc to the source) while still maintaining a high shock speed, the forward shock must have propagated for a large fraction of the remnant’s lifetime in a tenuous medium. A likely explanation is that the remnant is expanding inside the stellar wind bubble blown by the progenitor star (Cui et al. 2016). The same scenario has also been invoked to explain the size of RX J1713.7-3946 (Berezhko & Völk 2008).
The distance to HESS J1731−347 is not firmly known up to date. It is likely that the remnant is located in one of the three
Galactic spiral arms crossing the line of sight at the near side of the Galactic centre: in the Scutum-Crux arm (at a distance of ∼3 kpc), in the Norma arm (∼4.5 kpc), or in the 3 kpc arm at 5–6 kpc distance. A location beyond the Galactic centre distance would imply a very high TeV luminosity and seems unlikely. A reasonable lower limit of 3.2 kpc comes from a gradient of the X-ray absorption column across the source matching the integrated gas density up to that distance, as derived from12CO
and HI data (H.E.S.S. Collaboration et al. 2011). The remnant could be located on the far side of the Scutum-Crux arm, at a similar distance (in projection) of a nearby HII region at ∼3.2 kpc distance (Tian et al. 2008); however, no morphological or other obvious link exists between the two sources. If HESS J1731−347 were located at this distance, it could be co-located with the bulk of absorbing material (i.e. inside a molecular cloud region) that is located in the Scutum-Crux arm, and possibly interact with the material. However, from the existing data, no evidence for such an interaction has been found so far.
A near distance (3.2 kpc to 4.5 kpc) is also favoured by the analysis of the X-ray spectrum of the central neutron star (Klochkov et al. 2013,2015). Alternatively, it has been ar-gued that HESS J1731−347 could be located in the 3 kpc arm (Fukuda et al. 2014). While the TeV profile on its own is statisti-cally compatible with a flat profile (H.E.S.S. Collaboration et al. 2011),Fukuda et al.(2014) have argued for a partial correlation of the TeV profile with an azimuthal gas profile in the projected direction towards the SNR in the 3 kpc arm distance range. The
TeV emission has been interpreted in this scenario by a blend of hadronic emission (correlated with the gas density) and lep-tonic emission.Fukuda et al.(2014) also favoured this scenario based on the spatial distribution of the surrounding molecular clouds. Finally, using the roughly flat TeV azimuthal profile, Nayana et al.(2017) argued that the remnant is likely not expand-ing in an anisotropic medium as would be expected from molecu-lar clouds. They then used indications for an anti-correlation with 325 MHz radio synchrotron emission to argue that the TeV emis-sion is due to electrons, explaining the differences as being due to different magnetic field strengths and correspondingly different synchrotron burnoff energies of the radiating electrons.
Cui et al. (2016) have shown that within a framework to model the SNR evolution and associated particle acceleration, it is difficult to obtain a hadronic TeV emission scenario for HESS J1731−347 independent of the actual distance to the SNR. From the upper limit in the GeV band derived with Fermi-LAT (Acero et al. 2015) it was argued as well that the TeV emission from HESS J1731−347 should be leptonically dom-inated. However, the same arguments that have been used by Gabici & Aharonian(2014) to model the GeV–TeV emission of RX J1713.7-3946 as hadronic emission could also be applica-ble to HESS J1731−347. The steep GeV spectrum on its own therefore does not provide a definite discrimination between the emission models.
X-ray data of HESS J1731−347 can be used to probe the surrounding geometry of the remnant and to explore the differ-ent emission scenarios. A full sensitive X-ray coverage of the SNR has not been achieved before; the ROSAT soft X-ray sur-vey has only revealed few photons from the source (Tian et al. 2008). So far, an XMM-Newton pointing towards the north-east and two Suzaku pointings towards the north-west and south-west of the remnant have been analysed in view of the SNR (Tian et al. 2010; H.E.S.S. Collaboration et al. 2011; Bamba et al. 2012). The XMM-Newton data have revealed the absorption pattern men-tioned above, which has been confirmed with Suzaku. No ther-mal emission has been found from the spectral analysis of the data. The photon index of the power-law model fitted to various subregions of the remnant has been reported to vary between 2 and 3, so far without a clearly identified morphological pattern. Bamba et al.(2012) have found one region with a particularly hard index (∼1.8); however, the angular resolution of the tele-scope might have masked the contribution from strong point sources to the spectrum.
For the work presented in this paper, we have obtained and analysed data from XMM-Newton covering the full SNR extent. For the first time, we provide a full X-ray image of the remnant (see Fig.1) as well as a consistent spectral analysis across the source. The image has been divided into a grid of eighteen source regions (with three background regions), and the corresponding spectra have been used to analyse the spatial variations of the X-ray source parameters across the remnant. The data permit the X-ray map to be compared with the sky maps in the TeV, ra-dio, and submillimetre bands. The analysis of the XMM-Newton data has been hampered to some degree by the presence of sig-nificant stray light coming from a nearby source (likely 1RXS J173157.7−335007) and Galactic ridge emission. An extensively tuned analysis has therefore been performed to deal with that problem, which is described below. The paper is organised as follows: in Sect. 2 the XMM-Newton data set and analysis is de-scribed in detail; Sect. 3 deals with connection of the obtained results between X-ray and other bands; and Sect. 4 summarises the conclusions. 262.6 262.8 263.0 263.2 263.4-35.0 -34.8 -34.6 -34.4 N E
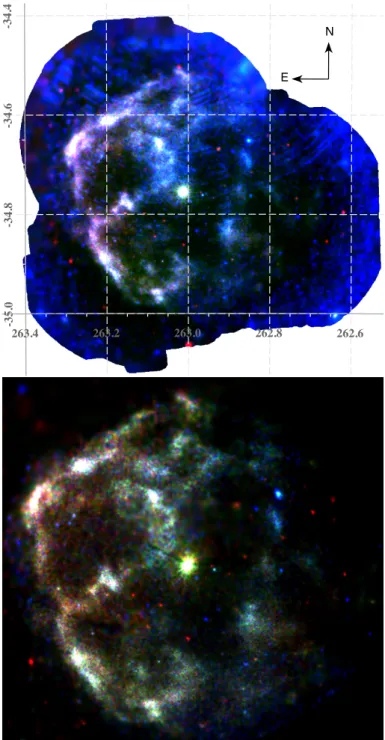
Fig. 1.Pseudo-colour mosaic image of all observations showing 0.4–
1.8 keV (red), 1.8–2.8 keV (green) and 2.8–10.0 keV (blue) rates cor-rected only for the residual proton background (top panel), and central part of the same image corrected for all identified background compo-nents (bottom panel). All images are presented in equatorial coordinates shown in a grid in the top image. The scale of the uncorrected image has been adjusted to emphasise the contamination by stray light (mostly seen in blue) and extended emission towards the western part of the remnant. Note that the stray-light contamination is even more severe in individual observations as the location of the single reflection arcs is sensitive to the pointing of telescope.
2. Data analysis
2.1. Observations and data reduction
The remnant and the CCO have been observed with XMM-Newton several times. The list of observations is presented in Table1. For data screening and reduction the XMM SAS version
21 20 19 18 17 16 15 14 13 12 11 10 9 8 7 6 5 4 3 2 1 0 21 20 19 18 17 16 15 14 13 12 11 10 9 8 7 6 5 4 3 2 1 0 21 20 19 18 17 16 15 14 13 12 11 10 9 8 7 6 5 4 3 2 1 0 21 20 19 18 17 16 15 14 13 12 11 10 9 8 7 6 5 4 3 2 1 0 0.99 1.1 1.3 1.5 1.6 1.8 1.9 2.1 2.2 2.4 2.5 262.6 262.8 263.0 263.2 263.4 -35.0 -34.8 -34.6 N E 21 20 19 18 17 16 15 14 13 12 11 10 9 8 7 6 5 4 3 2 1 0 21 20 19 18 17 16 15 14 13 12 11 10 9 8 7 6 5 4 3 2 1 0
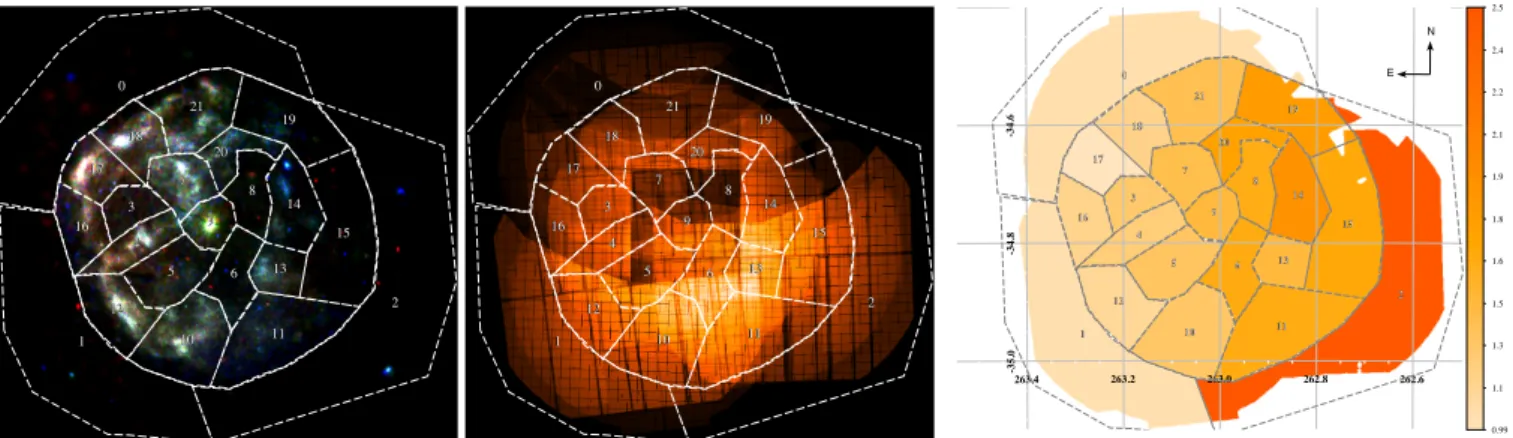
Fig. 2.Left panel: mosaic pseudo-colour image in 0.4–1.8 keV (red), 1.8–2.8 keV (green), and 2.8–10 keV (blue) energy bands corrected for particle,
soft proton, and residual stray-light contamination. The definition of regions used for spectral analysis is also shown. Middle panel: combined exposure map in 0.4–10 keV band where regions most heavily contaminated by stray light and excluded from the analysis can be identified. Right panel: colour-coded absorption column density.
Table 1.XMM-Newton observations of HESS J1731−347.
Observation Observation Duration, Exposure
ID date ks (M1/M2/PN), ks 0405680201 2007-Mar.-21 25.4 22.5/22.9/12.1 0673930101 2012-Mar.-02 23.7 21.9/21.8/0 0694030101 2013-Mar.-07 72.4 53.1/54.9/42.5 0722090101 2013-Oct.-05 61.3 53.3/54.1/41.6 0722190201 2014-Feb.-24 131.2 88.4/97.4/0 Total 314 239.2/251.1/96.2
Notes.The “Exposure” column reflects the effective imaging exposures for each camera (EPIC MOS1, MOS2, and PN). Zero exposure means that PN was operated in timing mode.
20141104_1833-14.0.0 was used (this version also includes the formerly independent extended source analysis software package ESAS). For the analysis of extended emission from the remnant we followed the procedures described in the ESAS Cookbook1 unless stated otherwise. We excluded data taken in windowed and timing modes, and only considered observations performed in imaging mode. We also excluded data from CCD chips operating in the “anomalous mode” characterised by a high level of noise at low energies, and screened the data for periods of enhanced or-bital background (using the ESAS tasks mos/pn-filter with default filtering criteria).
Inspection of the images extracted from the screened data im-mediately revealed that all observations are affected by stray light from a nearby bright source (likely 1RXS J173157.7−335007) to some extent. The X-ray stray light in the EPIC cameras is mainly produced by single reflections of rays coming from outside of the field of view from the hyperbolic section of the mirrors and is detected as spurious arc-like structures across large fractions of the detector area. Fortunately, the projection of these onto the sky plane changes from camera to camera and also with point-ing direction. Therefore, even after visual-based exclusion of the regions contaminated by stray light, the remnant was still completely covered by observations, although the exposure was reduced, as can be seen in the cumulative exposure map presented in Fig.2.
1 http://heasarc.gsfc.nasa.gov/docs/xmm/esas/cookbook/
xmm-esas.html
Our study is focused on the extended emission of the remnant shell, so the contribution of the point sources must be removed. To detect the point sources, for each observation and camera (i.e. each individual exposure) we extracted images and ran the SAS source detection pipeline (using both eboxdetect and emlde-tect tasks) for four energy bands: 0.4–1.8, 1.8–2.8, 2.8–10, and 0.4–10 keV. In addition, we followed the same procedure for the combined mosaic image including all observations. All de-tected sources were then merged into a single list, which was then manually screened to exclude the spurious detections corre-sponding to bright shell filaments. The final source list consisting of 110 sources was then used to mask the point sources for both imaging and spectral analysis (using the region task to define exclusion regions containing 95% of flux for each source).
We also used the multi-colour mosaic presented to define source extraction regions for spectral analysis. We considered both variation in total intensity and colour (i.e. source intensity in individual energy ranges) to define the 22 regions matching the observed structure of the shell and the background in order to investigate spatial variations of the spectrum across the remnant (see Fig.2).
For each observation and telescope we derived the spectral products (i.e. source and in-orbit particle background spectra and respective response files) for visible regions using the SAS tasks mos/pn-spectra. In total, 167 spectra with a mean exposure of ∼42 ks were derived. For each spectrum, the exposed sky area (excluding areas contaminated by stray light and point sources, gaps between individual CCD chips, and bad pixels) and scaling for the residual soft proton contamination (see the next section) were calculated using the task proton_scale.
2.2. Spatially resolved spectral analysis
A spectral analysis of extended source emission requires careful modelling of the background. We estimated the contribution of the in-orbit particle background and out-of-time events (for EPIC PN) based on the count-rate in the unexposed detector areas using the SAS tasks mos/pn_back and subtracted resulting spectra from all observed spectra. To estimate the local cosmic background, we used the source-free regions 0, 1, 2 (only available in observations 0405680201, 0694030101, and 0722090101, respectively, i.e. those with pointings displaced from the shell centre).
The source resides in the Galactic plane, so the cosmic back-ground is expected to be dominated by the Galactic ridge emission
of unresolved point sources (GRXE;Revnivtsev et al. 2006). As recently discussed byYuasa et al. (2012), the 2–50 keV X-ray spectrum of the GRXE can be represented with an absorbed two-temperature collisional ionisation equilibrium plasma (CIE) model with temperatures of ∼1.5 keV and ∼15 keV. We found that the observed local background in our observations in the 0.4– 10 keV energy range is well described with an absorbed single-temperature CIE model with kT ∼ 0.7 keV (see also Table2). The discrepancy in the derived temperature value is not surpris-ing taksurpris-ing into account the difference in energy range and likely spatial variation of spectral properties of the ridge emission and, as we verified, has little effect on the derived parameters of the shell spectrum. We also verified that the choice of the absorption model does not affect other parameters and use the wabs model (Morrison & McCammon 1983) throughout the paper.
The contribution from the local hot bubble (which is also expected to have kT ∼ 0.7 keV, but is not expected to be ab-sorbed) and from background AGN were not formally required by the fit. However, to avoid a possible bias for other parameters, we still included the well-studied AGN background as a fixed absorbed power law with an absorption column density linked to that in a given region (which is comparable with the Galac-tic absorption column in the direction of the source), a photon index ofΓ = 1.46, and a scaled normalisation of 4.6 × 10⁻⁷
pho-tons keV−1cm−2s−1arcmin−2 at 1 keV (Cappelluti et al. 2009).
The actual sky area from which individual spectra were extracted differs between observations, so all model components were scaled to unit area with a scaling constant calculated using the proton_scale task.
We found also that despite the exclusion of the enhanced orbital background periods, a residual soft-proton contamination remained noticeable in all observations and, in fact, given the low surface brightness of the remnant, is a major background com-ponent. Therefore, we included a power law (or a broken power law if required) not folded through the instrumental response in the model to account for it. The normalisation of this compo-nent is known to depend on the position in the detector plane. However, the relative normalisation for two arbitrary regions can be calculated using the task proton_scale based on calibration observations. Therefore, we fit the parameters of this component only for a single arbitrarily chosen sky region in each observation, and scale it for all other regions using the scaling calculated with proton_scale.
Emission from the remnant itself had been reported to be non-thermal with a pure power-law spectrum, possibly with spa-tially varying photon index (Bamba et al. 2012). To model the source emission, we therefore used a power law with independent normalisation and photon index for individual sky regions. Once the general shape of the background spectrum was established, we included all sky regions and fitted the source and background components simultaneously to improve counting statistics. As already mentioned, two observations including the longest one were centred on the CCO and contain no source-free regions to estimate the background (including the residual soft-proton background). This is another reason why we fit all spectra from all observations simultaneously. The parameters of the source and cosmic background spectra were assumed to be linked to a given sky region, and parameters of the soft proton background to a given camera and observation. For modelling we used the sherpa2 spectral fitting package from the Chandra interactive analysis of observations (CIAO v 4.7) software.
2 http://cxc.harvard.edu/sherpa4.4/
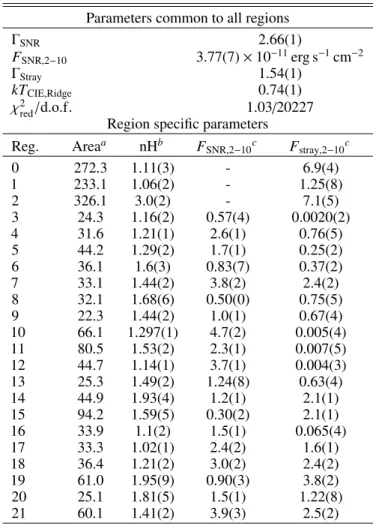
Table 2.Spectral extraction region parameters and best-fit results assum-ing a pure power law with constant index for all regions.
Parameters common to all regions
ΓSNR 2.66(1) FSNR,2−10 3.77(7) × 10−11erg s−1cm−2 ΓStray 1.54(1) kTCIE,Ridge 0.74(1) χ2 red/d.o.f. 1.03/20227
Region specific parameters
Reg. Areaa nHb F SNR,2−10c Fstray,2−10c 0 272.3 1.11(3) - 6.9(4) 1 233.1 1.06(2) - 1.25(8) 2 326.1 3.0(2) - 7.1(5) 3 24.3 1.16(2) 0.57(4) 0.0020(2) 4 31.6 1.21(1) 2.6(1) 0.76(5) 5 44.2 1.29(2) 1.7(1) 0.25(2) 6 36.1 1.6(3) 0.83(7) 0.37(2) 7 33.1 1.44(2) 3.8(2) 2.4(2) 8 32.1 1.68(6) 0.50(0) 0.75(5) 9 22.3 1.44(2) 1.0(1) 0.67(4) 10 66.1 1.297(1) 4.7(2) 0.005(4) 11 80.5 1.53(2) 2.3(1) 0.007(5) 12 44.7 1.14(1) 3.7(1) 0.004(3) 13 25.3 1.49(2) 1.24(8) 0.63(4) 14 44.9 1.93(4) 1.2(1) 2.1(1) 15 94.2 1.59(5) 0.30(2) 2.1(1) 16 33.9 1.1(2) 1.5(1) 0.065(4) 17 33.3 1.02(1) 2.4(2) 1.6(1) 18 36.4 1.21(2) 3.0(2) 2.4(2) 19 61.0 1.95(9) 0.90(3) 3.8(2) 20 25.1 1.81(5) 1.5(1) 1.22(8) 21 60.1 1.41(2) 3.9(3) 2.5(2)
Notes.(a)In units of arcmin2,(b)in units of 1022atoms cm−2,(c)in units
of 10−12erg cm−2s−1.
Initially we found that the shell spectrum significantly hard-ened in the northern part of the remnant. However, the same area is most heavily contaminated by stray light. Some excess emission is also evident throughout most of the image, and in particular in the northern background region. It is clear, there-fore, that stray-light contamination is not limited to the apparent arc-like structures (and their immediate neighbourhood) already excluded from the analysis, but extends much further and might even be present in exposures with no visible sign of stray-light contamination. A more conservative spatial filtering of all possi-bly contaminated areas would imply dropping the entire northern half or even two-thirds of the remnant from the analysis, so we opted to treat the residual stray-light contamination as an addi-tional background component.
The energy dependence of the effective area is not calibrated for stray light, so it is not trivial to model this component. Fur-thermore, the degree of contamination likely differs between in-dividual observations for the same sky region, which implies that for each spectrum an additional free parameter must be constrained. We found, however, that a single power law with a photon index of ∼1.5 and a normalisation only variable be-tween individual sky regions but not bebe-tween individual spectra allows all spectra to be fit. Unfortunately, the normalisation of this component is also strongly correlated with the photon in-dex of the remnant spectra, so the spectral inin-dex of the extended
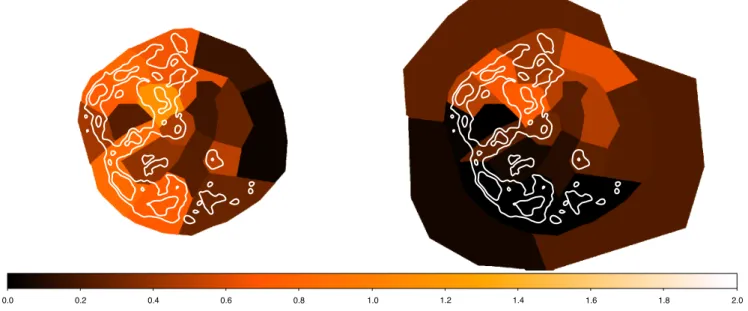
0.0 0.2 0.4 0.6 0.8 1.0 1.2 1.4 1.6 1.8 2.0
Fig. 3.Average surface brightness of the SNR emission (left) and residual stray-light contamination (right) in units of 10−13erg cm−2s−1arcmin−2in
the full (0.4–10 keV) energy range. The stray-light emission spectrum is substantially harder, so it has a factor of two higher energy flux for a given photon flux. Surface brightness roughly correlates with the reduction of exposure due to exclusion of the most heavily polluted regions shown in Fig.2. The contours show equal brightness levels for the extended emission for reference.
emission remains unconstrained for individual regions. Moreover, the remnant is located close to the Galactic plane, so an additional contribution from the Galactic ridge X-ray emission (GRXE) is expected. The spectrum of the ridge consists of a number of emission lines and a power-law continuum with photon index of ∼2, close to that of the remnant. The intensity and spectrum of the GRXE are known to depend on the Galactic coordinates (Valinia & Marshall 1998;Revnivtsev et al. 2006;Ebisawa et al. 2008), and the vertical scale of the disc component of the GRXE of ∼1.5◦(Revnivtsev et al. 2006) is comparable to the extension
of the SNR. We attempted to include this component in the fit as well. However, it was impossible to disentangle the contribution of the three power-law continua with similar indices in individual regions. Therefore, we had to conservatively assume constant photon indices across the remnant for both the SNR and residual contamination from stray light/ridge emission (referred to simply as stray-light contamination). The average surface brightness of source and residual contamination emission are shown in Fig.3 on the same scale. We note that while the residual contamination appears relatively strong, the SNR emission is significantly softer than the stray-light emission, so the SNR emission dominates the photon flux in all energy ranges where it is actually detected. The resulting fit is statistically acceptable. However, it is still possible that we have overestimated the stray-light contribution in some regions.
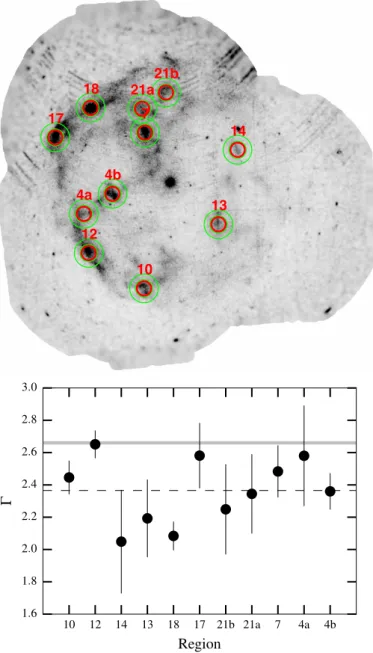
It is also important to emphasise that we cannot exclude a spatial variation of the SNR spectrum as it can be masked by changes in the normalisation of the stray-light component. In order to verify that the photon index is indeed stable throughout the shell we conducted a simplified but more straightforward analysis for the brightest parts of the shell. In particular, for several bright knots shown in Fig.4, for each observation and instrument we extracted spectra from small circular regions with radii of 5000, comparable with the XMM-Newton point spread
function (PSF), and associated backgrounds from annuli centred on the same position with inner and outer radii of 6000and 10000,
respectively. We visually inspected individual images to exclude spectra where either source or background regions were severely
affected by stray light or were close to the edge of the field of view. The remaining spectra were then modelled with an absorbed power law after subtracting the background and grouping to 100 counts per energy bin. We kept the absorption column free, as it is quite clear from the optical extinction analysis presented in Sect.3.4that it varies on scales as small as ∼10. The best-fit
results are presented in Fig.4. While there is some scatter in the measured photon index values, they seem to be consistent with each other within the uncertainties. The distribution of measured photon indices is also compatible with that reported based on Suzaku data (Bamba et al. 2012), as follows from the high two-tailed p-value of 0.81 for the two-sample Kolmogorov-Smirnov test. On the other hand, the average value is somewhat lower than that measured using the entire shell (although the deviation is not significant). There are several reasons for this offset, for example, a variation in the absorption column within larger regions used above, the presence of unabsorbed components in the background (i.e. the local bubble) unaccounted for in the simplified filament analysis, an overestimation of the stray-light contribution for the analysis of the entire shell, or a combination of the above. It is important to note, however, that the obtained results still seem to be robust despite the apparent complexity of the analysis as justified by the clear correlation of the deduced absorption column with the optical extinction described in Sect.3.2. We also do not expect these factors to significantly affect the flux estimates, so this issue does not affect any of our conclusions. To resolve it completely, additional observations with Chandra which seem to be less susceptible to stray light will, however, be required.
The final fit results are presented in Table2. All uncertainties are at the 1σ confidence interval unless stated otherwise. Flux uncertainties are estimated from a sample of 2 × 10⁴simulated
spectra with parameters distributed according to the best-fit re-sults, i.e. they are not affected by absorption. An example of a representative spectrum from region 21 which contains both significant source and background contributions modelled as de-scribed above is presented in Fig.5.
The spatially resolved spectral analysis presented above is also essential for correcting the mosaic image presented in Fig.2
21a 21b 4a 14 4b 7 18 17 12 10 13 10 12 14 13 18 17 21b 21a 7 4a 4b Region 1.6 1.8 2.0 2.2 2.4 2.6 2.8 3.0 Γ
Fig. 4.Definition of source and background regions used to probe
vari-ations of the photon index across the remnant (top, the image is in the 0.4–10 keV band, adaptively smoothed and corrected for exposure and quiescent particle background) and the best-fit values of the photon index for each region (bottom, 1σ uncertainties). The dashed line represents the mean value and the shaded area corresponds to the photon index esti-mated using entire shell. For consistency, the region names correspond to the larger regions introduced in Fig.2.
for the residual quiescent particle background (QPB), residual soft proton, and stray-light contamination. Using the obtained best-fit parameters we created the quiescent particle background and residual soft proton contamination images for each expo-sure using the mos/pn-spectra and proton tasks. The resulting images were then merged using the task merge_comp_xmm to obtain mosaics covering the entire remnant. To account for the residual stray-light contribution, we followed a similar approach generating mosaic images based on the expected number of con-taminating photons. In particular, the average stray-light count rate in each region and energy range was calculated based on the best-fit parameters presented above, and then multiplied by the observed exposure maps to estimate the expected number of stray-light photons in each sky pixel. The resulting count images
1 10 Energy, keV 10−4 10−3 10−2 10−1 Norm. coun ts s − 1 keV − 1 SP SNR GRXE Stray AGN
Fig. 5.Representative QPB subtracted spectrum extracted from region
21 using the MOS2 data from observation 0722190201 (black points). Identified source and residual background components described in the text are also shown as labelled in the figure.
for the quiescent particle, soft proton, and stray-light backgrounds were then co-added and subtracted from the combined net image. The final image was corrected for uneven exposure and smoothed. The absorption-corrected image presented in Fig.9was smoothed using a Gaussian kernel with constant width of 0.30. The same
image without the correction for absorption presented in Figs.2 and1was adaptively smoothed using the task adapt_merge to contain at least 300 counts per pixel in each band.
3. Discussion
3.1. Spectral energy distribution
The broadband spectral energy distribution (SED) of the SNR has been discussed by several authors (H.E.S.S. Collaboration et al. 2011; Yang et al. 2014;Acero et al. 2015) based on integrated TeV and radio fluxes and X-ray flux detected from the eastern half of the remnant scaled by a factor of two. The latter assumption implies that the X-ray flux was significantly overestimated as XMM-Newton observations have revealed that the eastern part is, in fact, much dimmer. The source is not detected in the GeV band which could be useful to discriminate between leptonic and hadronic TeV emission.Acero et al.(2015) obtained stringent upper limits from Fermi data which were interpreted as favouring a leptonic scenario. Here we present an updated spectral energy distribution fit using the X-ray flux integrated over the entire remnant, and assuming a simple single zone synchrotron-inverse Compton model. It is important to emphasise that this is probably an oversimplification as both radio and X-ray emission clearly show variation of intensity/power-law slope (Nayana et al. 2017) over the remnant. However, the quality of radio, X-ray, and TeV data does not permit a more detailed analysis at this stage, so we stick to the model used in previous investigations to facilitate the comparison of the results. Fitting and modelling of the SED were carried out using the naima package (Zabalza 2015).
In addition to the updated X-ray flux estimate, we include the new measurement at 325 MHz byNayana et al.(2017) and the radio fluxes at 1.4 and 5 GHz reported byTian et al.(2008). We also included an additional seed photon component associated with the optical star located close to the centre of the remnant with a temperature of 9 × 10⁴K and a density of 0.02 eV cm−3
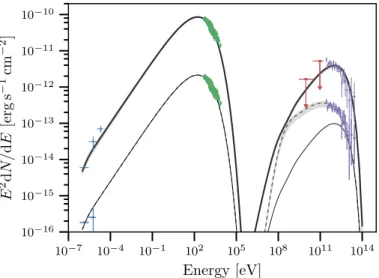
10−7 10−4 10−1 102 105 108 1011 1014 Energy [eV] 10−16 10−15 10−14 10−13 10−12 10−11 10−10 E 2 d N / d E [erg s − 1 cm − 2 ]
Fig. 6.Broadband spectral energy distribution (SED) and the best-fit
leptonic scenario model (upper set of lines). The X-ray spectrum used here is a simulated PN spectrum with an exposure adjusted to yield the same spectral index and flux uncertainties as the best-fit result presented in Table2(i.e. the flux is integrated over all extraction regions with the contribution of point sources removed). The lower set of lines shows the SED scaled to represent fluxes within region 19 and the corresponding leptonic model with all parameters fixed to that from a global fit. The same model with an additional hadronic component accounting for the excess TeV flux is also shown for illustration (dashed line).
(Doroshenko et al. 2016), which was not included in the fits by Acero et al.(2015). The best fit presented in Fig.6yields values similar to those reported byYang et al.(2014) with an electron population index of se= 1.85(1) and a cut-off at 11.2 TeV,
back-ground field of B= 23(1) µG, and an electron population energy above 1 GeV of We= 0.20(1) × 1048erg (again assuming a
dis-tance of 3.2 kpc).
The derived magnetic field is consistent with earlier esti-mates and seems to be rather low compared with other young SNRs. Indeed, fields derived from thin X-ray filament structures or the time variation of X-ray emission were found to be signif-icantly higher in some cases (a few 100 µG;Bamba et al. 2003, 2005;Uchiyama et al. 2007). On the other hand, the filaments in HESS J1731−347 do not seem to be as sharp as in those cases, and rather clumpy, i.e. they are more similar to those in RCW 86 (whose age is ∼2000 yr;Bamba et al. 2005). The magnetic field in this SNR can thus indeed be lower than in other younger SNRs, which would also support a leptonic origin for the bright VHE gamma-rays.
It is important to note that the single-zone SED model consid-ered above is almost certainly an oversimplification. Indeed, as discussed byNayana et al.(2017) and below in Sect.3.3, the mor-phologies of radio, X-ray, and TeV shells are significantly differ-ent. Furthermore, based on the comparison of 325 and 610 MHz fluxes,Nayana et al.(2017) reported slightly different spectral indices for the eastern and western parts of the radio shell. In par-ticular, the spectrum of the brighter eastern part was found to be somewhat steeper, which, together with the spatial anticorrelation of radio and TeV brightness, was interpreted as evidence for a stronger ambient magnetic field in this region.
We also considered, therefore, modelling of the SED of the north-western part of the shell only, where the difference in radio/X-ray and TeV morphologies is most apparent. It is im-portant to emphasise, however, that the quality of the data in all bands is not sufficient for a detailed spatially resolved analysis of
the SED and the estimates below are thus very approximate and serve mainly an illustrative purpose.
For the estimates we consider region 19 defined for our X-ray analysis, which roughly corresponds to the radio filament 3 re-ported byNayana et al. (2017). We estimate that X-ray, radio, and TeV fluxes from this part of the shell roughly correspond to ∼3, 2.5, and 7% of the total source flux. To estimate the TeV flux we used the ratio of excess counts from region 19 to that from the entire remnant using the image fromH.E.S.S. Collaboration et al. (2011), and scaled the spectrum reported there using this value. Similarly, we re-scale the X-ray spectrum used for the global SED analysis to flux measured from region 19 as a rough estimate. The resulting SED is presented in Fig.6along with the global SED and a leptonic model with all parameters except the normalisation fixed to global values.
As can be seen from the figure, the model in this case sig-nificantly underpredicts the TeV flux (or overpredicts the flux in the lower energy bands). There are several possibilities to ex-plain this discrepancy. For instance, as suggested byNayana et al. (2017), one can assume an ambient magnetic field that is lower by a factor of two in this region (∼13 µG) to reduce the rela-tive flux at low energies. Alternarela-tively, the TeV excess can be attributed to a higher seed photon density associated with the infrared emission from dust in the Galactic plane or to an ad-ditional hadronic component. In the latter case, even arbitrarily assuming the same normalisation for proton and electron popula-tions, one can estimate the density of the target medium required to account for the discrepancy at ∼2000 cm−3. We note that this
is still reasonably low as the X-ray absorption is highest in this direction (∼2 × 10²²atoms cm−2), and even higher density might
be required to produce the observed CO emission (Maxted et al. 2015) (see also discussion in Sect.3.3).The corresponding SED model is also shown in Fig.6for reference.
3.2. Correlation of12CO(J = 1–0) and X-ray absorption H.E.S.S. Collaboration et al.(2011) estimated the distance to the source comparing the largest measured X-ray absorption column with the column density derived based on the velocity spectra of12CO (Dame et al. 2001) and HI (Haverkorn et al. 2006)
emis-sion. They concluded that these become comparable for velocities integrated up to a radial velocity relative to the local standard of rest (LSR) of –25 km s−1. The corresponding peak in integrated
column is located at –18 km s−1, which corresponds to a lower
limit on the distance of ∼3.2 kpc. This estimate is qualitative, and in principle depends on the assumed composition of ISM and needs verification.
H.E.S.S. Collaboration et al.(2011) pointed out that for the same integration velocity the observed CO intensity increases in the direction of the Galactic plane similarly to the X-ray absorption. This conclusion can be verified quantitatively us-ing the XMM-Newton spatially resolved spectroscopy. To do so we use the CfA survey (Dame et al. 2001) as used by H.E.S.S. Collaboration et al.(2011), and calculate the Pearson correlation coefficient between the observed X-ray absorption and the12CO column integrated up to a given velocity within
a given spatial region. None of the published HI data cubes (Haverkorn et al. 2006) covers the entire remnant which com-plicates a similar analysis for this data set, due to the presence of edge artefacts in individual data cubes covering parts of the remnant. On the other hand, for a correlation analysis no addi-tional assumptions on the ISM composition are required as we do not have to convert the observed12CO line intensity to the
−100 −80 −60 −40 −20 0 υLSR,min 0.1 1.0 10.0 100.0 realisations with r > robs ,%
Fig. 7.Significance of the correlation between the absorption column
density derived from XMM-Newton X-ray observations and the inte-grated CO temperature for different regions based on a permutation test (red dotted line indicates the 3σ level). The rapid drop in the correla-tion significance for υLSR& −25 km s−1corresponds to a lower limit on
distance of ∼3 kpc.
of the two quantities. To estimate the significance of the correla-tion in each case we compare the observed correlacorrela-tion coefficient with a respective sample of values obtained by shuffling the re-gions (i.e. a bootstrapping technique with 105realisations). As
illustrated in Fig.7, the correlation is indeed significant for inte-gration velocities υLSR. −20 km s−1. We note that our result is
based on12CO data which exhibits no significant features around
this velocity, so the correlation is likely disrupted by an addi-tional contribution from atomic hydrogen which appears around −18 km s−1 (H.E.S.S. Collaboration et al. 2011). This confirms the suggested similarity of X-ray absorption and column density maps (H.E.S.S. Collaboration et al. 2011) and reinforces their conclusions on the lower distance limit, although this analysis would certainly benefit from the detailed HI/12CO mapping of
the entire remnant.
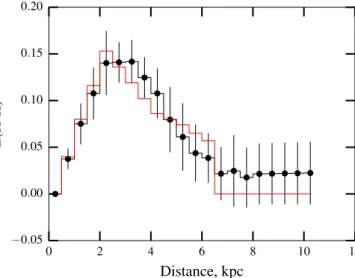
It is interesting to note that a similar distance estimate can be obtained independently based on the analysis of the opti-cal extinction known to be correlated with absorption in X-rays (Vuong et al. 2003). Using the 3D dust extinction mapping results presented bySchultheis et al.(2014), we estimated the average absorption as a function of distance in the direction of the remnant as shown in Fig.8. Most of the absorbing material is concentrated at around 3 kpc, i.e. it coincides with the12CO emission peak
at υLSR ∼ −18 km s−1. Unlike the radio data, this result does
not depend on the Galactic rotation curve model. Finally, a dis-tance of about 3.4 kpc for the remnant is also suggested from the red-clump method (Zhu et al. 2015; priv. comm.).
3.3. TeV, radio, and X-ray morphology of the shell
With the full remnant now covered also by X-ray observa-tions, it becomes possible to compare the morphology of the shell in TeV, radio, and X-ray bands. The TeV and radio shells have been reported to have relatively flat azimuthal profiles (H.E.S.S. Collaboration et al. 2011), which does not seem to be the case for X-rays where the western part of the remnant is dimmer than the rest of the shell.
For a meaningful comparison, however, it is important to ac-count for non-uniform absorption. The apparent blue tint of the false-colour mosaic image (Fig.1) is mostly due to the absorption
0 2 4 6 8 10 12 Distance, kpc −0.05 0.00 0.05 0.10 0.15 0.20 E(H-K)
Fig. 8.Mid-infrared extinction as a function of distance in the direction
of the remnant. The points and uncertainties correspond to mean and standard deviation of values reported bySchultheis et al.(2014) aver-aged within a circle with radius of 0.25◦centred on the CCO. The red
line shows the extinction as a function of distance for the dense filament marked in Fig.11(the respective uncertainties are not shown for clarity, but they are a factor of two smaller than for the black points).
of the soft flux by the interstellar medium and not to a significant change in hardness of the SNR emission, so the absorption is important. However, the overall impact of the absorption on the observed X-ray flux is minor as the shell spectrum is relatively hard and the absorption only varies by a factor of three. To better illustrate this point and enable a direct comparison of the X-ray shell morphology with other bands, we estimated the intrinsic X-ray flux based on the results of the spectral analysis. The cor-rected image reveals no significant variation in hardness of the extended emission as illustrated in the left panel of Fig.9. The overall intensity of the X-ray flux and the shape of the shell are also not significantly affected, which is actually not surprising given the relatively hard spectrum of the shell and that the ab-sorption column density only varies by factor of three across the remnant. We use, therefore, the full-band (0.4–10 keV) X-ray image for comparison with the radio and TeV maps.
The morphology in the radio band seems to depend on fre-quency (Nayana et al. 2017). However, a detailed analysis of the radio data is still ongoing, so we limit the comparison to the 325 MHz band where the shell seems to be best defined. For a quantitative comparison we also smooth all three maps with a 3.60Gaussian kernel corresponding to the point spread
func-tion of the TeV map. We also excluded the bright HII region to the west of the remnant prior to convolution of the radio map, as illustrated in Fig.9. Using the convolved maps, we obtained azimuthal surface brightness profiles for all three bands similar to those reported byH.E.S.S. Collaboration et al.(2011). Taking into account that the shell is well-defined in both X-ray and ra-dio bands, we considered a ring with inner and outer radii of 0.18 and 0.24 degrees, respectively, rather than integrating the emission from the complete shell. The results are presented in Figs.9and10and indeed confirm the initial observation of X-ray dimming towards the western part of the remnant. Interestingly, the smoothed 325 MHz radio map seems to follow the same trend, and in general exhibits a behaviour similar to that in X-rays. On the other hand, the TeV emission shows no significant azimuthal variations with the western part being one of the brightest parts of the shell.
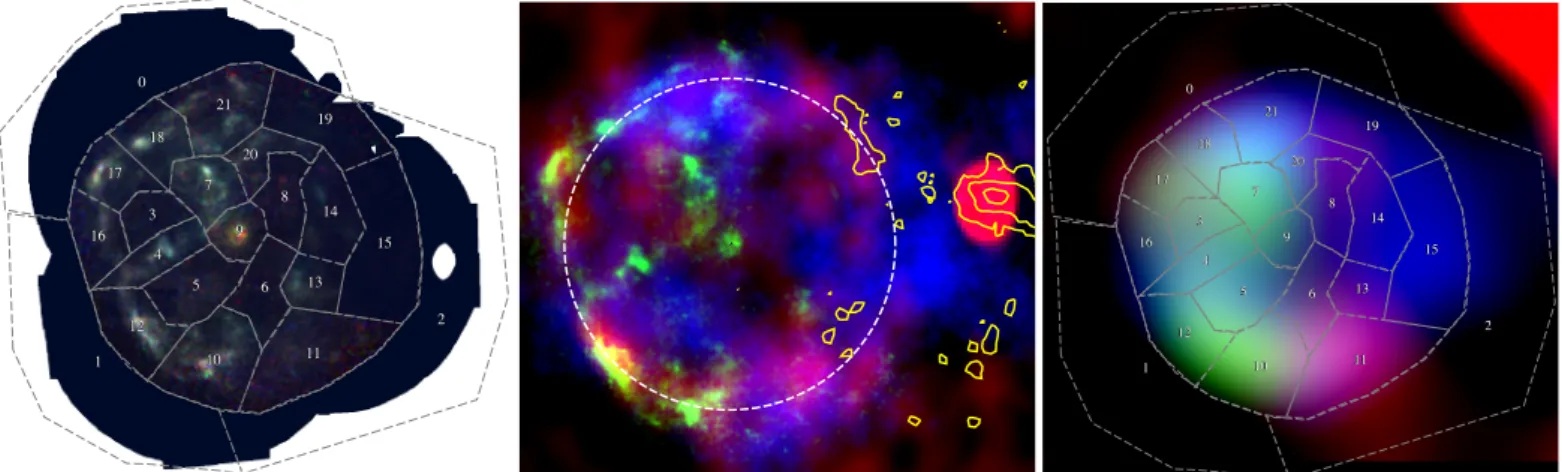
21 20 19 18 17 16 15 14 13 12 11 10 9 8 7 6 5 4 3 2 1 0 21 20 19 18 17 16 15 14 13 12 11 10 9 8 7 6 5 4 3 2 1 0 21 20 19 18 17 16 15 14 13 12 11 10 9 8 7 6 5 4 3 2 1 0 21 20 19 18 17 16 15 14 13 12 11 10 9 8 7 6 5 4 3 2 1 0
Fig. 9. X-ray image screened for point source contribution and corrected for the identified background components and absorption representing the
intrinsic source flux (left panel). The bright blob in the centre of the X-ray shell is due to residual emission from the bright CCO. A comparison of the SNR shell morphology in radio (red, GMRT), X-ray (green, XMM-Newton), and TeV (blue, HESS) bands is shown in the middle and right panels. The dashed circle centred on the CCO indicates an approximate extension of the SNR shell based on the X-ray and radio intensity. The bright radio and X-ray filaments seem to be well correlated (middle panel). However, the radio shell is more symmetric and extends further towards the Galactic plane. There seems to be a correspondence between the continuum radio and sub-mm emission (yellow contour) tracing the cold dense region also noted byMaxted et al.(2015) in the CS MOPRA data. The right panel shows all three bands smoothed with a 0.06◦Gaussian,
corresponding to the PSF of the HESS data. We note region 15 at l ∼ 353.5, b ∼ −0.5 where the shell is only bright in TeV.
West North East South West −1.0 −0.5 0.0 0.5 1.0 1.5 Norm. surface brightness radio X-ray TeV
Fig. 10.Shell azimuthal surface brightness profile in TeV, X-ray, and
radio bands. The shell is assumed to be centred on the CCO and have radius from 0.18◦to 0.24◦. The radio and X-ray images were smoothed
with the HESS psf to allow meaningful comparison. X-ray and radio emission are both suppressed towards the Galactic plane (i.e. western or spectral extraction regions 15, 19), whereas the TeV profile is consistent with being flat.
3.4. Distance and association with the molecular cloud As already mentioned, a rather robust lower limit on the dis-tance can be obtained, due to the spatial correlation of the X-ray absorption and the12CO emission from material located in the
Scutum-Crux arm at ∼3 kpc. On the other hand, the observed TeV flux implies that the distance to the source cannot be much larger than that (i.e. not behind the Galactic centre). Most star forming regions trace the Galactic spiral arms, so this immedi-ately triggered the idea that the remnant might be in the same arm and interact with the foreground molecular cloud. To confirm this hypothesis, however, an independent distance estimate to the source was needed, which proved to be more difficult.
The analysis of the X-ray spectrum of the central compact object suggests that distances larger than ∼5 kpc imply uncom-fortably large NS radii for the CCO in the centre of the remnant (Klochkov et al. 2013,2015), so the remnant most likely resides
either in the Scutum-Crux (∼3 kpc) or in the Norma-Cygnus (∼4.5 kpc) Galactic arms.
The distance to the source can also be estimated by mod-elling the SED of a bright central star illuminating the recently discovered dust shell within the remnant that is also associated with the CCO (Doroshenko et al. 2016). In particular, for stan-dard dust compositionVickers et al.(2015) estimate a distance of 3.8(7) kpc, i.e. close to the lower limit obtained above.
This estimate is barely consistent with the distance estimate of ∼5.2 kpc obtained byFukuda et al.(2014) based primarily on a qualitative comparison of the morphology of the TeV and HI radio emission. We note, however, that Maxted et al. (2015), using the higher resolution MOPRA data, detected no significant CS emission around υLSR= −85 km s−1suggested byFukuda et al.
(2014). On the other hand, Maxted et al. (2015) were able to detect several dense clumps of matter at υLSR ∼ −15 km s−1
(corresponding to a distance of ∼3 kpc) seemingly aligned with the SNR shell as observed in radio continuum. It is interesting to note that this velocity is close to the peak in12CO emission at
∼−18 km s−1, which, as discussed above, is associated with the bulk of matter responsible for the X-ray absorption.
Higher resolution MOPRA maps presented byMaxted et al. (2015) show that the velocity of the denser clumps tracing the western rim of the SNR deviates slightly from that for the bulk of the surrounding material. A similar behaviour is, in fact, also observed in other interacting SNRs (Moriguchi et al. 2005; Castelletti et al. 2013), and thus can be viewed as an argument for the physical association of HESS J1731−347 with the molecular cloud at ∼−18 km s−1. The absence of such peculiarities in the
ve-locity of the nearby material was quoted byNayana et al.(2017) as an argument against the interaction of the SNR with nearby molecular clouds, which thus does not hold. It should be noted, however, that this argument was motivated byDame et al.(2001) data which has limited spatial resolution, so it would be hard to notice any peculiarities in the first place. The main issue with this argument is that the mechanisms responsible for acceleration of clumps are unclear, and that the clumps themselves are rather compact, so there is a possibility of a random spatial coincidence with the shell. This possibility could be ruled out with more sen-sitive and higher resolution radio observations which would more
0.0 0.5 1.0 1.5 2.0 2.5 3.0 3.5 AV,rel 0.5 1.0 1.5 2.0 2.5 3.0 3.5 NH ,10 22 cm − 2 -3 -2.97 -2.91 -2.78 -2.53 -2.02 -1.03 0.961 4.97 12.9 28.7
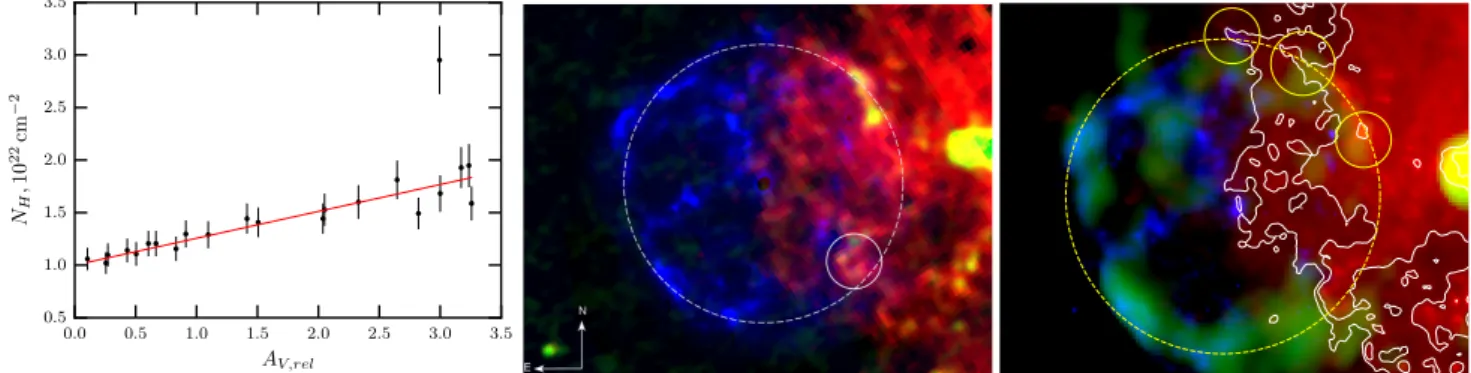
Fig. 11. Correlation of the absorption column measured from the spatially resolved spectral analysis of XMM-Newton data and the relative reddening
derived from VVV photometry (left panel). The outlier point corresponds to region 2 where the optical extinction is underestimated due to the lack of stars in the optical data. We find NH∼1+ AV,rel/4 from a linear fit including a 10% systematic uncertainty for the column measured in X-rays. A
composite image of the calibrated absorption column density map derived from optical extinction (red) and ATLASGAL 0.87 mm (green) maps is shown together with the X-ray 0.4–10 keV image (blue) for reference in the middle panel. We note the enhanced absorption along the western rim of the remnant, particularly along its north-western part. The same features can be traced in the composite image showing X-ray (blue), radio (green), and 350 µm Herschel/SPIRE data (right panel). The white contours correspond to Herschel data to highlight the extension of the filament in the north-west in northern direction where it bridges with the X-ray filament as shown with the northernmost yellow circle (see also the middle panel where the X-ray filament is more clearly seen). The other two circles emphasise the correspondence between the infrared and radio data along the filament.
accurately trace the western rim of the SNR both in lines and continuum.
Here we add that to some extent the alignment of the dense clumps with the SNR shell can be confirmed by an analysis of data from other wavelengths. In particular, the dense clumps traced by CS emission can also be observed as a thin dark filament in Spitzer MIPS/IRAC data (Doroshenko et al. 2016, see Fig. 1), and in submillimetre emission in the ATLASGAL survey (Schuller et al. 2009) as illustrated in Fig.9. Moreover, the same structure can also be detected in optical extinction maps where it can be traced along the entire western part of the remnant, and seems to be perfectly aligned with the detected X-ray shell in the north-west. While this does not unambiguously prove their association, such a coincidence seems unlikely to be just by chance.
To estimate the column density from optical reddening we used the recently released PNICER package (Meingast et al.
2017), and photometry from the VISTA VVV survey
(Minniti et al. 2010). The extinction map with an angular res-olution of 10was produced using the mid-infrared colours and
the spectral extraction region 1 as a reference field. The result was then calibrated to the neutral column density using the ab-sorption column densities measured across the remnant using XMM-Newton data as illustrated in Fig.11. It is important to emphasise that the X-ray absorption and optical extinction are closely correlated, with the sole exception of region 2 where the extinction is underestimated due to the strong absorption. The resulting absorption map is closely correlated with the sub-mm emission coming from the most absorbed areas (which also coincides with the CS emission in radio), and arguably better illustrates the alignment of the absorbing material with the north-ern edge of the remnant. The individual clumps detected in the CS and sub-mm bands also correspond to the strongest extinction; however, a less intense rim connecting them is also visible in the extinction map. We note that the filament detected in CS/sub-mm in regions 15–19 extends further to the north in the extinction map, and is aligned with the X-ray shell.
It is interesting to note that in the infrared band, these fila-ments are clearly observed to be in the foreground with respect to the bulk of the emitting material (see Fig. 1 inDoroshenko et al. 2016), which is likely associated with the CO emitting material and is thus responsible for the X-ray absorption. The 3D mapping of the mid-infrared extinction bySchultheis et al.(2014) seems
to support this observation, although the resolution of the pub-lished maps is probably insufficient to draw any firm conclusions. Nevertheless, the larger filament in the south-west marked with a circle in Fig.11has a comparable size to and is aligned with the filament shown in the 3D extinction map sky pixels presented bySchultheis et al.(2014). As shown in Fig.8, the distribution of matter in this direction is similar to that within the entire rem-nant, which suggests that the bulk of the absorbing material in the filament must be relatively close to the larger cloud. However, the distribution seems to be slightly skewed to the front, which could explain why the filaments appear dark in the infrared.
On the other hand, as concluded above, the filament seems to be aligned with the western rim of the SNR and thus is at the same distance as the remnant itself. However, the remnant must be in the background of the material absorbing X-ray and optical emission. There is, therefore, an apparent contradiction since the remnant and the filament cannot be in front of and behind the molecular cloud at the same time. This is possible if the apparent alignment is still a chance coincidence or if the remnant and the molecular cloud responsible for the absorption of the observed X-ray emission are actually at the same distance and interact with each other. In this case the fact that part of the shell appears in the foreground could be explained by irregularities in the distribution of material within the absorbing cloud.
This conclusion is supported by the fact that no significant X-ray emission is detected from the western part of the remnant. Indeed, there is an apparent difference in the X-ray morphology in the eastern and western parts which needs to be explained. The easiest explanation is then that the SNR shock encountered dense material in the west and slowed to the point when synchrotron falls out of the X-ray band (keeping in mind that radio emission is still observed from the region). This scenario has in fact been discussed byCui et al.(2016), who suggested that the observed X-ray synchrotron emission from the shell requires high shock velocities, which can only be retained if the remnant expands into an essentially empty stellar bubble blown by the progenitor. The absence of X-ray emission from the western part suggests that the shock velocity is much lower there, pointing to interac-tion with dense molecular clouds. If this is indeed the case, the interaction must have started quite recently since otherwise the circular shape of the radio and TeV shells would also have been distorted. Furthermore, once the interaction starts the strong shock
must start heating the swept-up material, eventually producing thermal X-ray emission which has not yet been detected.
We note that in the case of the SNR RX J1713.7−3946, which displays a similar large-scale X-ray intensity trend, a different scenario has been invoked. There, the X-ray brightening has been interpreted as coming from an interaction with molecular clouds, while the dimmer part has been associated with lower density surrounding materialCassam-Chenaï et al.(2004). In the case of HESS J1731−347, this interpretation is not supported by the available gas density tracers. Also, the TeV emission in the west of the SNR which does not follow the dimming trend would need to be explained by processes not directly related to the SNR. A more straightforward explanation is therefore opposite to RX J1713.7−3946, namely that the SNR shock encountered dense material in the X-ray dim regions.
Alternatively, the absence of bright filaments in the western part could be explained as being projection effects. However, this also requires interaction with the inhomogeneous medium. We conclude, therefore, that the possibility that the remnant interacts with the cloud is consistent with observations, and this region is thus a plausible target to search for high energy hadronic emission. In particular, it would be important to search for changes in the TeV spectrum in the western part of the remnant with additional VHE observations. Indirect evidence can also be obtained based on deeper radio observations aimed to better constrain suggested changes of the spectral index, and independently estimate the magnetic field as discussed byNayana et al.(2017).
4. Conclusions
XMM-Newton observations of the SNR HESS J1731−347 cov-ered the entire shell visible in TeV and radio bands for the first time. In the X-ray band, the morphology of the remnant is quite irregular: the eastern part is considerably brighter than the west-ern part (which is closer to the Galactic plane). The emission from the eastern part is dominated by narrow, well-defined fila-ments correlated with radio emission, whereas the western part is dimmer and more diffuse. A spatially resolved spectral analysis confirmed the previously reported (H.E.S.S. Collaboration et al. 2011) non-thermal origin for the X-rays. The increase in the ab-sorption column towards the Galactic plane is correlated with the CO emission observed in radio, which puts a lower limit on the distance to the source of ∼3.2–4 kpc. This estimate is consis-tent with the observed velocities of dense CS clumps reported by Maxted et al. (2015), which indeed seem to be tracing the western rim of the shell.
Based on the updated X-ray and radio fluxes, we find that the broadband spectral energy distribution is consistent with syn-chrotron in the radio to X-ray and inverse Compton in the TeV bands, although the morphology of the shell in the respective bands seems to be slightly different. In particular, the X-ray and radio continuum emission is suppressed towards the Galactic plane, which is not the case for the TeV emission where the shell shows a flat azimuthal profile. Taking into account the CS emis-sion and enhanced optical extinction along the western part of the remnant, we conclude that the remnant is most likely interacting with the nearby dense molecular cloud. This conclusion supports the SNR evolution scenario outlined byCui et al.(2016), and might signify that part of the observed TeV emission actually has a hadronic origin.
Based on the spatially resolved spectral analysis of the extended emission we do not find, however, any significant
variations in the intrinsic X-ray spectrum of the shell, which could be expected for a remnant interacting with the non-uniform ISM. On the other hand, minor variations in the X-ray spectrum still cannot be completely excluded due to the strong stray-light contamination affecting the XMM-Newton data. Furthermore, the brightness of the shell in the western part is not sufficient for a detailed spectral analysis. The fact that it is so low can be inter-preted as an argument supporting the interaction of the shell with the cloud. Finally, we also find no evidence for thermal emission from the ejecta or reverse shock. The latter is not surprising given the amount of cold dust observed within the shell.
Acknowledgements. The authors would like to thank the Deutsches Zentrums für Luft- und Raumfahrt (DLR) and Deutsche Forschungsgemeinschaft (DFG) for financial support (grants DLR 50 OR 0702, FKZ 50 OG 1301, SA2131/1-1, FKZ OR 1310). W. W. Tian acknowledges support from the NSFC (11473038). A.B. acknowledges support from the Grant-in-Aid for Scientific Research of the Japanese Ministry of Education, Culture, Sports, Science and Technology (MEXT) of Japan, No. 15K05107. The authors thank the anonymous referee for the timely and useful comments which helped to improve the manuscript.
References
Acero, F., Lemoine-Goumard, M., Renaud, M., et al. 2015,A&A, 580, A74
Bamba, A., Yamazaki, R., Ueno, M., & Koyama, K. 2003,ApJ, 589, 827
Bamba, A., Yamazaki, R., Yoshida, T., Terasawa, T., & Koyama, K. 2005,ApJ, 621, 793
Bamba, A., Pühlhofer, G., Acero, F., et al. 2012,ApJ, 756, 149
Berezhko, E. G., & Völk, H. J. 2008,A&A, 492, 695
Cappelluti, N., Brusa, M., Hasinger, G., et al. 2009,A&A, 497, 635
Cassam-Chenaï, G., Decourchelle, A., Ballet, J., et al. 2004,A&A, 427, 199
Castelletti, G., Supan, L., Dubner, G., Joshi, B. C., & Surnis, M. P. 2013,A&A, 557, L15
Cui, Y., Pühlhofer, G., & Santangelo, A. 2016,A&A, 591, A68
Dame, T. M., Hartmann, D., & Thaddeus, P. 2001,ApJ, 547, 792
Doroshenko, V., Pühlhofer, G., Kavanagh, P., et al. 2016, MNRAS, 458, 2565
Ebisawa, K., Yamauchi, S., Tanaka, Y., et al. 2008,PASJ, 60, S223
Fukuda, T., Yoshiike, S., Sano, H., et al. 2014,ApJ, 788, 94
Gabici, S., & Aharonian, F. A. 2014,MNRAS, 445, L70
Haverkorn, M., Gaensler, B. M., McClure-Griffiths, N. M., Dickey, J. M., & Green, A. J. 2006,ApJS, 167, 230
H.E.S.S. Collaboration, Abramowski, A., Acero, F., et al. 2011,A&A, 531, A81
Klochkov, D., Pühlhofer, G., Suleimanov, V., et al. 2013,A&A, 556, A41
Klochkov, D., Suleimanov, V., Pühlhofer, G., et al. 2015,A&A, 573, A53
Maxted, N., Rowell, G., de Wilt, P., et al. 2015, ArXiv e-prints [arXiv:1503.06717]
Meingast, S., Lombardi, M., & Alves, J. 2017,A&A, 601, A137
Minniti, D., Lucas, P. W., Emerson, J. P., et al. 2010,New Astron., 15, 433
Moriguchi, Y., Tamura, K., Tawara, Y., et al. 2005,ApJ, 631, 947
Morrison, R., & McCammon, D. 1983,ApJ, 270, 119
Nayana, A. J., Chandra, P., Roy, S., et al. 2017,MNRAS, 467, 155
Revnivtsev, M., Sazonov, S., Gilfanov, M., Churazov, E., & Sunyaev, R. 2006,
A&A, 452, 169
Schuller, F., Menten, K. M., Contreras, Y., et al. 2009,A&A, 504, 415
Schultheis, M., Chen, B. Q., Jiang, B. W., et al. 2014,A&A, 566, A120
Tian, W. W., Leahy, D. A., Haverkorn, M., & Jiang, B. 2008,ApJ, 679, L85
Tian, W. W., Li, Z., Leahy, D. A., et al. 2010,ApJ, 712, 790
Uchiyama, Y., Aharonian, F. A., Tanaka, T., Takahashi, T., & Maeda, Y. 2007,
Nature, 449, 576
Valinia, A., & Marshall, F. E. 1998,ApJ, 505, 134
Vickers, S. B., Frew, D. J., Parker, Q. A., & Bojiˇci´c, I. S. 2015,MNRAS, 447, 1673
Vuong, M. H., Montmerle, T., Grosso, N., et al. 2003,A&A, 408, 581
Yang, R.-Z., Zhang, X., Yuan, Q., & Liu, S. 2014,A&A, 567, A23
Yuasa, T., Makishima, K., & Nakazawa, K. 2012,ApJ, 753, 129
Zabalza, V. 2015,Proc. of International Cosmic Ray Conference 2015, 922