HAL Id: hal-01059876
https://hal.archives-ouvertes.fr/hal-01059876
Submitted on 7 Mar 2019
HAL is a multi-disciplinary open access
archive for the deposit and dissemination of
sci-entific research documents, whether they are
pub-lished or not. The documents may come from
teaching and research institutions in France or
abroad, or from public or private research centers.
L’archive ouverte pluridisciplinaire HAL, est
destinée au dépôt et à la diffusion de documents
scientifiques de niveau recherche, publiés ou non,
émanant des établissements d’enseignement et de
recherche français ou étrangers, des laboratoires
publics ou privés.
A nexus of plate interaction: Vertical deformation of
Holocene wave-built terraces on the Kamchatsky
Peninsula (Kamchatka, Russia)
Tatiana Pinegina, Joanne Bourgeois, Ekaterina A. Kravchunovskaya,
Alexander V. Lander, Maria E.M. Arcos, Kevin Pedoja, Breanyn T. Macinnes
To cite this version:
Tatiana Pinegina, Joanne Bourgeois, Ekaterina A. Kravchunovskaya, Alexander V. Lander, Maria
E.M. Arcos, et al.. A nexus of plate interaction: Vertical deformation of Holocene wave-built
ter-races on the Kamchatsky Peninsula (Kamchatka, Russia). Geological Society of America Bulletin,
Geological Society of America, 2013, 125 (9-10), pp.1554-1568. �10.1130/B30793.1�. �hal-01059876�
A nexus of plate interaction: Vertical deformation of Holocene
wave-built terraces on the Kamchatsky Peninsula (Kamchatka, Russia)
Tatiana K. Pinegina
1,†, Joanne Bourgeois
2,†, Ekaterina A. Kravchunovskaya
3,§, Alexander V. Lander
4,†,
Maria E.M. Arcos
5,†, Kevin Pedoja
6,†, and Breanyn T. MacInnes
7,†1
Institute of Volcanology and Seismology FED RAS, Petropavlovsk-Kamchatsky 683006, Russia
2Department of Earth and Space Sciences, University of Washington, Seattle, Washington 98195, USA
3Institute of Volcanology and Seismology FED RAS, Petropavlovsk-Kamchatsky 683006, Russia
4
Institute of Earthquake Prediction Theory and Mathematical Geophysics RAS, Moscow 117997, Russia
5AMEC, 2101 Webster Street, Oakland, California 94612, USA
6
UMR Centre National de la Recherche Scientifi que 6143, “Morphodynamique Continentale et Côtière” (M2C), Université
de Caen, 2-4 rue des Tilleuls, 14000 Caen, France
7
Department of Geological Sciences, Central Washington University, Ellensburg, Washington 98926, USA
ABSTRACT
Kamchatsky Peninsula lies within a com-plex meeting place of tectonic plates, in particular, the orthogonal interaction of the west-moving Komandorsky Island block with mainland Kamchatka. Examining the Holocene history of vertical deformation of marine wave-built terraces along the penin-sular coast, we differentiated tectonic blocks undergoing uplift and tilting separated by zones of stable or subsided shorelines. We analyzed ~200 excavations along >30 coastal profi les and quantifi ed vertical deformation on single profi les as well as along the coast us-ing paleoshorelines dated with marker teph-ras. For the past ~2000 yr, the average rates of vertical deformation range from about –1 to +7 mm/yr. Uplift patterns are similar to those detected from historical leveling and from mapping of the stage 5e Quaternary marine terrace (ca. 120 ka). Average verti-cal deformation in the Holocene is highest for the shortest studied time period, from ca. A.D. 250 to 600, and it is several times faster than rates for marine oxygen isotope stage (MIS) 5e terraces. Vertical displace-ments observed along the coast are most likely coseismic and probably have included subsidence as well as uplift events. Because subsidence is generally associated with ero-sion, almost surely more prehistoric large
earthquakes occurred than are recorded as topographic steps in these terraces. We sug-gest that the distribution of coastal uplift and subsidence observed along the Kamchatsky Peninsula coastline is qualitatively explained by the squeezing of the Kamchatsky Penin-sula block between the Bering and Okhotsk plates, and the Komandorsky Island block. INTRODUCTION
Geodynamic Setting
Among the promontories along the eastern coast of Kamchatka, the Kamchatsky Peninsula lies in the most complex tectonic setting (Fig. 1). It is diffi cult to fi nd analogous places on the planet. While parts of Taiwan (Hsieh et al., 2004), Japan (Tamura et al., 2010), northern California (Merritts, 1996), and elsewhere are complex collisional, triple-junction, and multi plate loca-tions, they have a smaller variety of geodynamic regimes over areas of the same spatial scale as the Kamchatsky Peninsula (~100 km length and 50 km width). The peninsula is situated at the northern terminus of the Kuril-Kamchatka sub-duction zone and where the Komandorsky Island block, moving parallel to the Aleutian trench, impinges on the Kamchatka mainland (Seliver-stov, 1998, 2009). The region to the north of Kamchatsky Peninsula is interpreted to be the boundary between the Okhotsk and Bering plates (Lander et al., 1996; Mackey et al., 1997; Cross and Freymueller, 2008; Fig. 1).
The general explanation for the topographic expression of the Kamchatsky Peninsula is col-lision of the extinct Eocene Kronotsky island arc or the Aleutian-Komandorsky chain (at its
western extent identifi ed as the Komandorsky Island block) with the Kamchatka mainland (Geist and Scholl, 1994; McElfresh et al., 2002; Alexeiev et al., 2006; Lander and Shapiro, 2007; Scholl, 2007; Levin, 2009; Fig. 1), although some alternatives have been suggested (e.g., Kozhurin, 2007; for review, see Scholl, 2007,). Recent global positioning system (GPS) mea-surements show the Komandorsky Island block is moving west-northwest at a rate roughly half the rate of Pacifi c plate movement relative to Kamchatka (Fig. 1; Apel et al., 2006; Cross and Frey mueller, 2008; Levin, 2009). However, we emphasize that the term “collision” in the con-text of Holocene tectonics may need qualifi ca-tion, in that the Komandorsky Island block is separated from Kamchatsky Peninsula by the >4000-m-deep Kamchatsky Strait, indicating thinner, if not oceanic, crust (Figs. 1B and 2). There is also the question of the mechanisms by which the strike-slip motions within and bounding the Komandorsky Island block are translated (or not) to the Kamchatsky Peninsula, and the way in which shear might be distributed between the Komandorsky Island block and the Kamchatka mainland. Other aspects of this region of nexus include the northwestern termi-nation of the Pacifi c plate, as interpreted from seismic and geochemical data, and the north-ern termination of the active Kamchatka arc at Shiveluch volcano (Fig. 1; Levin et al., 2002; Park et al., 2002; Portnyagin et al., 2005).
Holocene Marine Terraces
Marine terraces record changes in relative sea level because their morphology is indica-tive of sea-level elevation at the time of terrace
†E-mails: [email protected] (Pinegina); jbourgeo@
uw.edu (Bourgeois, corresponding); [email protected] (Lander); [email protected] (Arcos); kevin [email protected] (Pedoja); macinnes@geology .cwu.edu (MacInnes).
formation (Lajoie, 1986). The magnitude and rate of relative sea-level variation are major controls on the formation of marine terraces (wave-built or wave-cut), and on their height and morphology. Change in relative sea level is a product of regional or global sea-level rise and fall, and of more local vertical land movements such as from tectonic uplift or subsidence. In tectonically active areas, regional sea-level change over the late Holocene has been small relative to land-level changes (e.g., Chen and Liu, 2000); therefore, Holocene terraces can be distinct markers of neotectonic processes such
as active faulting, tilting, intrusion and infl ation, and vertical coseismic deformation.
Globally, more work has been conducted on Pleistocene marine terraces generated dur-ing interglacial, global highstands of sea level (review in Pedoja et al., 2011), than on uplifted Holocene marine terraces, which are typically restricted to areas of active tectonics (Lajoie, 1986). Moreover, most work on Holocene ter-races has focused on wave-cut platforms and emergent coral reefs, rather than on the type of wave-built terraces (platforms) that are com-mon in the Kamchatsky fi eld area. Age control
on Holocene marine terraces has been derived primarily from radiocarbon dating of associated faunal or plant material; a few studies have used optically stimulated luminescence dating (OSL; e.g., Bookhagen et al., 2006; Pfl anz et al., 2013). The largest body of work on Holocene marine terraces has been carried out in the western Pacifi c (review by Ota and Yamaguchi, 2004), in particular in Japan (e.g., Sugihara et al., 2003; Ota and Yamaguchi, 2004; Tamura et al., 2010), Taiwan (e.g., Yamaguchi and Ota, 2002; Hsieh et al., 2004), New Zealand (Wilson et al., 2006; Berryman et al., 2011), and Papua New Guinea (e.g., Chappell et al., 1998). Other sites of study include Chile (Nelson and Manley, 1992; Bookhagen et al., 2006), the Mendocino triple junction (Merritts, 1996), and Indonesia (Vita-Finzi and Situmorang, 1989; Merritts et al., 1998; Briggs et al., 2008).
The coast of the Kamchatsky Peninsula in many places consists of fl ights of Pleistocene and Holocene terraces (Fig. 2; Pedoja et al., 2006, 2011). The shape of coastal cross-sectional profi les through these marine ter-races depends on the rate and nature (gradual or discrete) of relative sea-level change. The “stair steps” of Holocene terraces here are sometimes separated by scarps from 0.5 m to several meters high (Fig. 2). Given that regional sea level has been essentially stable since 5000–6000 yr ago (Peltier, 2002; Wood-roffe and Horton, 2005), we take the presence of these steps as evidence of rapid or abrupt uplift events during the Holocene. The steep erosional scarps indicate former episodes of coastal erosion, possibly due to relative sea-level rise during coastal subsidence. Thus, the morphology of the Holocene marine terraces of Kamchatsky Peninsula provides evidence of repeated high-amplitude (up to a few meters) changes in relative sea level during the past several thousand years.
The study of shoreline changes within Kam-chatsky Peninsula is important because it can help elucidate the tectonic processes where Kamchatka and the Aleutian-Komandorsky chain interact. Several prior studies have exam-ined both the instrumental (historic) and the Quaternary (105 yr) and longer time scales of
tectonic movement of the Kamchatsky Penin-sula; less attention has been paid to deforma-tion on the Holocene time scale. The century to millennial scale of our work is long enough to manifest the main tendencies of Holocene tectonic deformation of Kamchatsky Penin-sula blocks, but short enough to examine more specifi c questions such as: Are these vertical movements gradual or discrete, and are they unidirectional or alternating in their sense? How are the motions of active faults expressed
55° 56°
162° 166°
57°
164°
Bering transform zone (t.z.)
Steller t.z. Pikezh t.z. 80 mm/yr ~40 mm/yr 1984-12-28
X
Y
B
–5500 m –4500 m –3500 m 50 kmX
Y
Pacific Ocean Kamchatsky Strait
Steller t.z. Pikezh t.z. Bering t.z.
Komandorsky Basin Bering Island 50 km Kamchatsky Peninsula Kronotsky Peninsula 1971-12-15 Shiveluch Krutoberegovo 1997-12-5
A
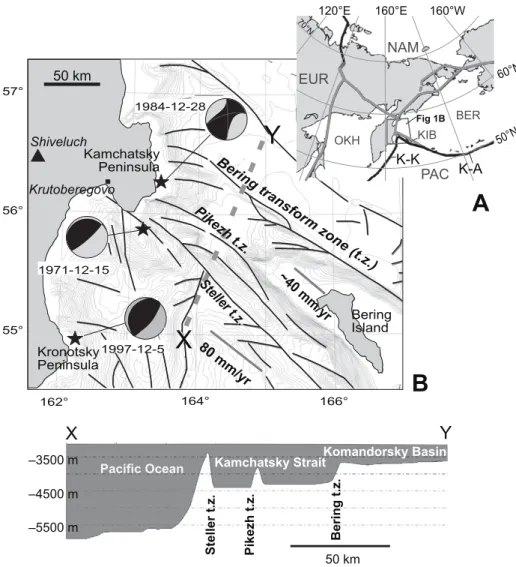
70°N 60°N 50°N EUR NAM OKH BER PAC KIB Fig 1B 120°E 160°E 160°W K-A K-KFigure 1. Tectonic setting of the Kamchatsky Peninsula. (A) Plate model for the NE Pacifi c region, adapted from Mackey et al. (1997) and Bourgeois et al. (2006). NAM—North Ameri-can plate, EUR—Eurasian plate, PAC—Pacifi c plate, BER—Bering plate, OKH—Okhotsk plate, KIB—Komandorsky [Commander] Island block (McElfresh et al., 2002), K-A—Ko-mandorsky-Aleutian trench, K-K—Kuril-Kamchatka Trench. Well-defi ned plate boundar-ies are shown in black; more diffuse boundarboundar-ies are shown in gray. (B) Bathymetry (200 m contour interval) and major offshore faults near the Kamchatsky Peninsula (Seliver stov, 1998). The plate motion and three historical earthquakes shown are discussed in the text. Location of Shiveluch volcano is shown. Below: Profi le X-Y, along X-Y line on 1B, showing depths of the Pacifi c Ocean, Kam chatsky Strait, and the Komandor sky Basin.
topographically along the coast? This paper pre sents the results of our study of Holocene marine terraces, an approach that has been shown to be productive on other tectonically active margins (Chen and Liu, 2000; Hsieh et al., 2004; Bookhagen et al., 2006; Litchfi eld et al., 2010; Berryman et al., 2011).
PRIOR NEOTECTONIC OBSERVATIONS ON KAMCHATSKY PENINSULA Instrumental Records
Seismicity
South of the Kamchatsky Peninsula, the sub-ducting Pacifi c plate typically generates low-angle reverse-fault earthquakes in a Benioff-zone pattern, whereas on the Komandorsky segment of the Aleutian zone, right-lateral strike-slip earthquakes are prevalent (Gorbatov et al., 1997; Mackey et al., 2010). The seis-micity of the junction area—the Kamchatsky Peninsula region—is neither Benioff zone nor transform, but is dominated by shallow, reverse and oblique-slip faulting. Thrusts with subhori-zontal, NW-SE–oriented compression are prev-alent, though there are a few normal-mechanism exceptions, for example, the earthquake of 27 August 2000 with Mb 4.9 (Global Centroid Moment Tensor Catalog, http://www.globalcmt .org/CMTsearch.html; see also Pinegina et al., 2010, their Fig. 7). Of note, the 15 December 1971 earthquake (Mw 7.8) (Fig. 1) and its after-shocks indicate oblique slip; the earthquake mechanism was thrust with a strike-slip compo-nent (Gusev and Zobin, 1975; Cormier, 1975; Okal and Talandier, 1986). The amount of slip calculated using seismic data was ~8 m, and the rupture produced a tsunami (Martin et al., 2008). The 28 December 1984 earthquake (Mw 6.7) (Fig. 1), occurring near Cape Africa, was originally interpreted by Fedotov et al. (1985) as strike slip with a minor thrust component. How-ever, according to the Global Centroid Moment Tensor catalogue, it is not a clear double-couple mechanism and can be represented as a combi-nation of E-W dextral strike slip and NW-SE compression, compensated linear-vector dipole (CLVD) tensor.
Leveling
On the Kamchatsky Peninsula, by repeat lev-eling along the coast in the period 1971–1986, Kirienko and Zolotarskaya (1989) established that average vertical movement rates were up to 10 mm/yr (Fig. 3). Leveling before and after the Mw 7.8 15 December 1971 earthquake mea-sured relative vertical movement up to 80 mm of benchmarks situated on the coast (Levin et al.,
2006). In 1972–1973, repeat measurement of relative elevations along the leveling lines from Cape Kamchatsky to Ust’-Kamchatsk (along the southern coast of the peninsula) and Pikezh River to Ozernoy Bay (eastern and northern coasts) showed that after the earthquake, the earth surface tilted to the NW (Kirienko and Zolotarskaya, 1989). Vertical deformation was also recorded in the 28 December 1984 earth-quake; near Cape Africa, the relative vertical movement of benchmarks reached ~40 mm (Fig. 3).
Global Positioning Systems (GPS)
Since establishment of GPS instrumentation in the region (see Levin et al., 2006), no large earthquakes have occurred on or adjacent to the Kamchatsky Peninsula. However, the 1997 Kronotsky earthquake (December 5, Mw 7.8; see Fig. 1) did register coseismic and postseis-mic motion on nearby instruments at Kruto-beregovo and on Bering Island (Bürgmann et al., 2005).
GPS measurements show that the Aleutian-Komandorsky chain is moving toward Kam-chatka at a rate that increases to the west (Cross and Freymueller, 2008; Levin, 2009), with some indication of coupling with the Kamchatsky Peninsula. At the western end of the Koman-dorsky Island block, Bering Island moving ~35–50 mm/yr NW, relative to North America. On the western side of Kamchatsky Peninsula, Krutoberegovo is moving ~8–15 mm/yr (e.g., Bürgmann et al., 2005; Levin, 2009). However, because of the complex plate interactions of the region, and the short duration of the records, the deconvolution of GPS records into net plate motions is subject to interpretation (e.g., Apel et al., 2006; Kogan and Steblov, 2008).
Geomorphic and Geologic Analysis
Active Faults
Faults and structures connecting the Kam-chatsky Peninsula to Komandorsky Island block transform faults have been proposed but
55°47′N 163°12′E 56°05′N 161°37′E 57°04′N 162°13′E
N
PACIFIC
OCEAN
56°46′N 163°48′E Soldatskaya Bay Stolbovaya Bay Ust’ Kamchatsk Krutoberegovo Cape Africa Cape Kamchatsky Cape Reef Nerpich’e Lake Kultuchnoye LakeBERING
SEA
10 km
Kumroch
Range
Pikezh R. 1 Perevalnaya R. 2 Perevalnaya R. Ozernoy Bay Kamchatsky Strait d c 3/4 6 8 18 22 11 23 h Scales in m V.E. = 20 100 m 0 5 10 15 20Representative
Holocene
profiles
Figure 2. General topography based on digital elevation model (http://gs.mdacorporation. com/Mapping/DigitalElevationModels.aspx) of the Kamchatsky Peninsula region and ex-amples of measured Holocene marine-terrace profi les along the outer coast of the Kam-chatsky Peninsula (also see Fig. 1). The age of oldest terraces is 2000–4000 yr B.P. In all profi les, the shoreline is on the right side. Profi le numbers are indicated in the lower-left corners. V.E.—vertical exaggeration.
have not been mapped (Fig. 1). Gaedicke et al. (2000) and Freitag et al. (2001) suggested the continuation of transform faults associated with the Komandorsky block to structures within the Kamchatsky Peninsula. On the other hand, there is no geological or geophysical evidence of direct connections of Komandorsky Island block faults with the Kamchatsky Peninsula. Kozhurin (2007) trenched several faults on the peninsula and interpreted motions to be from clockwise rotation of the Kamchatsky Peninsula block caused by differential pressure of the imping-ing Komandorsky Island block, but he rejected a linkage of the faults to the offshore transform faults. Both groups have also analyzed aerial photographs of offset geomorphic features (e.g., Kozhurin, 2007; Baranov et al., 2010), with varying interpretations, discussed later herein. Lineaments
In another methodological approach, McElfresh et al. (2002) used geographical infor-mation systems to examine the interaction of the
Komandorsky Island block with Kamchatsky Peninsula. They analyzed clustering of linear features in the region and concluded that the patterns are best explained by the Komandorsky Island block moving rapidly toward Kamchatka, colliding and producing detectable lineaments represented on synthetic aperture radar (SAR) images in the Kamchatsky Peninsula. The age and activity of lineaments, however, are not well constrained, and air photos and our fi eld work show that some of the lineaments are geomor-phic features (for example, beach ridges, old shoreline angles).
Vertical Displacement
Uplift and exhumation rates on Kamchatsky Peninsula have been previously determined by mapping of Pleistocene terraces and by analysis of uplifted strata (Fedorenko, 1965; Erlikh et al., 1974; Freitag et al., 2001; Pedoja et al., 2006, 2011, 2013; Pfl anz et al., 2013). According to Pleistocene terrace data, rates of coastal vertical movements on Kamchatsky Peninsula, averaged
over a period of 120 k.y., range from 0.08 to 1.33 mm/yr (Pedoja et al., 2006). Based on apa-tite cooling ages, Freitag et al. (2001) reported exhumation rates in the later Cenozoic varying from 0.18 ± 0.04 mm/yr north of Cape Africa to 1.2 ± 0.18 mm/yr south of Cape Africa. Pfl anz et al. (2013) determined recent uplift rates of coastal sediments by “remote sensing via ASTER and SRTM DEM combined with opti-cally stimulated luminescence dating,” where ASTER is the Advanced Spaceborne Thermal Emission and Refl ection Radiometer and SRTM DEM is the Shuttle Radar Topography Mission digital elevation model. Pfl anz et al.’s (2013) late Quaternary uplift rates via OSL vary from 0.8 to 7.5 mm/yr, and some results disagree with our analyses. A full evaluation of their work is beyond the scope of this paper; however, their analysis of a profi le from Cape Africa (their Fig. 7) clearly disagrees with our analysis (see discussion presented in the Data Repository, including Fig. DR11).
METHODS Sea-Level Curve
Sea level is the datum by which we can reconstruct local vertical displacements, as long as we know the regional sea-level curve. A number of studies have generated sea-level curves for the Holocene of the northern Pacifi c (e.g., Selivanov, 1996a, 1996b; Douglas, 2001; Peltier, 2002; Woodroffe and Horton, 2005; Gehrels, 2010), the majority of which inter-pret a mid-Holocene sea-level highstand of 1–3 m from 5000 to 6000 yr B.P. and a return to approximately modern sea level from 4000 to 2000 yr B.P.
These model curves are in general agreement with our fi eld studies, where we interpret that the Pacifi c Ocean–Bering Sea along the east-ern coast of Kamchatka reached its maximal Holocene sea level at 5000–6000 yr B.P. (e.g., Pinegina et al., 2003, 2012; Bourgeois et al., 2006). This conclusion is based on multiple sur-veyed elevations of boundaries between coastal lagoon deposits and peat, dated using radiocar-bon and tephra stratigraphy (Bourgeois et al., 2006; Pinegina et al., 2012). The mid-Holocene high and stabilization of sea level were followed by progradation of marine wave-built terraces along many Kamchatka coastlines. From con-sistency of beach ridge elevations on tectoni-cally quiet Kamchatka coastlines (Martin et al.,
2 Perevalnaya R.
Cape Africa Chayachy spring 2 Nepropuskovaya R. Chertova melnitsa Rock
Kamchatskaya R.
Kamenny creek
Elevation relative to 1971 datum (mm)
Vertical displacement rate (mm/yr)
1971 140 100 60 20 –20 km 8 4 0 1985 1986 1972 1983 1975–1978 1971–1972 80 40 0 –20 1983–1985 1971–1986 1 Perevalnaya R. Pikezh R.
A
B
–20 0 40 0 10 Cape KamchatskyFigure 3. Measured, relative vertical displacements along the “Ust’-Kamchatsky testing area” (Kirienko and Zolotarskaya, 1989); the benchmark at Cape Kamchatsky was as-signed a zero displacement. The leveling y-axis is distance along the coast, not latitude, so there is some variance—approximately lined up with the First and Second Pereval’naya Rivers mouths. (A) Vertical displacement graphs for the period A.D. 1971–1986. Measure-ment errors for the different years do not exceed ±8 mm (original plot by Kirienko and Zolotarskaya, 1989). (B) Calculated average of vertical motion (mm/yr) in the Ust’-Kam-chatsky testing area for three time intervals: 1971–1972 and 1983–1985 (before and after the 1971 and 1984 earthquakes; see Fig. 1C and text), and the net rate, 1971–1986.
1GSA Data Repository item 2013301, Extended
discussion, methods, Tables DR1 and DR2, Figures DR1–DR6, is available at http://www.geosociety.org /pubs/ft2013.htm or by request to editing@geosociety .org.
2004; Bourgeois et al., 2006; Pinegina et al., 2012), we interpret that since 5000–6000 yr ago, regional sea level has been stable within about ±1 m. For this reason, we interpret relative sea-level fl uctuations along Kamchatsky Peninsula during the last ~5000 yr to have been caused primarily by coastal vertical tectonic deforma-tion. This tectonic interpretation is supported by the signifi cant (up to a few tens of meters) differences in elevation of Holocene marine ter-races of the same age (based on tephra chronol-ogy) along the eastern coast of Kamchatka (this paper; Pedoja et al., 2006; Martin et al., 2004).
Field Methods
During field seasons (primarily 2003 and 2004, with several profiles measured or re measured in subsequent years), we mea-sured 34 topographic profi les across wave-built marine terraces, composed typically of sand, but locally including granules and pebbles along the outer Kamchatsky Peninsula coast from Soldat-skaya Bay to Kamchatsky Cape (Fig. 2). We also studied Holocene profi les from Stolbovaya Bay (Bourgeois et al., 2006), near Ust’ Kamchatsk, and within the interior of Nerpich’e lake (Pine-gina et al., 2012), all of which show subsidence to low rates of uplift during the later Holocene, with profi les preserving wave-built sequences of up to 6000 yr total. Most other parts of the Kamchatsky Peninsula coast are rocky cliffs, with lack of Holocene wave-built terraces, in some places even lacking present active beach deposits.
Along the 34 profi les, we dug multiple exca-vations (e.g., Fig. 4; Fig. DR2 [see footnote 1]), ~200 in all, typically 1 m to several meters deep. These excavations exposed soil-tephra sequences and beach (clean, well-sorted, gray sand) deposits, grading upward (and land-ward) from clean sand to a soil cap of weath-ered tephra and organic material. Coastal soils of these wave-built terraces can be assigned to Cryopsamments . The older the terrace, the thicker and more complex are the soil sequences, depending also on the rate of tephra deposition and the introduction of inorganic components (e.g., alluvium, colluvium, eolian sand). Most sequences are very sandy. In the fi eld, we used such fi eld terminology as “sandy soil” and “soily sand,” where “sandy soil” had observable organic content, and “soily sand” showed only weathering (discoloration, silt component).
Our primary means for age control was tephra stratigraphy, not soil development. On Kamchatsky Peninsula, soil-pyroclastic cover, formed during the past 5000–6000 yr, contains up to 20 tephra layers (Bourgeois et al., 2006; Pinegina et al., 2012). In each excavation, we
described and in some cases sampled these tephras, noting their position relative to soil development (Fig. 5A).
Age Control
We determined the age of raised terrace formation, i.e., the age when the surface was removed from the active shoreline, using the oldest marker tephra at the base of the soil sequence, directly above beach deposits. Dur-ing an eruption, tephra falls can form distinc-tive marker horizons, which for Kamchatka have been mapped extensively over large areas (e.g., Braitseva et al., 1997). Marker tephras are chosen for having distinctive combinations of properties, from fi eld characteristics such as color, grain size, thickness, and presence of pumice, to laboratory analyses of mineralogy and geochemistry. In this study, we used in particular the following marker tephras, which have been mapped in the study area and were distinctive in the fi eld (Table 1; Pevzner et al., 1997; Bourgeois et al., 2006; Ponomareva et al., 2007; Pinegina et al., 2012): SH1964 (Shiveluch
volcano, A.D. 1964 historical eruption), SH1450
(Shiveluch volcano, 1450 14C yr B.P. or ca. A.D.
600 eruption), and KS1 (Ksudach volcano, 1800 14C yr B.P. or ca. A.D. 250 eruption).
The accuracy of tephra dating depends on the accuracy of 14C dating of organic layers that
underlie and overlie the tephra in key reference sections (e.g., Pevzner et al., 1997; Bourgeois et al., 2006). Since tephra layers have been dated using 14C, the ages have 14C-dating errors. These
errors have been estimated based on error analy-sis of multiple dates for SH1450 (1400 ± 50 yr)
and KS1 (1750 ± 90 yr; references in Table 1).
Herein we also provide a new, high-resolution date for an in-place woody shrub buried by KS1
(in Soldatskaya Bay; Table 1; Table DR1 [see footnote 1]). Although there is error in ages assigned, because the tephras are time horizons, correlations between excavations and profi les are not affected by this error.
To distinguish air-fall (thus marker) tephra in excavations from redeposited tephra, we used the following criteria: each bed of air-fall tephra has a typical thickness, color, grain size, and internal stratigraphy, which correlate with its
0 50 100 150 200 250
terrace at 22 m older than KS1
terrace at 19.5 m with KS1 (AD 250)
first dense vegetation at 2.8 m net uplift between AD 250 & AD 600 net uplift between AD 600 & AD 2000 prograding terrace at ~ 6.5 m
(former beach ridges)
high tide = 0
Distance (m)
Elevation above high tide (m)
Sh1964preserved at 4.5 m
erosion & deposition younger than AD 1964 terrace at 10 m with SH1450 (AD 600)
SH1450 KS1 S S S S S - erosional scarp - uplift event - tephra Sh1964 - tephra Sh1450 - tephra KS1 15 10 5 - excavations 0
Figure 4. An example of a profi le (profi le 23) with very rapid net uplift. The profi le is made of steep steps; steeper faces indicate cliff retreat and erosion. Tephras KS1, Sh1450, and Sh1964 are interpreted
to be truncated by erosion, rather than pinching out (see Figs. 5 and 6). Additional profi les are shown in Figure DR1 (see text footnote 1).
regionally mapped occurrence (e.g., Table 1). In addition, we looked for evidence of reworking, including admixture, redepositional textures, and rounding of soft pumiceous grains. In our reconstructions, we used two very well-traced prehistoric tephra layers. According to isopach maps, 1–5 cm of these tephras coated the Kam-chatsky Peninsula (Bourgeois et al., 2006; Pine-gina et al., 2012).
Measuring Relative Sea-Level Change (Uplift or Subsidence) on Accumulative Terraces
The standard method developed to measure relative sea-level change using marine ter-races has been to identify the shoreline angle of uplifted or submerged wave-cut marine ter-races, where the infl ection point at the back of the terrace represents the base of a paleo–sea cliff (Lajoie, 1986; Burbank and Anderson, 2001; Keller and Pinter, 2002). In other regions of the world, specifi c coral and other organisms are used as markers relative to a sea-level datum (e.g., Sugihara et al., 2003). Along the Kam-chatsky Peninsula, rather than erosion or coral growth, the Holocene shoreline has a history of net sand and soil accumulation, or aggrada-tion. On these wave-built terraces composed of different ages of beach ridges, marker tephras are preserved, providing both good age control and reference elevation benchmarks relative to (paleo) sea level.
As previously noted, we assumed based on local and global sea-level studies that regional sea level was stable during the time span cov-ered by of our study—the past 2000 yr. We also assumed that for each single profi le location, the wave energy did not change signifi cantly dur-ing the past 2000 yr. This is a weaker assump-tion, but it is supported by observations to the south of Ust’ Kamchatsk (Fig. 2; Pinegina et al., 2012). At this site, sediment supply is large, and a wide (4–6 km) marine terrace composed of tens of beach ridges has accumulated during the past ~3000 yr, showing little difference in height or grain size for beach ridges formed during the past 2000 yr.
The method we used for reconstruction of paleoshorelines avoids error associated with variation of wave energy along the coast, and hence of beach-ridge height. Storm-beach height can also vary with sediment grain size, but the sand sizes in the terraces we studied remain consistently within the medium to coarse sand range. The energy of waves can vary over kilome-ters or less of distance due to differences in coastal exposure, nearshore bathymetry, etc. For example, on the outer Kamchatsky Peninsula coast, the elevation of the inland boundary of the
age(b) – age(a)
Hb(p) – Ha(p)
-Hb p)( = elevation where tephra b starts to pinch out
tephra a
tephra b
B
---dv
-Ha(p) = elev. where tephra starts to pinch outa
tephrab
truncated by erosion buried erosional scarp
recent erosional scarp
tephraatruncated by erosion tephraa tephrab age(b) – age(a) Hb(t) – Ha(t) Hb(t) = elevation where tephrabtruncates -Ha(t) = elevation where
tephraatruncates
-~
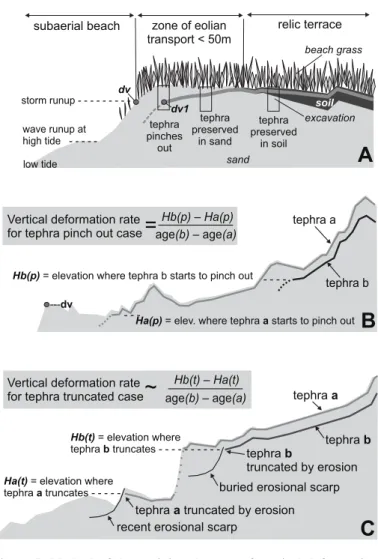
tephra preserved in sand relic terrace tephra pinches out low tide wave runup at tide -high zone of eolian transport < 50m subaerial beach tephra preserved in soil storm runup -dv1 dv soil sandA
beach grass excavationVertical deformation rate for tephra truncated case Vertical deformation rate for tephra pinch out case
C
=
Figure 5. Method of determining the rate of vertical deformation between times of deposition of dated tephras on an accumulative coastal plain, using real profi les but with simplifi ed stratigraphy. (A) Schematic geological section across a marine wave-built terrace (in the fi rst months to several years after a tephra fall); dv—mod-ern point of the dense vegetation; dv1—dense vegetation point by the time of tephra fall. (B) Simplifi ed internal stratigraphy show-ing how comparable paleolocations (infl ection where a tephra layer starts to pinch out) on the profi le are measured and thus how a rate of vertical deformation is calculated. Note that from the elevation surveyed on the surface above Ha or Hb, we subtract the thickness of soil above the marker tephra being used, so the elevation is truly the elevation of the tephra when it was deposited on the surface. (C) Methods for calculating the rate of vertical deformation if there is a buried scarp. Example shows a real profi le (profi le 11, see Fig. 2). This profi le exhibits two exposed erosional scarps—the labeled re-cent one (already partially buried), and the prominent cliff-like step (but there is no age control on this step). The profi le also exhibits one buried erosional scarp, detected either by ground-penetrating radar or fortuitously by excavation. The “buried erosional scarp” is younger than tephra b and older than tephra a. The “recent ero-sional scarp” is younger than tephra a and older than sediments deposited on top of it. Buried scarps typically indicate a period or episode of subsidence (see text); however, this profi le exhibits net uplift. The rate of net uplift is less accurately determined in this case than in part B, because the infl ection point where the tephra starts to pinch out has been eroded away.
active beach ranged from ~1.5 m to ~4.5 m (in most areas 2–3.5 m) above wave runup at high tide (marked by the highest recent fl otsam). This factor means that we cannot correlate terraces along the coast by elevation alone, an issue also discussed and illustrated by Wilson et al. (2006) and McSaveney et al. (2006) for coastal areas of New Zealand.
Using these assumptions, and accounting for spatial wave-generated differences, we were able to compare elevations of terraces of differ-ent ages along the same profi le and of the same age among profi les. In order to describe in detail our fi eld-based approach, we would like fi rst to discuss briefl y a few important terms. Based on studies we have conducted on the chatsky Peninsula and other coasts of Kam-chatka in 1995–2012, it is possible to defi ne three zones on marine wave-built terraces (Fig. 5A). Each of these zones is characterized by a particular regime of sedimentation (from shore toward land):
1. The subaerial beach is regularly affected by waves, resulting in intensive sediment ero-sion and redeposition. The beach is usually sig-nifi cantly steeper than the terrace above it. The modern upper boundary of the subaerial beach is marked by vegetation. We observe that sparse pioneer plants (such as Honckenya oblongifolia, Mertensia maritima) grow over several years on the upper part of the subaerial beach, which is inundated only during the strongest storms.
2. The zone of eolian transport is landward from the active beach, which can also include storm washover or splash-over deposits. The thickness of the layer affected by wind is gen-erally ≤1 m and becomes thinner landward. Based on analysis of all profi les from Kam-chatsky Peninsula, the zone of eolian transport along the peninsula is <50 m wide. It is typically dominated by beach rye grass (Leymus mollis), with increasingly dense and diverse vegeta-tion landward, including also Lathyrus japoni-cus, Senecio pseudoarnica, Lagedium sibiri-cum, Poa macrocalyx, and Trientalis europaea subsp. arctica.
3. The relic terrace is landward of the zone of eolian transport and continues to the Holocene shoreline angle (the intersection of the Holo-cene marine terrace with a relic sea cliff). Eolian processes here are weak enough that soil can form. Beach rye cedes to other vegetation noted already and additional grasses, fl owers, and low shrubs. Sedimentation rates are low compared to the subaerial beach and zone of eolian transport.
Tephra delineates the part of a (relic) terrace that already existed at the time of tephra fall. Preservation of tephra on a marine wave-built terrace depends on the sedimentation regime. On the relic terrace and in the zone of eolian transport, tephras can be well preserved. On the relic terrace, they are covered afterward by newly formed soil (or sandy soil, or soily sand, if close to the zone of eolian transport). In the zone of eolian transport, they are covered by sand, up to ~1 m thick (Fig. 5A). On upper subaerial beach, tephras can be preserved, but usually only as rewashed fragments or in lenses. In the lower subaerial beach, as well as under-water, tephras are redistributed by waves, and distinct layers are not preserved.
By studying buried tephras on marine wave-built terraces, it is possible to estimate the posi-tion of all three zones at the time of tephra fall. Tracing a buried tephra horizon from the land seaward, fi rst we see it lying above a thin (young) soil, indicating the relic terrace formed by the time of tephra fall. Seaward, the tephra gradually deepens in soil and sand relative to the modern surface. The thickness of clean sand above the tephra increases up to ~1 m in the zone of eolian transport in the years fol-lowing the tephra fall. Seaward of the zone of eolian transport, the tephra becomes deeper in clean sand at a very steep dip angle, close to the angle of the modern beach. This zone indicates the upper part of the subaerial beach at the time of tephra fall. The infl ection point in the trend of tephra depth corresponds to the upper boundary of the subaerial beach at the time of tephra fall.
In order to determine the change in land level relative to the sea, in each excavation we tied
our observation to a reference relative to modern wave action and sea level, for which we used the point of the fi rst growth of dense vegetation (dv, Fig. 5). We measured and marked this point on all our modern profi les and associated this point in excavations with good preservation of tephra layers.
Seaward from the land, tephra layers in excavations pinch out in two ways: gradually (deposited during the terrace progradation; Figs. 5A and 5B) or abruptly (truncated by erosion; Fig. 5C). In the gradual pinch-out case, a tephra begins to dip seaward toward the shoreline, to appear deeper and in clean-sand deposits, and then to disappear. We identifi ed the point on the profi le where a tephra started to incline more steeply seaward and used this to indicate the seaward limit of dense vegetation (dv1) at the time the tephra was deposited (Ha[p] and Hb[p] on Fig. 5B). The deeper tephra in clean sand we interpreted to have been deposited on the upper, sparsely vegetated beach, as in Fig-ure 5A. Consequently, the elevation above sea level of Ha(p) and Hb(p) at the moment of ash fall was equivalent to the modern elevation dv (Fig. 5B). The difference between Ha(p) and Hb(p) is the amount of uplift between the two times of tephra deposition, and the rate of uplift is that difference divided by the difference in tephra ages.
In the second case (Fig. 5C), a tephra is trun-cated abruptly by erosion during sea-level rise and landward scarp retreat. The uncon formity created by scarp erosion means we do not know the position of the paleoshoreline when the tephra fell. We can only determine that the beach ridge closest to the sea where we still fi nd the tephra is older than this tephra, so calcula-tion of the amount of uplift is more approximate. In areas where tephras are cut out abruptly, quite often there is a signifi cant age difference between two nearest beach ridges. This uncon-formity is either refl ected in terrace morphology or in a buried erosional scarp (Fig. 5C). Where it was obvious that parts of the terrace and overly-ing tephra(s) were reworked, ages and thus rates TABLE 1. HOLOCENE MARKER ASH LAYERS USED IN THIS STUDY, ON THE KAMCHATSKY PENINSULA, NE COAST OF KAMCHATKA, RUSSIA
Code volcanoSource Age used in this study (14C yr B.P.)Age Assigned calendar age Characteristic features Reference* Field description
Thickness (cm) SH1964 Shiveluch A.D. 1964 (historical) Historical A.D. 1964 (historical) Medium K2O content, high Cr and
Sr content, presence of Hb, Ol 1* White “salt and pepper” fi ne-medium sand 1–3
SH1450 Shiveluch A.D. 600 1450* A.D. 540–640* Medium K2O content, high Cr and
Sr content, presence of Hb 1* Yellow “salt-and-pepper” fi ne to medium sand 1–3
KS1 Ksudach A.D. 250 1806 ± 16* A.D. 160–340* Low K2O content, absence of Hb 2* Pale yellow very fi ne to
fi ne sand, some silt 3–7
1850 ± 40† A.D. 71–249† This study†
Note: Tephra layers are listed in chronological order. In column 6, Hb—hornblende, Ol—olivine; other abbreviations are standard chemical symbols.
*Average of multiple dates; see (1) Pevzner et al. (1998); (2) Braitseva et al. (1997); also see Bourgeois et al. (2006). †Single age, calibrated 2σ calendar age using CALIB 611 (Reimer et al., 2009); see Table DR1 (see text footnote 1).
of vertical deformation are approximate. Table 2 summarizes our calculations, with error, which is discussed in more detail in the Data Reposi-tory (DR2 [see footnote 1]).
The level of detail in reconstructing marine terrace history depends not only on tephra (and thus paleosurface) preservation, but also on the frequency of tephra falls, and the preci-sion of their age determination. In this study, although up to fi ve additional tephras for the past ~2000 yr exist, we used only the two most certain marker tephra and the modern surface to determine rates of Holocene vertical defor-mation for three time intervals (Table 2; DR2 [see footnote 1]): A.D. 250–2000, A.D. 600– 2000, and A.D. 250–600, using rounded calen dar ages for modern (A.D. 2000), SH1450
(A.D. 600), and KS1 (A.D. 250) ages. In areas
where part of a terrace (we presume) formed during a chosen time interval but was com-pletely eroded, as indicated by missing tephra, the rate of deformation was not determined for that interval. In our calculations, we did not use Shiveluch tephra from the A.D. 1964 eruption, but we traced this horizon in excavations near the modern shoreline, using its patterns of bed-ding and pinching out to help us understand the characteristics of the zone of eolian transport (width, depth) and distribution of older tephra and to help identify the aggradation and erosion processes that have dominated beach profi les over the last few decades.
RESULTS: HOLOCENE VERTICAL DEFORMATION ON THE
KAMCHATSKY PENINSULA COAST FROM RECONSTRUCTED PALEOSHORELINES
Tectonic movement, as expressed by rates of vertical uplift or subsidence, has varied sharply along the coast of Kamchatsky Peninsula dur-ing the past ~2000 yr (Table 2; Fig. 6). Averaged over the longest time interval (A.D. 250–2000), the fastest uplift has been on the western side of Kamchatsky Cape (up to 6.8 mm/yr) and on Cape Africa (up to 6.6 mm/yr). On other parts of the coast, the average uplift rates have been lower (ranging from 0.5 to 4.6 mm/yr), and some parts of the coast have experienced net subsidence or stability.
Based on our data and analysis, we divide the south and central eastern coast of the peninsula into four parts (Fig. 6), which differ by rate of vertical deformation, from south to north:
(1) Kamchatsky Cape has a high uplift rate, with the highest rate at profi le 23, the last pre-served Holocene terrace in our traverse toward the west;
(2) The coast between profi les 10 and 19, including the Pikezh and First Pereval’naya River valleys, shows prevalent net stability or subsidence for the past 2000 yr. All prograda-tional terraces along this part of the coast (which easily can be seen in the Google Earth images)
are very young and typically do not contain any tephras or just the tephra from A.D. 1964. We assume that net subsidence during earthquakes could explain the lack of the older terraces here, despite the large sediment supply and high recent accumulation rate.
(3) Cape Africa and neighboring coastal areas have a high uplift rate.
(4) The coast north of Second Pereval’naya River to Soldatskaya Bay has low to moderate rates of net uplift. For this zone, we have limited data from Holocene terraces, but well-preserved Pleistocene terraces (Pedoja et al., 2006, 2011) improve our conclusion about the general direc-tion of vertical movement.
Uplift on Capes Africa and Kamchatsky took place during all analyzed time intervals. For other parts of the coast, the direction of verti-cal deformation was time variant, that is, there are profi les where no terrace contains a particu-lar marker tephra in the basal position; in these cases, we interpret that record to have been eroded during a period of subsidence (Fig. 6). Preserved (uplifted) erosional scarps on profi les (e.g., Fig. 4) are also suggestive of episodes of subsidence, even if tephras remain preserved, because sharp and high scarps are not present on prograding coastlines (e.g., lower parts of profi les 8 and 22 in Fig. 2).
Periods of coastal erosion could be associ-ated with two main factors—relative sea-level rise and changes in sediment supply. We think
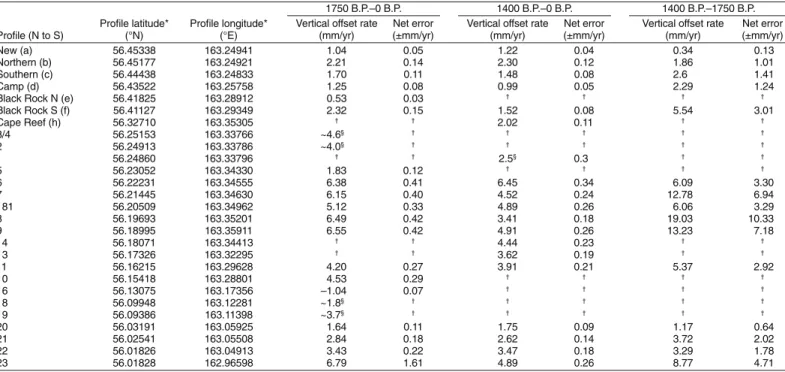
TABLE 2. VERTICAL DEFORMATION RATES CALCULATED FROM HOLOCENE COASTAL TERRACES
Profi le (N to S) Profi le latitude*(°N) Profi le longitude*(°E)
1750 B.P.–0 B.P. 1400 B.P.–0 B.P. 1400 B.P.–1750 B.P.
Vertical offset rate
(mm/yr) (±mm/yr)Net error Vertical offset rate(mm/yr) (±mm/yr)Net error Vertical offset rate(mm/yr) Net error(±mm/yr)
New (a) 56.45338 163.24941 1.04 0.05 1.22 0.04 0.34 0.13
Northern (b) 56.45177 163.24921 2.21 0.14 2.30 0.12 1.86 1.01
Southern (c) 56.44438 163.24833 1.70 0.11 1.48 0.08 2.6 1.41
Camp (d) 56.43522 163.25758 1.25 0.08 0.99 0.05 2.29 1.24
Black Rock N (e) 56.41825 163.28912 0.53 0.03 † † † †
Black Rock S (f) 56.41127 163.29349 2.32 0.15 1.52 0.08 5.54 3.01 Cape Reef (h) 56.32710 163.35305 † † 2.02 0.11 † † 3/4 56.25153 163.33766 ~4.6§ † † † † † 0 . 4 ~ 6 8 7 3 3 . 3 6 1 3 1 9 4 2 . 6 5 2 § † † † † † 6 9 7 3 3 . 3 6 1 0 6 8 4 2 . 6 5 1 † † 2.5§ 0.3 † † 2 1 . 0 3 8 . 1 0 3 3 4 3 . 3 6 1 2 5 0 3 2 . 6 5 5 † † † † 0 3 . 3 9 0 . 6 4 3 . 0 5 4 . 6 1 4 . 0 8 3 . 6 5 5 5 4 3 . 3 6 1 1 3 2 2 2 . 6 5 6 4 9 . 6 8 7 . 2 1 4 2 . 0 2 5 . 4 0 4 . 0 5 1 . 6 0 3 6 4 3 . 3 6 1 5 4 4 1 2 . 6 5 7 181 56.20509 163.34962 5.12 0.33 4.89 0.26 6.06 3.29 3 3 . 0 1 3 0 . 9 1 8 1 . 0 1 4 . 3 2 4 . 0 9 4 . 6 1 0 2 5 3 . 3 6 1 3 9 6 9 1 . 6 5 8 8 1 . 7 3 2 . 3 1 6 2 . 0 1 9 . 4 2 4 . 0 5 5 . 6 1 1 9 5 3 . 3 6 1 5 9 9 8 1 . 6 5 9 14 56.18071 163.34413 † † 4.44 0.23 † † 13 56.17326 163.32295 † † 3.62 0.19 † † 2 9 . 2 7 3 . 5 1 2 . 0 1 9 . 3 7 2 . 0 0 2 . 4 8 2 6 9 2 . 3 6 1 5 1 2 6 1 . 6 5 1 1 10 56.15418 163.28801 4.53 0.29 † † † † 16 56.13075 163.17356 –1.04 0.07 † † † † 18 56.09948 163.12281 ~1.8§ † † † † † 19 56.09386 163.11398 ~3.7§ † † † † † 20 56.03191 163.05925 1.64 0.11 1.75 0.09 1.17 0.64 21 56.02541 163.05508 2.84 0.18 2.62 0.14 3.72 2.02 22 56.01826 163.04913 3.43 0.22 3.47 0.18 3.29 1.78 23 56.01828 162.96598 6.79 1.61 4.89 0.26 8.77 4.71
*In most cases, longitude and latitude are at the shoreline; in others, excavation closest to shoreline. †Record is eroded; cannot calculate offset or error.
that on the Kamchatsky Peninsula, on a millen-nial time scale over the late Holocene, terrace erosion is mostly indicative of (tectonic) coastal subsidence, which in effect is a local sea-level rise, leading to beach-scarp development and landward retreat (as in Meyers et al., 1996; Saltonstall and Carver, 2002). Our reasoning for this conclusion is based on an assumption that there were no big changes in sediment sup-ply and wave energy during the past ~2000 yr. This coastline does not have an accumulative estuarine (coastal marsh) setting such as has been used on a number of coastlines to exam-ine periods and episodes of sub sidence (e.g., Atwater and Hemphill-Haley, 1997; Shennan et al., 1998). It possible to calculate a rate of subsidence only for one of the profi les (pro-fi le 16), where the subsided part of the terrace including tephra is partially preserved in a coastal alluvial plain. However, almost all the
uplifted profi les have preserved steep scarps and sharply truncated tephra in excavations, suggesting episodes of erosion (we think due to subsidence), and then uplift to preserve the scarp in relief (e.g., Fig. 4; Figs. DR1–DR2 [see footnote 1]).
For profi les 15, 17n, 17s, 18n, 18s, and 19s (position of profi les shown on Fig. 6), it was not possible to calculate rates of vertical defor-mation for any of the chosen time intervals. On these profi les, young Holocene terraces (younger than ca. A.D. 600) directly adjoin Pleistocene sequences, with no older Holocene terrace presence.
Data on profi les 1, 2, 3/4, 18, and 19 may yield a slightly higher rate of vertical deforma-tion than in reality because they were measured not from the dv point but from the river level near the river mouth. The river level near the river mouth is approximately the same as sea
level or slightly higher and could vary in time due to river mouth migration.
The highest uplift rates and the highest gradi-ents of rate change along the coast are recorded during the shortest time interval (~350 yr, assigned age bracket A.D. 250–600; Fig. 6). For example, during this short time interval, the coast along Cape Africa (profi les 7, 181, 8, 9) experi-enced an uplift rate of up to 19 mm/yr. This fact supports our interpretation that major strain-releasing seismicity best explains the history of vertical coastal deformation. A few coastal localities (e.g., profi les 18, 19) that experienced net slow uplift during the past 2000 yr appar-ently experienced net subsidence after the time of SH1450 (A.D. 600) ash fall, because this ash is
not preserved in terraces closer to the shoreline than those also containing KS1 (A.D. 250).
Despite the relatively fast late Holocene (last 2 ka) uplift rates around Capes Africa and
Kam-Time interval (cal. AD)
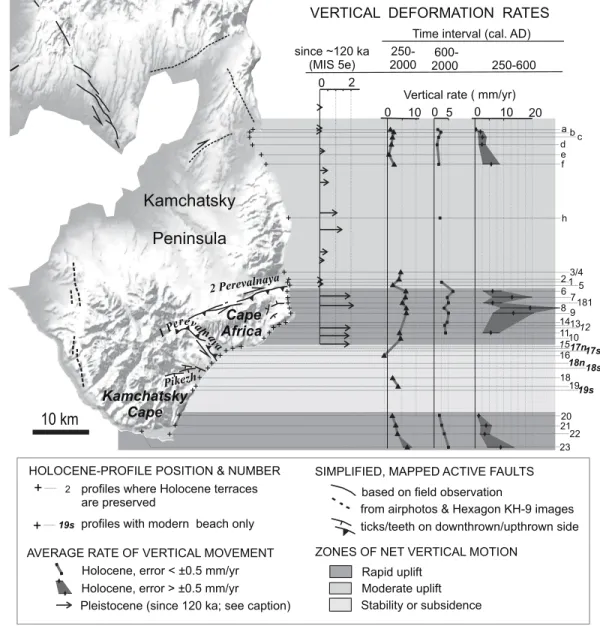
VERTICAL DEFORMATION RATES
MAPPED ACTIVE FAULTS
from airphotos & Hexagon KH-9 images ticks/teeth on downthrown/upthrown side based on field observation
Holocene, error < ±0.5 mm/yr AVERAGE RATE OF VERTICAL MOVEMENT
Rapid uplift Moderate uplift Stability or subsidence
2 profiles where Holocene terraces are preserved
HOLOCENE-PROFILE POSITION & NUMBER SIMPLIFIED, MAPPED ACTIVE FAULTS
ZONES OF NET VERTICAL MOTION
+ +
Holocene, error > ±0.5 mm/yr
Pleistocene (since 120 ka; see caption)
Vertical rate ( mm/yr)
19s profiles with modern beach only
10 km
a bc d e f h 20 21 1919s 18 18n 16 23 22 10 149 8 7 6 5 3/4 2 1 18s 181 17n17s 12 11 13 15Kamchatsky
Peninsula
Kamchatsky Cape Cape Africa 2 Perevalnaya + ++ + ++ ++ ++ + + + ++ +++ + + + + ++ ++ + + + + + + ++ 1 Perevalnaya Pikezh 10 0 250-2000 5 0 600-2000 10 0 20 250-600 since ~12 ka0 (MIS 5e) 0 2Figure 6. Summary of calcu-lated and inferred rates of verti-cal deformation along the open coast of the Kamchatsky Penin-sula for the late Holocene (past ~2000 yr; this paper) and for the latest Pleistocene (past 120,000 yr, since marine oxygen isotope stage [MIS] 5e; Pedoja et al., 2006). The methods for calculat-ing Holocene rates are discussed in detail in this paper (see also Fig. 5; Table 2; DR2 [see text footnote 1]). Mapped active faults are based on Kozhurin (2007, 2012) and Kozhurin and Pinegina (2011).
chatsky, there is almost no preservation of relic (soil-blanketed) marine terraces formed between ca. 2 ka and ca. 5 ka (ca. 5 ka taken to be the end of the mid-Holocene highstand; Woodroffe and Horton, 2005). Given that regional postglacial sea levels stabilized in the mid-Holocene, and given the more recent net uplift rates, we would expect these older, uplifted Holocene terraces to be preserved, as they are on other Kamchatka coastlines, even those that do not experience much uplift (Pinegina et al., 2002, 2003, 2012; Bourgeois et al., 2006). Thus, on southeast Kamchatsky Peninsula, we can interpret the absence of terraces between ca. 2 ka and ca. 5 ka to represent (1) a period of net subsidence, or (2) a period of stability on a background of low sediment supply and coastal erosion. We favor a neotectonic explanation such as coseismic (or interseismic) subsidence because the erosional period appears to be more or less synchronous from Kamchatsky Cape to south of Soldatskaya Bay, but it does not include other coastal areas of net stability or subsidence (Soldatskaya, Stolbovaya, Ust’Kamchatsk regions, Fig. 2). In areas of most rapid uplift, such as Cape Africa (and perhaps buried under alluvial fans at Kam-chatsky Cape), fragments of these terraces are preserved (Fig. DR1 [see footnote 1]).
DISCUSSION
Sources and Types of Deformation
Along the coastal zone encompassing Kam-chatsky Peninsula, thrust, oblique strike-slip, and normal crustal faults occur onshore and offshore; thus, we expect complex patterns of coastal deformation at individual sites (repre-sented by profi les and groups of profi les). Below the surface, the Pacifi c plate is subducting south of and terminating near the Kamchatsky Penin-sula (Figs. 1 and 7). The Komandorsky Island block and the Bering plate are impinging on the central and northern Kamchatsky Peninsula. At its western boundary, the Kamchatsky Penin-sula block collides with the Okhotsk plate (or North America plate); this recent interaction is supported by the existence of active thrust and strike-slip faults along the eastern boundary of the Kumroch Range (Kozhurin, 2009; Kozhurin and Pinegina, 2011; Fig. 7A).
Differentiated vertical deformation of the Kamchatsky Peninsula coast can be interpreted as a net result of coseismic and interseismic movement. Support for this interpretation comes from the pattern of the historical leveling record (Fig. 3) spanning two different kinds of earth-quakes (1971 and 1984) and an interseismic period, which mimics the longer-term records (Fig. 6). At least a part of individual abrupt
vertical deformation can be caused by elastic coseismic coastal deformation, such as occurred in 1971 and 1984, and as has been shown for many coastlines (Barrientos and Ward, 1990; Carver et al., 1994; Merritts, 1996; Briggs et al., 2008). However, brittle faulting is also respon-sible for some of the change, as is apparent in the sharp changes in uplift rates across onshore active crustal faults, such as along the Second Pereval’naya River. In other words, some of the deformation comes from offshore faults that may not directly underlie the peninsula, and some of the deformation comes from faults that are on the peninsula, in the area surveyed. The length (only kilometers to tens of kilometers) of onshore faults on Kamchatsky Peninsula may preclude very large events. However, we cannot rule out the possibility of deformation associated with a large rupture of the northern
end of the Kamchatka subduction zone or along the Pacifi c-Aleutian boundary (Fig. DR4 [see footnote 1]).
Rates and Directions of Deformation versus Length of Observed Time
On the Kamchatsky Peninsula, Holocene vertical deformation shows similar patterns to historical and Quaternary records, with the shortest-interval Holocene rate (A.D. 250–600) comparable to the historical leveling data and up to ten times faster than the latest Pleistocene– derived rate (Fig. 6). We think that the short-term Holocene record tends to refl ect a few individual events, with little time averaging. The Kamchatsky Peninsula historical data include two earthquakes of different origins, both pro-ducing the same sense of uplift and subsidence
Cape Africa Cape Kamchatsky 10 km 163.0° 164.0° 162.0° 56.0° 55.0°
Zones of Holocene vertical coastal deformation:
rapid uplift
subsidence or net stasis slow to moderate uplift
C
B
A
Pacific slab Okhotsk plate – Kamchatsky Peninsula block Bering plate lower Paleocene undifferentiated Paleogene gabbro Cretaceous hyperbasalt Quaternary unconsolidated stratified rocks Plio-Pleistocene ~80 mm/yr NW PAC OKH ~40–50 mm/yr NW KIB BER Cape Africa KamchatskyCape Slab Shiveluch ShiveluchOKH
OKH
PAC
PAC
KIB
KIB
BER
BER
KPB
KPB
50 kmKPB
I
II
II
II
II
Kumroch Range Kumroch RangeFigure 7. Proposed geodynamic model for the Kamchatsky Peninsula region. (A) Proposed boundary of Kamchatsky Peninsula block (KPB): Western onshore boundary is after Kozhurin (2009) and Kozhurin and Pinegina (2011); other boundaries are shown schemati-cally; southern boundary is after Bourgeois et al. (2006) and Pedoja et al. (2006); north-ern and eastnorth-ern boundaries are shown along the base of the continental slope (margin). I-II—position of the schematic cross section shown on B. (B) Schematic cross section of the Kamchatsky Peninsula region divided into plates. PAC—Pacifi c plate, BER—Bering plate, OKH—Okhotsk plate, KIB— Komandorsky [Commander] Island block. Okhotsk and Pacifi c plates extend to the northwest, Komandorsky Island and Bering plates are limited by the Kamchatsky Peninsula block. (C) Geological map of Kamchatsky Peninsula (modi-fi ed from Freitag et al., 2001), showing its main structural features and main faults, both active and old and zones of Holocene vertical coastal deformation. Note that the faults in C are based on different interpretations than in A.
where recorded (Figs. 1 and 3), and a net scale of deformation comparable to the short-term Holocene rate (A.D. 250–600). However, with the tectonic setting of the Kamchatsky Penin-sula, it is not appropriate to interpret this time span as a seismic cycle because there are sev-eral potential sources of deformation events, each involving a different sense and amount of deformation.
The intermediate-interval rates (for the past ~2000 yr) are 2–3 times faster than Pleistocene rates (Fig. 6; Fig. DR5 [see footnote 1]). Such differences in tectonic-movement rates averaged for time intervals that differ in duration, and the increase of these rates toward the present, have been established for many coasts of tectonically active regions of the world (Lajoie, 1986, his Fig. 6.11; Ota and Yamaguchi, 2004) and have been discussed in general by Gardner et al. (1987) (Fig. DR5 [see footnote 1]). However, there are areas where the rates do not appear to change as much (e.g., McSaveney et al., 2006).
Looking at the period with the highest rate of uplift (A.D. 250–600), we see evidence for mul-tiple earthquake events (terraces and scarps), as discussed in the following, although all events may not be recorded in the coastal stratigraphy. It is likely that large earthquakes, which gener-ated greater coastal deformation than the 1971 or 1984 earthquakes, played a role in this uplift. Concerning the probability of several events, we took into account that even if not all verti-cal coseismic deformation was preserved (due to interseismic recovery), the net uplift of Cape Africa during ~350 yr was 6.5 m and that of Kamchatsky Cape was up to ~3 m. We think it is more likely that such large amounts of uplift are the sums of two or three events rather than one. The time interval of 350 yr is long enough to include several large seismic events, and profi les typically show two to three geomorphic features (beach ridges at different elevations, sometimes separated by erosional scarps) between the last occurrence of KS1 and the last occurrence of
SH1450 (e.g., Fig. DR1 [see footnote 1]).
The intermediate-interval Holocene vertical rates (A.D. 250–2000, A.D. 600–2000) are still 2–3 times higher than latest Pleistocene rates (Fig. 6), but they begin to average out the noise of individual events. The fact that in a few cases (see Table 2; Fig. 6) the rates for A.D. 250–2000 show higher net uplift rates than those for A.D. 600–2000 indicates that episodes of subsidence occurred that caused the latter rate to be lower (or episodes of uplift that caused the former rate to be higher). A steep scarp just seaward of the last incidence of SH1450 supports the sub sidence
hypothesis (Fig. 4; Fig. DR2 [see footnote 1]). However, even with evidence for subsidence in this interval, uplift rates exceed Pleistocene rates
by a signifi cant amount. Another possibility is that the long-term net rates have increased from Pleistocene to Holocene, but we do not have a reason to support this assumption because the regional tectonic/geodynamic regime typi-cally does not change signifi cantly over on this time scale.
For most of the Kamchatsky Peninsula coast-line, we cannot determine a deformation rate for the past 4000–5000 yr because the record from ca. 2 to 5 ka (and older) has been eroded. The loss of this record may to indicate that regions of net uplift in the past 2000 yr may have been characterized by net subsidence in the prior few millennia in the southeast Kamchatsky Penin-sula. In contrast, other coastal sites on Kam-chatka preserve wave-built terraces older than ca. A.D. 250 (up to 3000 B.C. or mid-Holocene; Bourgeois et al., 2006; Pinegina et al., 2002, 2003, 2012).
One potential test of the signifi cance of time-interval differences in uplift rates is to compare them with the paleotsunami record for the late Holocene of the Kamchatsky Peninsula (Fig. DR6; see footnote 1]); this record is a proxy for large earthquakes such as in 1971 (Martin et al., 2008). Because most tsunamis are coseismic, our analysis would predict that there would also be more frequent tsunamis recorded in shorter time intervals, and that over the long term, there may be more- and less-active periods of tsunami recurrence. At nearby localities to the north (Stolbovaya and Ozernoi; Figs. DR6a and DR6b [see footnote 1]), this prediction appears to hold, with the notable exception of the KS1–SH1450
interval, where there is an inverse relationship of time interval between tephras with recurrence rate of tsunami deposits therein.
Along the 34 profi les measured for this study of Kamchatsky Peninsula, there appears to be a positive correlation of vertical deformation rate (Fig. 6) and tsunami recurrence rate (Figs. DR6c and DR6d [see footnote 1]). At Soldat skaya Bay, there are up to three tsunami deposits between tephra KS1 (A.D. 250) and SH1450 (A.D. 600),
which is a higher recurrence rate than above or below that interval (Fig. DR6c [see footnote 1]). Along the Kamchatsky coast (Fig. DR6d [see footnote 1]), there are up to fi ve tsunami deposits between these two tephras (2–4 being common). On the longer term, at Soldatskaya Bay, in the period ca. 1500 B.C. to A.D. 250, the recurrence of tsunami deposits is lower than for ca. A.D. 250 to A.D. 2000 or for 2000 B.C. and 1500 B.C. (base of record). This trend of fewer tsunami deposits in ca. 2000 B.C. to A.D. 250 than A.D. 250 to A.D. 2000 is repeated at other sites along the east coast of Kamchatka (e.g., Pinegina et al., 2003). Most of Kamchatsky Peninsula has a shorter record, but the fewer
tsunami deposits at other sites (Figs. DR6a and DR6b [see footnote 1]; Pinegina et al., 2003) correlate with the few to no preserved terraces on southeast Kamchatsky Peninsula during the period which we interpret to be a time of net stasi s or subsidence and erosion.
Correlation of Terrace Deformation Patterns with Active Faults of Kamchatsky Peninsula
We compared measured differences in coastal vertical deformation with active faults onshore of the Kamchatsky Peninsula that intersect the shoreline (Kozhurin 1985, 1990, 2004, 2007, 2012; Gaedicke et al., 2000; Freitag et al., 2001; Baranov et al., 2010; Kozhurin and Pinegina, 2011) to determine if some deformation events may have occurred on these faults. The con-cordance of active faults with distinct changes in Holocene uplift rates is distinct (Figs. 6 and 7; also see Fig. 1), and thus we conclude that some coseismic-deformation events in the past 2000 yr have occurred on these mapped faults. Of course, offshore faults could also be respon-sible for coseismic deformation, as illustrated, for example, on the North Island of New Zea-land (Berryman et al., 2011) and as modeled for the Taiwan coast (Huang et al., 2010). Some vertical deformation could be as folding due to blind faults.
Second Pereval’naya River Valley
An active fault has been mapped, trending west-southwest from the mouth of the Second Pereval’naya River upstream to the drainage of the First Pereval’naya River (Fig. 6). There is general agreement that this fault exhibits right-lateral slip with a thrust component (south side up; e.g., Gaedicke et al., 2000; Freitag et al., 2001), with Freitag et al. (2001) suggesting that this fault is the onshore extension of a branch of the Bering transform zone (Fig. 1). From cumu-lative slip measured in trenches across the fault and from offset of geomorphic features, rates of lateral offset for the Holocene range from ~4.5 mm/yr in the western part (Kozhurin, 2007) to ~15–20 mm/yr in the eastern part (Kozhurin, 2012). The same techniques have yielded rela-tive vertical components up to 7–8 mm/yr near the coast (Kozhurin and Pinegina, 2011).
This fault (or splay of a fault zone) at the coastline is situated between our profi les 5 and 6 (N to S). The uplift difference calculated from Holocene terraces on profi les 1 and 5 north of the fault and profi le 6 south of the fault is ~3–5 mm/yr (Fig. 6; Table 2), and we would agree that this offset is taken up along the fault zone. Based on the different elevation of the older (Pleistocene) marine terraces across this fault,