HAL Id: hal-00303083
https://hal.archives-ouvertes.fr/hal-00303083
Submitted on 4 Sep 2007HAL is a multi-disciplinary open access
archive for the deposit and dissemination of sci-entific research documents, whether they are pub-lished or not. The documents may come from teaching and research institutions in France or abroad, or from public or private research centers.
L’archive ouverte pluridisciplinaire HAL, est destinée au dépôt et à la diffusion de documents scientifiques de niveau recherche, publiés ou non, émanant des établissements d’enseignement et de recherche français ou étrangers, des laboratoires publics ou privés.
Do supersonic aircraft avoid contrails?
A. Stenke, V. Grewe, S. Pechtl
To cite this version:
A. Stenke, V. Grewe, S. Pechtl. Do supersonic aircraft avoid contrails?. Atmospheric Chemistry and Physics Discussions, European Geosciences Union, 2007, 7 (5), pp.12927-12958. �hal-00303083�
ACPD
7, 12927–12958, 2007 Do supersonic aircraft avoid contrails? A. Stenke et al. Title Page Abstract Introduction Conclusions References Tables Figures ◭ ◮ ◭ ◮ Back Close Full Screen / EscPrinter-friendly Version Interactive Discussion
EGU Atmos. Chem. Phys. Discuss., 7, 12927–12958, 2007
www.atmos-chem-phys-discuss.net/7/12927/2007/ © Author(s) 2007. This work is licensed
under a Creative Commons License.
Atmospheric Chemistry and Physics Discussions
Do supersonic aircraft avoid contrails?
A. Stenke1, V. Grewe1, and S. Pechtl1,*1
Deutsches Zentrum f ¨ur Luft- und Raumfahrt, Institut f ¨ur Physik der Atmosph ¨are, Oberpfaffenhofen, 82230 Wessling, Germany
*
now at: German Patent Office, 80297 M ¨unchen, Germany
Received: 22 August 2007 – Accepted: 3 September 2007 – Published: 4 September 2007 Correspondence to: A. Stenke ([email protected])
ACPD
7, 12927–12958, 2007 Do supersonic aircraft avoid contrails? A. Stenke et al. Title Page Abstract Introduction Conclusions References Tables Figures ◭ ◮ ◭ ◮ Back Close Full Screen / EscPrinter-friendly Version Interactive Discussion
EGU Abstract
The impact of a potential future fleet of supersonic aircraft on contrail coverage and contrail radiative forcing is investigated by means of simulations with the general cir-culation model ECHAM4.L39(DLR) including a contrail parameterization. The model simulations consider air traffic inventories of a subsonic fleet and of a combined fleet of
5
sub- and supersonic aircraft for the years 2025 and 2050, respectively. In case of the combined fleet, part of the subsonic fleet is replaced by supersonic aircraft. Supersonic aircraft fly at higher cruise levels (18 to 20 km) than subsonic aircraft (10 to 12 km). The different ambient meteorological conditions in terms of temperature and humidity affect the formation of contrails. At subsonic cruise levels, the combined air traffic scenario
10
reveals a reduction in contrail cover in northern extratropics, especially over the North Atlantic and Pacific. At supersonic flight levels, contrail formation is mainly restricted to tropical regions. The northern extratropical stratosphere is only in winter cold enough for the formation of contrails. Total contrail coverage is only marginally affected by the shift in flight altitude. The model simulations indicate a global annual mean contrail
15
cover of 0.372% for the subsonic and 0.366% for the combined fleet in 2050, respec-tively. The simulated contrail radiative forcing is most closely correlated to the total contrail cover, although contrails in the tropical lower stratosphere are found to be op-tically thinner than contrails in the extratropical upper troposphere. The global annual mean contrail radiative forcing in 2050 (2025) amounts to 24.7 mW m−2 (9.4 mW m−2)
20
for the subsonic fleet and 24.2 mW m−2(9.3 mW m−2) for the combined fleet. A reduced supersonic cruise speed (Mach 1.6 instead of Mach 2.0) leads to a downward shift in contrail cover, but does not affect global mean total contrail cover and contrail radiative forcing. Hence the partial substitution of subsonic air traffic leads to a shift of con-trail occurrence from mid to low latitudes, but the resulting change in concon-trail-induced
25
ACPD
7, 12927–12958, 2007 Do supersonic aircraft avoid contrails? A. Stenke et al. Title Page Abstract Introduction Conclusions References Tables Figures ◭ ◮ ◭ ◮ Back Close Full Screen / EscPrinter-friendly Version Interactive Discussion
EGU 1 Introduction
Contrails are line-shaped ice clouds which form in the wake of jet aircraft. Like natu-ral cirrus clouds, they have an influence on the earth’s climate system. According to the Special Report on “Aviation and the Global Atmosphere” by the Intergovernmental Panel on Climate Change (IPCC, 1999), the global radiative forcing (RF) of contrails
5
is estimated to be in the range of 0.02 W m−2 for 1992 which amounts to 40% of the total RF caused by aviation. Sausen et al. (2005) provided an updated estimate of aviation RF for the year 2000, mainly based on results of the EU project TRADEOFF. These results indicate a global RF of (line-shaped) contrails of 0.01 W m−2 which is approximately a factor of three to four smaller than the IPCC-based estimate, scaled to
10
2000 (0.034 W m−2). Several studies on the radiative impact of contrails also reported a somewhat lower RF than the IPCC report, e.g.Marquart et al. (2003) calculated a RF of 0.0035 and 0.0098 W m−2 for the years 1992 and 2015, respectively, andMyhre and Stordal (2001) calculated a RF of 0.009 W m−2for 1992. Furthermore,Stuber and Forster (2007) reported a RF value of 0.002 W m−2for 1992 which currently remarks a
15
lower limit for contrail RF. Nevertheless, line-shaped contrails still play an important role in aviation-induced climate impact. The mentioned estimates of contrail RF only con-sider line-shaped contrails. In addition to line-shaped contrails, aviation may change natural cirrus clouds in different ways, but the current knowledge on this subject is very limited (for a further discussion see e.g.Sausen et al.,2005).
20
The thermodynamic theory (Schmidt,1941;Appleman,1953;Schumann,1996) de-scribes contrail formation as a function of combustion parameters (emission index of water vapour, propulsion efficiency of jet engine, specific combustion heat) and am-bient meteorological parameters (temperature, humidity). Therefore, changes in air traffic density, technological developments such as more efficient engines, the global
25
climate change, but also a shift in main cruise altitude may lead to changes in contrail formation. Subsonic cruise levels are mainly located between 10 and 12 km altitude. In contrast, supersonic aircraft fly at stratospheric levels between 18 and 20 km altitude.
ACPD
7, 12927–12958, 2007 Do supersonic aircraft avoid contrails? A. Stenke et al. Title Page Abstract Introduction Conclusions References Tables Figures ◭ ◮ ◭ ◮ Back Close Full Screen / EscPrinter-friendly Version Interactive Discussion
EGU This means a significant change in ambient atmospheric conditions like temperature
and humidity which can be expected to have a significant influence on contrail forma-tion and persistence. TheIPCC (1999) provided an estimate for the aviation RF of a combined fleet of sub- and supersonic aircraft (scenario Fa1H) for the year 2050. In the Fa1H scenario 11% (in terms of emissions) of the subsonic fleet (scenario F1a)
5
are replaced by supersonic aircraft with a cruise speed of 2.4 Mach. However, inIPCC (1999) it was assumed that the occurrence of persistent contrails in the stratosphere is unlikely and that contrail RF form supersonic aircraft can be neglected. Consequently, the given global net contrail RF for the combined fleet (Fa1H, 0.089 W m−2) was 11% smaller than the respective value for the subsonic fleet (Fa1, 0.1 W m−2).
10
The EU-project SCENIC (“Scenario of aircraft emissions and impact studies on chemistry and climate”) investigated the impact of a potential future supersonic fleet on atmospheric chemistry and climate. Compared toIPCC(1999) the SCENIC emissions datasets (Marizy et al., 20071) consider more realistic scenarios in terms of super-sonic aircraft configuration, supersuper-sonic routes and market penetration, and supersuper-sonic
15
technology. A comprehensive discussion of the climate impact of potential future su-personic air traffic including the impact of NOx, CO2 and water vapour emissions is given in Grewe et al. (2007). In the present paper, we focus on the impact of future supersonic aircraft on contrail cover and the radiative impact of contrails. Our study is based on multi-year simulations with a comprehensive global general circulation model
20
including a thermodynamic parameterization of line-shaped contrails (Ponater et al., 2002). The effect of supersonic aircraft on contrails is evaluated by means of subsonic and combined (sub- and supersonic) aircraft inventories for the years 2025 and 2050, respectively. In view of quantifying the uncertainties and designing a “minimum impact scenario”, different supersonic aircraft configurations for 2050 are considered in this
25
study.
A description of the applied GCM configuration including the contrail
parameteriza-1
Marizy, C., Rogers, H., and Pyle, J.: The SCENIC emission database, Atmos. Chem. Phys. Discuss., in preparation, 2007.
ACPD
7, 12927–12958, 2007 Do supersonic aircraft avoid contrails? A. Stenke et al. Title Page Abstract Introduction Conclusions References Tables Figures ◭ ◮ ◭ ◮ Back Close Full Screen / EscPrinter-friendly Version Interactive Discussion
EGU tion and the different air traffic inventories is given in the following section. In Sect.3,
we present and discuss the impact of a supersonic fleet on contrail cover (Sect.3.1) and radiative forcing (Sect.3.2) in terms of differences between a subsonic and a mixed fleet. The impact of model deficiencies concerning the temperature and humidity distri-bution on the GCM results are discussed in Sect.4. Finally, conclusions are presented
5
in Sect.5.
2 Methodology
2.1 Model description
In this study we applied the spectral general circulation model ECHAM4.L39(DLR) (hereafter E39, Land et al., 1999, 2002), which is a derivate of the climate model
10
ECHAM4 (Roeckner et al., 1996) with an enhanced vertical resolution of 39 levels up to the model top centred at 10 hPa. This model version provides an exceptionally high vertical resolution of about 700 m in the tropopause region where air traffic mainly occurs. The spectral horizontal resolution is T30 with a corresponding Gaussian trans-form grid of approximately 3.75◦
×3.75◦and a time step of 30 min. Water vapour, cloud
15
water, and trace species are advected by the semi-Lagrangian transport scheme by Williamson and Rasch(1994). Since the advection scheme itself is not mass conserv-ing, a mass fixer has to be applied which is an integral part of the advection scheme in ECHAM4 (Rasch and Williamson, 1990). The model contains state-of-the-art pa-rameterizations of radiation, cumulus convection, cloud formation and precipitation,
20
horizontal diffusion, surface fluxes and vertical diffusion, orographic gravity wave drag, and land surface processes (seeRoeckner et al.,1996, and references therein).
The model was extended by a contrail parameterization developed byPonater et al. (2002). The parameterization scheme is based on the thermodynamic theory of con-trail formation which depends on ambient temperatures, humidity and natural
cloudi-25
ACPD
7, 12927–12958, 2007 Do supersonic aircraft avoid contrails? A. Stenke et al. Title Page Abstract Introduction Conclusions References Tables Figures ◭ ◮ ◭ ◮ Back Close Full Screen / EscPrinter-friendly Version Interactive Discussion
EGU of the aircraft inventory (see Sect. 2.2) allows to use flown distances as a metric of
air traffic. This parameter is more appropriate to scale contrail coverage than fuel con-sumption and modifies the global contrail coverage and RF by about 10% (Fichter et al., 2005). The simulated contrails are represented by a fractional grid box coverage, an individual ice water path, effective particle size and optical properties (Ponater et al.,
5
2002).
Results of contrail simulations with the ECHAM4 GCM (Marquart et al.,2003) have been compared with observations of contrail cover over different geographical regions based on NOAA/AVHRR satellite images (Mannstein et al.,1999;Meyer et al.,2007). For Europe, the observed contrail coverage as derived from AVHRR satellite data
10
(Mannstein et al., 1999) are approximately 50% lower than the GCM results. This discrepancy can be reasonably explained by the underestimation of the observed con-trail cover through neglecting widespread concon-trail features. A comparison of AVHRR-observations with the ECHAM4 model results for Asian regions over Thailand and Japan byMeyer et al.(2007) has shown that the derived patterns of the regional
con-15
trail cover agree well. Furthermore, the annual cycle of simulated contrails follows the observed seasonal variations, i.e. maximum contrail cover in spring and minimum values in autumn (Thailand) and winter (Japan), respectively. Quantitative differences between model results and observations may largely be explained by the increase in air traffic in these regions between 1992 (reference year for the air traffic inventory used
20
in the GCM simulation) and 1998 (satellite observations). Assuming a linear increase in contrail cover between the two time slice model simulations for 1992 and 2015, the expected value for 1998 from the model data closely matches the observed values.
The radiative forcing of contrails is calculated as difference of the short- and long-wave radiative fluxes with and without contrails. Consistent with previous contrail RF
25
studies based on the method ofPonater et al.(2002) we use the stratosphere-adjusted radiative forcing at the tropopause as a measure of climate impact from contrails which is calculated online during a model simulation (Stuber et al.,2001). Furthermore, we use an upgraded version of the longwave radiation scheme with modifications
accord-ACPD
7, 12927–12958, 2007 Do supersonic aircraft avoid contrails? A. Stenke et al. Title Page Abstract Introduction Conclusions References Tables Figures ◭ ◮ ◭ ◮ Back Close Full Screen / EscPrinter-friendly Version Interactive Discussion
EGU ing toR ¨ais ¨anen (1998) sinceMarquart and Mayer (2002) found that the longwave
ra-diative forcing of optically thin clouds is strongly underestimated (up to 70%) in the standard ECHAM4 radiation scheme. With the updated radiative transfer scheme, ECHAM4 still shows a systematic deviation to the sophisticated radiative transfer model LibRadtran of about 25% (Marquart and Mayer, 2002). This systematic deviation is
5
caused by the exclusion of longwave scattering. Therefore, we corrected the longwave RF values a posteriori by the 25% offset (Table3). These values represent our best estimate for the contrail RF from the model simulations.
The impact of supersonic aircraft on contrail formation is investigated on the basis of multiyear model simulations using the above described model configuration and
10
different air traffic inventories for subsonic and mixed fleets for the time slices 2025 and 2050, respectively. After a spin-up time the model has been integrated over 5 annual cycles in a quasi-equilibrium mode representing atmospheric conditions of the years 2025 and 2050 (time slice simulations). The future atmospheric concentrations of greenhouse gases are based on the SRES scenario A2p (IPCC,2001). The sea
15
surface temperatures are taken from a transient climate simulation with the coupled atmosphere-ocean-model ECHAM4/OPYC (Roeckner et al.,1999).
2.2 Air traffic inventories
The different SCENIC air traffic datasets are discussed in detail in Marizy et al. (2007)1. Here we give a short summary of the main characteristics of the subsonic
(scenar-20
ios S1 and S4) and mixed fleets (scenarios S2 and S5) for the years 2025 and 2050 (Table1). In the mixed fleet part of the commercial subsonic fleet is replaced by super-sonic aircraft. It is assumed that the first supersuper-sonic flight will be in 2015, i.e. on 2025 only few supersonic aircraft will be in operation. For the mixed fleet only one super-sonic aircraft type is designed. The reference configuration of the supersuper-sonic aircraft
25
is identical for 2025 and 2050: 250 passengers, Mach 2.0 with a range of 5500 nm. Beside the base-case mixed fleet scenario five perturbation scenarios (P2 to P6) with different supersonic configurations have been designed for the year 2050. In this study,
ACPD
7, 12927–12958, 2007 Do supersonic aircraft avoid contrails? A. Stenke et al. Title Page Abstract Introduction Conclusions References Tables Figures ◭ ◮ ◭ ◮ Back Close Full Screen / EscPrinter-friendly Version Interactive Discussion
EGU only perturbation scenario P4 (reduced cruise speed) has been considered. The P4
configuration is 250 passengers, Mach 1.6 with a range of 6000 nm. A set of super-sonic flight routes is defined for each configuration depending on the characteristics of the selected aircraft and its flight performances. Additionally, for each route, a mar-ket penetration is defined to determine the percentage of supersonic passengers and
5
the number of supersonic aircraft. It should be mentioned that the air traffic inven-tories have been created on the condition of constant revenue passenger kilometres (RPK) for each time slice, and not of constant fuel consumption (Table1). All invento-ries consider commercial air traffic (scheduled passenger and cargo, charter), general aviation (executive jet, turboprob, piston, helicopter) and a military fleet (fighter,
trans-10
port, bomber, trainer, others, helicopter). The emission datasets are based on market forecasts for the 2025 and 2050 world air traffic demand giving the total number of pas-sengers and the mass of freight transported on each commercial route. The air traffic inventories provide information about the emissions of NOx, CO, hydrocarbons (HC), soot (BC), particles, the total and commercial fuel consumption, and the commercial
15
distance flown. Concerning the propulsion efficiencies, which are needed as input for the contrail parameterization, we use values of 0.4 in 2015 and 0.5 in 2050 as pro-posed byGierens et al.(1999). The respectively value of 0.43 in 2025 was determined by linear interpolation.
Figure1 shows the horizontally integrated fuel consumption of the subsonic fleet in
20
2050 (a, scenario S4). The maximum fuel consumption occurs in Northern Hemisphere mid-latitudes between 10 and 12 km altitude. In order to illustrate the replacement of parts of the subsonic fleet by supersonic aircraft, the difference between the 2050 mixed and subsonic fleet (S5–S4) is displayed in Fig.1b. The main flight levels of the supersonic fleet are between 18 and 20 km, i.e. above the tropopause. Additionally,
25
the replacement of subsonic by supersonic aircraft leads to a slight increase in fuel consumption at subsonic flight levels (around 9 km and 12 km, respectively; Fig. 1b) which is caused by supersonics flying in subsonic mode over land in order to avoid sonic boom. The increase in fuel consumption below 8 km, i.e. during climb and dive,
ACPD
7, 12927–12958, 2007 Do supersonic aircraft avoid contrails? A. Stenke et al. Title Page Abstract Introduction Conclusions References Tables Figures ◭ ◮ ◭ ◮ Back Close Full Screen / EscPrinter-friendly Version Interactive Discussion
EGU is related to a higher MTOW (maximum take-off weight) of the supersonic aircraft
com-pared to the subsonic aircraft. The lower supersonic cruise speed of 1.6 Mach instead of 2.0 Mach in the perturbation scenario P4 results in a reduction of the main cruise altitude of approximately 2 km compared to the base-case mixed scenario S5 (Fig.1c). It should be mentioned that the emission datasets are based on detailed market
fore-5
casts and technical realizations. Furthermore, all scenarios are optimised in terms of economical viability, i.e. supersonic routes differ between S5 and P4.
Figure2 presents the geographical distribution of the commercial fuel consumption for the subsonic fleet in 2050 (S4) showing the main flight routes over the North At-lantic, USA, Europe, Asia and the North Pacific. The difference in fuel consumption
10
between the combined and the subsonic fleet (S5–S4) is displayed in the lower panel of Fig.2. The combined scenario S5 shows an enhanced fuel consumption over tropi-cal flight routes, but also over the North Atlantic and North Pacific. The increase in fuel consumption over the North Atlantic is accompanied by a reduction in fuel consump-tion to the north of this region. A similar pattern is found over the North Pacific. These
15
geographical differences are related to the fact that an individual set of flight routes was defined for each supersonic configuration.
3 Results
In order to estimate the impact of a future fleet of supersonic aircraft we analyse the differences in contrail cover (Sect. 3.1) and radiative forcing (Sect. 3.2) between the
20
subsonic and the combined fleet. The pattern of differences is similar for both years 2025 and 2050, but more pronounced for 2050 since more supersonic aircraft will be in-service. Unless mentioned otherwise, the shown results refer to the year 2050.
ACPD
7, 12927–12958, 2007 Do supersonic aircraft avoid contrails? A. Stenke et al. Title Page Abstract Introduction Conclusions References Tables Figures ◭ ◮ ◭ ◮ Back Close Full Screen / EscPrinter-friendly Version Interactive Discussion
EGU 3.1 Contrail cover
The contrail cover in the GCM is determined as fractional area covered with contrails within each model grid box. Unless mentioned otherwise, the shown contrail coverage considers both visible and subvisible contrails. Contrails are regarded as “subvisible” if their optical depth is smaller than 0.02 or if they are disguised by natural cirrus clouds
5
(Ponater et al.,2002). The total contrail cover is calculated by vertical summation using the principle of maximum-random overlap (e.g.Geleyn and Hollingsworth,1978).
The left panel of Fig. 3 presents the annual mean geographical distribution of the total contrail cover simulated for the subsonic scenario S4. The total contrail cover shows distinct maxima over the North Atlantic, the North Pacific, the eastern USA,
10
Europe and Japan/East Asia. This structure directly reflects the main flight routes (Fig.2). Typical mean values within the region of high air traffic density are in the range from 0.5% up to more than 5% (over the USA and Europe). The total contrail cover exhibits some seasonal variations (not shown) which are directly related to seasonal variations of atmospheric conditions, since the air traffic inventories do not consider
15
any seasonal cycle. Over the USA, Europe and in tropical regions the total contrail coverage is higher in winter than in summer. In contrast, the contrail cover over the North Atlantic and North Pacific shows a maximum in summer.
The mixed fleet scenario S5 reveals an increase in total contrail cover over tropical regions (right panel of Fig.3). The strongest increase is found over Southeast Asia with
20
values up to 0.8%. Except for central Europe and the USA the model results indicate a strong reduction in total contrail cover over the northern extratropics, most pronounced over the North Atlantic. The increase over USA and Europe is caused by supersonic aircraft flying in subsonic mode over land to avoid sonic boom. As the cruise altitude of a supersonic aircraft flying in subsonic mode is about 9–10 km which is below that
25
of a respective subsonic aircraft (Fig.1) slight differences in contrail occurrence result over land. In the tropics, the pattern of difference shown in Fig.3directly reflects the different flight patterns (Fig.2) of the subsonic and the combined fleet, respectively. In
ACPD
7, 12927–12958, 2007 Do supersonic aircraft avoid contrails? A. Stenke et al. Title Page Abstract Introduction Conclusions References Tables Figures ◭ ◮ ◭ ◮ Back Close Full Screen / EscPrinter-friendly Version Interactive Discussion
EGU contrast, the model results indicate a reduced total contrail cover over the North Atlantic
and North Pacific despite an enhanced fuel consumption, because the meteorological conditions at supersonic flight levels are less favourable for contrail formation than at subsonic flight levels. The changes in total contrail coverage between the two mixed scenarios P4 and S5 are only marginal and therefore not shown.
5
The zonal mean contrail coverage is presented in Fig.4for January and July. For the subsonic scenario S4 the zonal mean contrail cover peaks in northern mid-latitudes at typical flight levels around 200 hPa, i.e. near the zonal mean tropopause. The contrail cover in Northern Hemisphere mid-latitudes exhibits a distinct annual cycle (Ponater et al.,2002;Meyer et al.,2002;Palikonda et al.,2005): In summer the middle
tropo-10
sphere is often too warm for the formation of contrails, whereas in winter contrails can also form below 300 hPa. The model results for the mixed fleet scenario S5 indicate a similar pattern at subsonic cruise levels as S4, but additionally small contrail coverage in the tropics at supersonic cruise levels around 70 hPa. In the northern extratropical lower stratosphere atmospheric conditions are favourable for contrail formation only in
15
winter.
For a detailed inspection the differences in contrail cover between S5 and S4 are also displayed in Fig.4. The combined scenario S5 shows a reduced contrail coverage at subsonic cruise levels (200 hPa), especially in northern mid-latitudes with values up to 0.03%. A slight reduction at subsonic cruise levels is also found in tropical regions.
20
Furthermore, the model results for S5 reveal additional formation of contrails in the tropical lower stratosphere, with maximum values in winter (0.03%). Additionally, S5 shows slightly enhanced contrail cover in northern mid-latitudes at subsonic flight levels which is caused by supersonic aircraft flying in subsonic mode over land. The replace-ment of subsonic aircraft by supersonic aircraft leads to a vertical and geographical
25
displacement in contrail coverage.
The reduced cruise speed of Mach 1.6 in perturbation scenario P4 results in lower supersonic cruise levels (Fig.1) which directly affects the vertical distribution of simu-lated contrails. In P4 contrails in the tropical lower stratosphere form at lower altitudes
ACPD
7, 12927–12958, 2007 Do supersonic aircraft avoid contrails? A. Stenke et al. Title Page Abstract Introduction Conclusions References Tables Figures ◭ ◮ ◭ ◮ Back Close Full Screen / EscPrinter-friendly Version Interactive Discussion
EGU than in S5, around the tropical tropopause. At subsonic cruise levels P4 shows small
modifications compared to S5 which are caused by slightly different flight routes. Gen-erally, the changes in contrail coverage between the subsonic and the mixed fleets directly reflect the altered flight routes, taking into account the ambient meteorological conditions of the respective atmospheric region.
5
Table2 summarises the annual mean total contrail cover for different geographical regions and the three scenarios S4, S5 and P4. The global mean value for visible contrails amounts to 0.372% for the subsonic scenario S4 which is significantly higher than the respective value of 0.22% for the 2050 NASA subsonic air traffic inventory (National Aeronautics and Space Administration (NASA) inventories, scenario FESGa;
10
IPCC,1999) as calculated byMarquart et al.(2003). This difference is related to the different design of the air traffic inventories. The fuel consumption for the S4 scenario is approximately a factor of 1.4 larger than for the NASA inventory (see Table3 and Fig. 6). Furthermore, the geographical distribution of the flight routes is expected to differ between both datasets. In extratropical regions as well as on global average
15
the combined scenarios S5 and P4 reveal a slight reduction in contrail coverage with a more pronounced decrease of visible contrails. For example, global mean contrail coverage for S5 decreases by a factor of 0.984 in terms of visible contrails, but only by a factor of 0.997 in terms of all contrails. In tropical regions the mixed fleet scenar-ios show the opposite effect, i.e. an increase in the overall contrail coverage with an
20
almost constant amount of visible contrails. These results indicate that the decrease in contrail coverage in Northern Hemisphere extratropics caused by the replacement of subsonic aircraft by supersonic aircraft is mainly related to a decrease of visible contrails, whereas the increase in contrail coverage in the tropical stratosphere is as-sociated with an increase in subvisible contrails.
25
3.2 Radiative forcing
In this section we present the contrail radiative forcing (RF) for the different air traffic inventories. For the RF calculations all contrails (not only the visible contrails) are
ACPD
7, 12927–12958, 2007 Do supersonic aircraft avoid contrails? A. Stenke et al. Title Page Abstract Introduction Conclusions References Tables Figures ◭ ◮ ◭ ◮ Back Close Full Screen / EscPrinter-friendly Version Interactive Discussion
EGU considered. However, contrails with extremely low optical depth are expected to have
a negligible impact on radiation (less than 8%, Marquart et al.,2003). The following RF values refer to the stratosphere-adjusted radiative forcing at the tropopause, which is regarded to be a better metric of climate impact than the instantaneous RF at the top of the atmosphere, as used in, e.g.Minnis et al.(1999). We note that determining
5
the contrail RF at the tropopause has conceptual consequences for the shortwave part of the forcing: Shortwave absorption contributes positive in case of tropospheric contrails, but negative in case of stratospheric contrails, because in the former case the absorbed radiation is gained by the troposphere-surface-system. Scattering of contrails is contributing negative in either case, however. As we shall see, this feature is not
10
relevant for our results as shortwave absorption by contrails is negligible in comparison to shortwave scattering.
In Table 3 the global annual mean radiative forcing components from contrails are listed for the different air traffic scenarios, along with the respective fuel consumption and the total contrail cover. Furthermore, the respective RF values for a 2050 NASA
15
air traffic scenario taken fromMarquart et al.(2003) are added for comparison. Con-sidering the changes in air traffic density and climate, the contrail net RF for a subsonic fleet increases from 9.4 mW m−2in 2025 (S1) to 24.7 mW m−2in 2050 (S4). The mixed fleet scenarios indicate a slightly smaller contrail net RF of 9.3 mW m−2 in 2025 (S2) and 24.2 mW m−2in 2050 (S5), respectively. This means a reduction in net RF for the
20
mixed fleet compared to the subsonic fleet by approximately 2% in 2050, based on the assumption of constant RPK (Table1).
The radiative impact of contrails does not only depend on coverage, but also on their optical properties.Ponater et al.(2002) andMarquart et al.(2003) found that the optical depth of contrails increases with decreasing altitude, from the poles towards the
equa-25
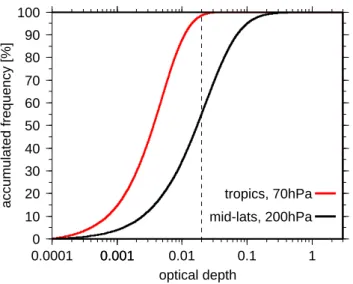
tor, and from winter to summer. However, they analysed upper tropospheric contrails exclusively, whose properties are not necessarily valid for the lower stratosphere. Fig-ure5extends the analysis presented inMarquart et al.(2003, their Fig. 7) by showing the accumulated frequency distributions of the optical depth for contrails in the
trop-ACPD
7, 12927–12958, 2007 Do supersonic aircraft avoid contrails? A. Stenke et al. Title Page Abstract Introduction Conclusions References Tables Figures ◭ ◮ ◭ ◮ Back Close Full Screen / EscPrinter-friendly Version Interactive Discussion
EGU ical lower stratosphere (red line) and in the northern extratropical upper troposphere
(black line). The frequency distributions are based on semi-daily values of the model simulation S5 including all years of the simulation. The distribution functions for both regions show remarkable differences: Contrails in the tropical lower stratosphere are optically thinner than contrails in the upper troposphere in northern extratropics. The
5
main fraction of these optically thin contrails in the tropical lower stratosphere are below the threshold optical depth of 0.02, i.e. they are regarded as subvisible in the model simulations. Atmospheric conditions in the tropical lower stratosphere are significantly drier than in the upper troposphere, i.e. less atmospheric water vapour is available for condensation, which leads to a reduced ice water content within contrails and therefore
10
a reduced optical depth. The change in optical properties of contrails in combination with the change in total contrail cover explains the reduced net RF in the mixed fleet scenario S5 compared to the subsonic scenario S4.
A direct comparison of the present results with previous studies is difficult since the simulated contrails strongly depend on the air traffic distribution. Marquart et al.
15
(2003) assessed the future development of contrails for a subsonic fleet with the GCM ECHAM4. Their results for 2050 are listed in Table 3. The fuel consumption for the S4 scenario is approximately a factor of 1.4 higher than in Marquart et al. (2003). In contrast to Marquart et al. (2003) who used the fuel consumption as a weighting factor to calculate the contrail coverage, the flown distance was used in the present
20
study which reduces global contrail cover and RF by about 10% (Fichter et al.,2005). This would imply a reduced contrail cover and RF for S4 compared toMarquart et al. (2003). However, the simulated contrail cover and contrail net RF for S4 are a factor of ≈1.7 higher, i.e. the S4 scenario shows a higher contrail coverage per fuel con-sumption. This indicates a remarkably different air traffic distribution in both air traffic
25
inventories. Nevertheless, both studies show a close correlation between global mean contrail cover and net RF. Taking into account all available results for different years and air traffic scenarios (subsonic and combined fleets) from the present study and fromMarquart et al.(2003) the mean contrail net RF per contrail coverage amounts to
ACPD
7, 12927–12958, 2007 Do supersonic aircraft avoid contrails? A. Stenke et al. Title Page Abstract Introduction Conclusions References Tables Figures ◭ ◮ ◭ ◮ Back Close Full Screen / EscPrinter-friendly Version Interactive Discussion
EGU 63.8±5.7 mW m−2/1%. Figure6summarises the results ofMarquart et al.(2003) and
the present study.
IPCC (1999) estimated the contrail net RF of a subsonic fleet to be 71 mW m−2 in 2025 and 100 mW m−2 in 2050. Additionally, IPCC (1999) provided an estimate of 67 mW m−2and 89 mW m−2for the net contrail RF of the combined fleet scenario Fa1H
5
in 2025 and 2050, respectively. The Fa1H scenario assumes that supersonic aircraft come into service in 2015 with a final capacity of 1000 aircraft in 2040, continuing operation to 2050 (11% of the subsonic fleet Fa1 in 2050). This supersonic aircraft cruises with Mach 2.4 at 18–20 km altitude. The combined fleet Fa1H has a total fuel consumption of 557.4 Tg yr−1 in 2050 (supersonic part 140 Tg yr−1). However, inIPCC
10
(1999) it was assumed that persistent contrails in the stratosphere are unlikely because of the low humidity values, and, therefore, radiative forcing from contrails from a future fleet of supersonic aircraft can be neglected. Therefore, the reduction in net contrail RF for the Fa1H scenario compared to the subsonic scenario Fa1 directly reflects the percentage of subsonic aircraft replaced by supersonic aircraft, i.e. 11% less subsonic
15
aircraft results in 11% less contrail RF in 2050.
The assumption made in IPCC (1999) that contrails from supersonic aircraft may be neglected disagrees with the findings of the present study. The replacement of approximately 4% of the subsonic fleet by supersonic aircraft (scenario S5) in terms of the number of transported passengers (RPK) results in a reduction in global mean
20
contrail cover (visible contrails) from 0.372% to 0.366% (Sect.3.1) and a reduced net contrail RF of approximately 2%, respectively. Our study indicates that supersonic aircraft do not completely avoid contrails and contrail radiative forcing.
4 Discussion
When assessing the impact of supersonic aircraft on contrails by means of GCM
simu-25
lations the question arises how suitable the applied model tool is for this kind of study. Particularly systematic model biases in the simulated temperature and humidity
dis-ACPD
7, 12927–12958, 2007 Do supersonic aircraft avoid contrails? A. Stenke et al. Title Page Abstract Introduction Conclusions References Tables Figures ◭ ◮ ◭ ◮ Back Close Full Screen / EscPrinter-friendly Version Interactive Discussion
EGU tribution may affect simulated contrails. The ECHAM4 GCM like many other GCMs
(e.g. Gates et al., 1999) exhibits a serious “cold bias” in the extratropical lowermost stratosphere with a maximum temperature deviation of about 10 K at the 200 hPa level (Roeckner et al.,1996;Land et al.,1999), i.e. the altitude range where contrails gen-erally form. Furthermore, the model shows are severe “wet bias” in the extratropical
5
lowermost stratosphere (Stenke et al., 2007)2. Above 100 hPa water vapour concentra-tions are still overestimated by a factor of approximately 1.5 compared to observaconcentra-tions (Stenke and Grewe,2005).Marquart et al.(2003) quantified the impact of model biases on the simulation of contrails by offline diagnostic calculations using ECMWF reanaly-sis (ERA) and ECHAM4 temperature and humidity data as meteorological input. They
10
found that the contrail cover in the northern extratropics is only slightly affected by the cold bias, but is very sensitive to the bias in relative humidity. In contrast, in tropical regions the temperature bias is more important for contrail formation than the model errors in the humidity distribution.
In a recent study Stenke et al. (2007)2 showed that the simulated wet bias in the
15
extratropical lowermost stratosphere is caused by the exceptionally high numerical dif-fusion of the operational Lagrangian advection scheme. Replacing the semi-Lagrangian scheme by the pure semi-Lagrangian transport scheme ATTILA (Reithmeier and Sausen, 2002) results in a significant reduction of the simulated wet bias and, as a consequence, of the simulated cold bias, too. In the following, the updated model
20
version using the Lagrangian transport scheme ATTILA is referred to as E39/ATTILA. In order to study the influence of the above mentioned model biases on the forma-tion of contrails in a self-consistent model framework, we addiforma-tionally performed the model simulations S4 (subsonic) and S5 (mixed) with the “unbiased” model version E39/ATTILA. The results of first sensitivity simulations show some remarkable
differ-25
ences between the standard model and E39/ATTILA in terms of contrail coverage and optical properties of contrails. In the present study, the main focus is on the effect
2
Stenke, A., Grewe, V., and Ponater, M.: Lagrangian transport of water vapour and cloud water in the ECHAM4 GCM and its impact on the cold bias, Clim. Dynam., under review, 2007.
ACPD
7, 12927–12958, 2007 Do supersonic aircraft avoid contrails? A. Stenke et al. Title Page Abstract Introduction Conclusions References Tables Figures ◭ ◮ ◭ ◮ Back Close Full Screen / EscPrinter-friendly Version Interactive Discussion
EGU of the replacement of subsonic aircraft by supersonic aircraft. A detailed analysis of
the properties of tropospheric contrails in the model version E39/ATTILA compared to the standard model will be published elsewhere (C. Fichter, personal communication, 2007).
Changes in the zonal mean contrail cover between S5 and S4 for January as
simu-5
lated with E39/ATTILA are displayed in Fig.7for comparison with the standard model E39 (see Fig.4). E39/ATTILA shows a similar pattern as E39: The mixed scenario S5 indicates a reduced contrail cover at subsonic cruise levels which is most pronounced in northern extratropics, and an increase in contrail cover in the tropical lower strato-sphere. Furthermore, E39/ATTILA also shows a slight increase in contrail cover at
10
subsonic cruise levels around 40◦N to 50◦N. Compared to E39 the increase in tropi-cal lower stratospheric contrail cover is less pronounced in E39/ATTILA. In E39/ATTILA stratospheric water vapour concentrations are significantly lower than in E39 (Stenke et al., 20072) which results in lower relative humidity. Therefore, meteorological conditions in the tropical lower stratosphere are less suitable for contrail formation in E39/ATTILA.
15
For July, the model version E39/ATTILA again shows a similar difference pattern as the standard model E39, but with a slightly weaker maximum in the tropical lower strato-sphere. Model biases in the simulated temperature and humidity distribution do not affect the main result of this study that the replacement of subsonic aircraft by super-sonic aircraft leads to a geographical shift in contrail cover from the northern
extratrop-20
ical subsonic flight levels into the tropical lower stratosphere.
5 Conclusions
The impact of future supersonic aircraft on contrail cover and radiative forcing was in-vestigated by means of model simulations with the ECHAM4 GCM including the contrail parameterization by Ponater et al. (2002) with modifications by Marquart and Mayer
25
(2002). This model approach allowed us to simulate contrail coverage, optical proper-ties and radiative forcing of contrails in a consistent way with a comprehensive climate
ACPD
7, 12927–12958, 2007 Do supersonic aircraft avoid contrails? A. Stenke et al. Title Page Abstract Introduction Conclusions References Tables Figures ◭ ◮ ◭ ◮ Back Close Full Screen / EscPrinter-friendly Version Interactive Discussion
EGU model. The effect of supersonic aircraft was evaluated using SCENIC air traffic
in-ventories for subsonic and mixed (sub- and supersonic) fleets for the years 2025 and 2050, respectively (Marizy et al., 20071). In case of a mixed fleet subsonic aircraft are replaced by supersonic aircraft provided that the number of revenue passenger kilometres (RPK) is constant.
5
The replacement of subsonic aircraft by supersonic aircraft does not avoid contrails in terms of global mean total contrail cover, but it leads to a shift in the geographical dis-tribution of contrails: Less contrails in the northern extratropics at subsonic flight levels which is a direct effect of the replacement of subsonic aircraft, and increasing contrail coverage in the tropical lower stratosphere, i.e. at supersonic cruise levels. Contrails in
10
the tropical lower stratosphere are optically thinner than those in the extratropical upper troposphere. This forms an extension to previous results ofMarquart et al.(2003) that the optical depth of subsonic contrails decreases with height. Optically thinner contrails have a reduced net radiative forcing. The contrail net RF in the mixed fleet scenario S5 is approximately 2% (1.6%) lower than in the subsonic fleet scenario S4, relating
15
to a constant number of passenger kilometres (RPK) and a replacement of 4% of the RPK by supersonic aircraft. Reducing the supersonic cruise speed from Mach 2.0 to Mach 1.6 leads to a lower supersonic cruise altitude and therefore a vertical shift in contrail formation. However, the global mean total contrail cover and the radiative impact of supersonic contrails is not affected.
20
These results might suggest that supersonic aircraft have a smaller climate impact than subsonic aircraft. However, changes in contrail cover and contrail RF are only one aspect in terms of investigating the climate impact of future supersonic air traffic. Aircraft emissions cover a range of gases and particulate matter, like carbon dioxide (CO2), water vapour (H2O), nitrogen oxides (NOx) and sulphate aerosols. NOx
emis-25
sions, for example, lead to a destruction or production of ozone, depending on the atmospheric region. Grewe et al.(2007) have shown that stratospheric water vapour emissions from supersonic aircraft make by far the most important contribution to cli-mate change. The total radiative forcing from supersonic aircraft (S5–S4) except
con-ACPD
7, 12927–12958, 2007 Do supersonic aircraft avoid contrails? A. Stenke et al. Title Page Abstract Introduction Conclusions References Tables Figures ◭ ◮ ◭ ◮ Back Close Full Screen / EscPrinter-friendly Version Interactive Discussion
EGU trails amounts to 22 mW m−2 in 2050, with a contribution of 23 mW m−2 from water
vapour, 3.3 mW m−2 from carbon dioxide, −2.8 mW m−2 and −1.6 mW m−2 from ozone and methane. Compared to the other variables contrails (−0.5 mW m−2) are only a mi-nor contributor to climate change with respect to supersonic aircraft. This comparison shows that many aspects have to be considered when evaluating the climate impact of
5
future air traffic.
The simulation of contrails with a GCM like ECHAM4 is highly sensitive to systematic model errors in the background temperature and humidity distribution. Uncertainties of the model results for present day and future subsonic fleets have been discussed in Ponater et al.(2002) andMarquart et al.(2003). For the current study it was important
10
to know whether the effect of the replacement of subsonic by supersonic aircraft is cap-tured correctly. Sensitivity studies with an updated model version E39/ATTILA suggest that the persistent model biases in terms of temperature and humidity in the standard model version E39 slightly affect the magnitude, but not the pattern of change itself. Reducing the quantitative uncertainty of the model results requires further evaluation
15
of the simulated contrail properties for the updated model E39/ATTILA by means of detailed comparison with observations.
Acknowledgements. We would like to thank our colleagues C. Fichter and M. Ponater for their
constructive suggestions on this manuscript and many helpful discussions. This study was funded by the European Commission through the SCENIC project under the 5th Framework
20
Programme. The model simulations have been performed on the NEC SX-6 high performance computer of the German Climate Computing Centre (DKRZ), Hamburg.
References
Appleman, H.: The formation of exhaust condensation trails by jet aircraft, Bull. Am. Meteor. Soc., 34, 14–20, 1953. 12929
25
Fichter, C., Marquart, S., Sausen, R., and Lee, D.: The impact of cruise altitude on contrails and related radiative forcing, Meteorol. Z., pp. 563–572, 2005. 12932,12940
ACPD
7, 12927–12958, 2007 Do supersonic aircraft avoid contrails? A. Stenke et al. Title Page Abstract Introduction Conclusions References Tables Figures ◭ ◮ ◭ ◮ Back Close Full Screen / EscPrinter-friendly Version Interactive Discussion
EGU Gates, W. L., Boyle, J. S., Covey, C., Dease, C. G., Doutriaux, C. M., Drach, R. S., Fiorino, M.,
Glecker, P. J., Hnilo, J. J., Marlais, S. M., Phillips, T. J., Potter, G. L., Santer, B. D., Sperber, K. R., Taylor, K. E., and Williams, D. N.: An overview of the results of the Atmospheric Model Intercomparison Project (AMIP I), Bull. Amer. Meteor. Soc., 80, 29–55, 1999. 12942
Geleyn, J. F. and Hollingsworth, A.: An economical analytical method for the computation of
5
the interaction between scattering and line absorption of radiation, Beitr. Phys. Atmos., 52, 1–16, 1978. 12936
Gierens, K., Sausen, R., and Schumann, U.: A diagnostic study of the global distribution of contrails. Part II: Future air traffic scenarios, Theor. Appl. Climatol., 63, 1–9, 1999. 12934
Grewe, V., Stenke, A., Ponater, M., Sausen, R., Pitari, G., Iachetti, D., Rogers, H., Dessens, O.,
10
Pyle, J., Isaksen, I. S. A., Gulstad, L., Søvde, O. A., Marizy, C., and Pascuillo, E.: Climate impact of supersonic air traffic: An approach to optimize a potential future supersonic fleet – Results from the EU-project SCENIC, Atmos. Chem. Phys. Discuss., 7, 6143–6187, 2007,
http://www.atmos-chem-phys-discuss.net/7/6143/2007/. 12930,12944
IPCC: Aviation and the global atmosphere, Intergovernmental Panel on Climate Change,
Cam-15
bridge University Press, New York, USA, 1999. 12929,12930,12938,12941
IPCC: Climate Change 2001 – The scientific basis, Intergovernmental Panel on Climate Change, Cambridge University Press, New York, USA, 2001. 12933
Land, C., Ponater, M., Sausen, R., and Roeckner, E.: The ECHAM4.L39(DLR) atmosphere GCM – Technical description and model climatology, DLR Forschungsbericht 1999-31, ISSN
20
1434-8454, K ¨oln, also available viahttp://www.pa.op.dlr.de/echam/L39.html, 1999. 12931,
12942
Land, C., Feichter, J., and Sausen, R.: Impact of vertical resolution on the transport of passive tracers in the ECHAM4 model, Tellus (B), 54, 344–360, 2002. 12931
Mannstein, H., Meyer, R., and Wendling, P.: Operational detection of contrails from
NOAA-25
AVHRR-data, Int. J. Remote Sens., 20, 1641–1660, 1999. 12932
Marquart, S. and Mayer, B.: Towards a reliable GCM estimation of contrail radiative forcing, Geophys. Res. Lett., 29, 1179, doi:10.1029/2001GL014 075, 2002. 12933,12943
Marquart, S., Ponater, M., Mager, F., and Sausen, R.: Future Development of Contrails Cover, Optical Depth, and Radiative Forcing: Impacts of Increasing Air Traffic and Climate Change,
30
J. Climate, 16, 2890–2904, 2003. 12929, 12932, 12938, 12939, 12940, 12941, 12942,
12944,12945,12951,12957
ACPD
7, 12927–12958, 2007 Do supersonic aircraft avoid contrails? A. Stenke et al. Title Page Abstract Introduction Conclusions References Tables Figures ◭ ◮ ◭ ◮ Back Close Full Screen / EscPrinter-friendly Version Interactive Discussion
EGU forcing by line-shaped contrails derived from satellite data, J. Geophys. Res., 107, 4104,
doi:10.1029/2001JD000426, 2002. 12937
Meyer, R., Buell, R., Leiter, C., Mannstein, H., Pechtl, S., Oki, T., and Wendling, P.: Contrail observations over Southern and Eastern Asia in NOAA/AVHRR data and comparisons to contrail simulations in a GCM, Int. J. Remote Sens., 28, 2049–2069, 2007.12932
5
Minnis, P., Schumann, U., Doelling, D. R., Gierens, K. M., and Fahey, D. W.: Global distribution of contrail radiative forcing, Geophys. Res. Lett., 26, 1853–1856, 1999. 12939
Myhre, G. and Stordal, F.: On the tradeoff of the solar and thermal infrared radiative impact of contrails, Geophys. Res. Lett., 28, 3119–3122, 2001. 12929
Palikonda, R., Minnis, P., Duda, D. P., and Mannstein, H.: Contrail coverage derived from 2001
10
AVHRR data over the continental United States of America and surrounding areas, Meteorol. Z., 14, 525–536, 2005. 12937
Ponater, M., Marquart, S., and Sausen, R.: Contrails in a comprehensive global climate model: Parameterisation and radiative forcing results, J. Geophys. Res., 107, 4164, doi:10.1029/2001JD000 429, 2002. 12930, 12931, 12932, 12936, 12937, 12939, 12943,
15
12945
R ¨ais ¨anen, P.: Effective longwave cloud fraction and maximum-random overlap of clouds: a problem and a solution, Mon. Weather Rev., 126, 3336–3340, 1998. 12933
Rasch, P. J. and Williamson, D. L.: Computational aspects of moisture transport in global mod-els of the atmosphere, Q. J. Roy. Meteor. Soc., 116, 1071–1090, 1990. 12931
20
Reithmeier, C. and Sausen, R.: ATTILA: atmospheric tracer transport in a Lagrangian model, Tellus, 54B, 278–299, 2002.12942
Roeckner, E., Arpe, K., Bengtsson, L., Christoph, M., Claussen, M., D ¨umenil, L., Esch, M., Giorgetta, M., Schlese, U., and Schulzweida, U.: The atmospheric general circulation model ECHAM–4: Model description and simulation of present–day climate, Report No. 218,
Max-25
Planck-Institut f ¨ur Meteorologie, Hamburg, 1996.12931,12942
Roeckner, E., Bengtson, L., Feichter, J., Lelieveld, J., and Rodhe, H.: Transient climate change simulations with a coupled atmosphere-ocean GCM including the tropospheric sulfur cycle, J. Climate, 12, 3004–3032, 1999. 12933
Sausen, R., Isaksen, I., Grewe, V., Hauglustaine, D., Lee, D. S., Myhre, G., K ¨ohler, M. O., Pitari,
30
G., Schumann, U., Stordal, F., and Zerefos, C.: Aviation radiative forcing in 2000: An update on IPCC (1999), Meteorol. Z., 14, 555–561, 2005. 12929
ACPD
7, 12927–12958, 2007 Do supersonic aircraft avoid contrails? A. Stenke et al. Title Page Abstract Introduction Conclusions References Tables Figures ◭ ◮ ◭ ◮ Back Close Full Screen / EscPrinter-friendly Version Interactive Discussion
EGU Schriften der Deutschen Akademie der Luftfahrtforschung, edited by: Oldenbourg, R.,
vol. 44, pp. 1–15, Munich, Germany, 1941. 12929
Schumann, U.: On conditions for contrail formation from aircraft exhausts, Meteorol. Z., 5, 4–24, 1996. 12929
Stenke, A. and Grewe, V.: Simulation of stratospheric water vapor trends: Impact on
strato-5
spheric ozone, Atmos. Chem. Phys., 5, 1257–1272, 2005,
http://www.atmos-chem-phys.net/5/1257/2005/. 12942
Stuber, N. and Forster, P.: The impact of diurnal variations of air traffic on contrail radiative forcing, Atmos. Chem. Phys., 7, 3153–3162, 2007,
http://www.atmos-chem-phys.net/7/3153/2007/. 12929
10
Stuber, N., Sausen, R., and Ponater, M.: Stratosphere adjusted radiative forcing calculations in a comprehensive climate model, Theor. Appl. Climatol., 68, 125–135, 2001. 12932
Williamson, D. L. and Rasch, P. J.: Water vapor transport in the NCAR CCM2, Tellus (A), 46, 34–51, 1994. 12931
ACPD
7, 12927–12958, 2007 Do supersonic aircraft avoid contrails? A. Stenke et al. Title Page Abstract Introduction Conclusions References Tables Figures ◭ ◮ ◭ ◮ Back Close Full Screen / EscPrinter-friendly Version Interactive Discussion
EGU Table 1. Main characteristics of the SCENIC emission dataset. S4 denotes the subsonic fleet
for 2050, S5 the mixed fleet for 2050, and P4 a perturbation scenario for the mixed fleet opti-mised for a reduced speed (Mach 1.6). Abbreviations: nm = nautical miles (1 nm≈1852.2 km); RPK = Revenue Passenger Kilometre; pax = passenger; Tot = Total Fleet; Super = Supersonic Fleet.
Scenario Aircraft Speed Maximum Cruise RPK Commercial Commercial
Range Altitude Fuel Distance
[number] [Mach] [nm] [kft] [1011pax km] [Tg yr−1] [1010
km]
Supersonic Characteristics Tot Super Tot Super Tot
S1-Sub 2025 – – – – 75 – 355 – 5.63
S2-Mixed 2025 211 2.0 5500 55–65 75 4.3 370 25 5.70
S4-Sub 2050 – – – – 178.2 – 656 – 11.67
S5-Mixed 2050 501 2.0 5500 55–65 178.4 7.3 700 60 11.84
ACPD
7, 12927–12958, 2007 Do supersonic aircraft avoid contrails? A. Stenke et al. Title Page Abstract Introduction Conclusions References Tables Figures ◭ ◮ ◭ ◮ Back Close Full Screen / EscPrinter-friendly Version Interactive Discussion
EGU Table 2. Annually averaged total contrail cover (%) for different scenarios and different regions.
Values in parentheses refer to “visible” contrails. Western Europe: 40◦–55◦N, 10◦W–20◦E;
North Atlantic Flight Corridor (NAFC): 28◦–72◦N, 83◦W–15◦E; North Pacific Flight Corridor
(NPFC): 20◦–72◦N, 120◦E–120◦W; Thailand: 0◦–25◦N, 90◦–122◦E.
Scenario World Western Europe NAFC NPFC Thailand
S4-Sub 0.610 (0.372) 11.84 (6.25) 3.10 (1.87) 0.83 (0.49) 1.22 (0.84) S5-Mixed 0.608 (0.366) 11.80 (6.22) 3.01 (1.82) 0.82 (0.48) 1.31 (0.83) P4-Speed 0.606 (0.365) 11.80 (6.22) 3.02 (1.82) 0.81 (0.48) 1.27 (0.84)
ACPD
7, 12927–12958, 2007 Do supersonic aircraft avoid contrails? A. Stenke et al. Title Page Abstract Introduction Conclusions References Tables Figures ◭ ◮ ◭ ◮ Back Close Full Screen / EscPrinter-friendly Version Interactive Discussion
EGU Table 3. Annually and globally averaged fuel consumption, total contrail coverage (visible)
and contrail radiative forcing components for the different air traffic inventories. The respective values for 2050 taken fromMarquart et al.(2003) are listed for comparison.
Fuel Coverage Radiative Forcing [mW m−2]
Scenario [Tg yr−1] [%] Longwave Shortwave Net
S1-Sub 2025 355 0.162 13.7 −4.3 9.4 S2-Mixed 2025 370 0.159 13.6 −4.2 9.3 S4-Sub 2050 656 0.372 35.8 −11.1 24.7 S5-Mixed 2050 700 0.366 35.1 −10.9 24.2 P4-Speed 2050 682 0.365 35.3 −11.0 24.3 Marquart et al.(2003) 471 0.22 20.7 −5.9 14.8
ACPD
7, 12927–12958, 2007 Do supersonic aircraft avoid contrails? A. Stenke et al. Title Page Abstract Introduction Conclusions References Tables Figures ◭ ◮ ◭ ◮ Back Close Full Screen / EscPrinter-friendly Version Interactive Discussion EGU 0 2 4 6 8 10 12 14 16 18 20 Altitude [km] -90˚ -75˚ -60˚ -45˚ -30˚ -15˚ 0˚ 15˚ 30˚ 45˚ 60˚ 75˚ 90˚ Latitude 0.5 1 5 10 50 100 200 500 1000 2000 [10-9 kg s-1 m-2] (a) 0 2 4 6 8 10 12 14 16 18 20 Altitude [km] -90˚ -75˚ -60˚ -45˚ -30˚ -15˚ 0˚ 15˚ 30˚ 45˚ 60˚ 75˚ 90˚ Latitude -500 -400 -300 -200 -100 -1 1 100 200 300 400 500 [10-9 kg s-1 m-2 ] (b) 0 2 4 6 8 10 12 14 16 18 20 Altitude [km] -90˚ -75˚ -60˚ -45˚ -30˚ -15˚ 0˚ 15˚ 30˚ 45˚ 60˚ 75˚ 90˚ Latitude -500 -400 -300 -200 -100 -1 1 100 200 300 400 500 [10-9 kg s-1 m-2] (c)
Fig. 1. Horizontally integrated fuel consumption [10−9kg s−1m−2] of commercial aircraft con-sidered in the SCENIC subsonic fleet for 2050 (a). Difference between the 2050 mixed and subsonic fleet S5-S4 (b) and between the mixed fleet scenarios P4-S5 (c). The black line indicates a zonal and annual mean tropopause height.
ACPD
7, 12927–12958, 2007 Do supersonic aircraft avoid contrails? A. Stenke et al. Title Page Abstract Introduction Conclusions References Tables Figures ◭ ◮ ◭ ◮ Back Close Full Screen / EscPrinter-friendly Version Interactive Discussion EGU -90˚ -60˚ -30˚ 0˚ 30˚ 60˚ 90˚ 180˚ -135˚ -90˚ -45˚ 0˚ 45˚ 90˚ 135˚ 180˚ 0.05 0.1 0.5 1 5 10 20 50 100 200 [Tg/yr] 180˚ -135˚ -90˚ -45˚ 0˚ 45˚ 90˚ 135˚ 180˚ -90˚ -60˚ -30˚ 0˚ 30˚ 60˚ 90˚ -100 -50 -30 -10 -5 -1 1 5 10 30 50 100 [Tg/yr]
Fig. 2. Upper panel: Horizontal distribution of the vertically integrated fuel consumption of commercial aircraft considered in the SCENIC subsonic fleet for 2050 (S4) [Tg yr−1]. Lower
ACPD
7, 12927–12958, 2007 Do supersonic aircraft avoid contrails? A. Stenke et al. Title Page Abstract Introduction Conclusions References Tables Figures ◭ ◮ ◭ ◮ Back Close Full Screen / EscPrinter-friendly Version Interactive Discussion
EGU
160˚W120˚W 80˚W 40˚W 0˚ 40˚E 80˚E 120˚E 160˚E
60˚S 30˚S 0˚ 30˚N 60˚N 0.001 0.002 0.005 0.01 0.02 0.05 0.1 0.2 0.5 1 2 5 [%]
160˚W120˚W 80˚W 40˚W 0˚ 40˚E 80˚E 120˚E 160˚E
60˚S 30˚S 0˚ 30˚N 60˚N -3 -1 -0.3 -0.1 -0.03 -0.01 0.01 0.03 0.1 0.3 1 3 [%]
Fig. 3. Annually averaged total contrail cover [%] for the subsonic fleet S4 as simulated by ECHAM4 (left), and differences in total contrail cover [%] between S5 and S4 (right).
ACPD
7, 12927–12958, 2007 Do supersonic aircraft avoid contrails? A. Stenke et al. Title Page Abstract Introduction Conclusions References Tables Figures ◭ ◮ ◭ ◮ Back Close Full Screen / EscPrinter-friendly Version Interactive Discussion EGU 1000700 500 300 200 10070 50 30 20 10 90˚S 60˚S 30˚S Eq 30˚N 60˚N 90˚N Pressure [hPa] 90˚S 60˚S 30˚S Eq 30˚N 60˚N 90˚N S4 subsonic Jan 1000700 500 300 200 10070 50 30 20 10 90˚S 60˚S 30˚S Eq 30˚N 60˚N 90˚N Pressure [hPa] 90˚S 60˚S 30˚S Eq 30˚N 60˚N 90˚N S4 subsonic Jul 1000700 500 300 200 10070 50 30 20 10 90˚S 60˚S 30˚S Eq 30˚N 60˚N 90˚N Pressure [hPa] 90˚S 60˚S 30˚S Eq 30˚N 60˚N 90˚N S5 mixed 1000700 500 300 200 10070 50 30 20 10 90˚S 60˚S 30˚S Eq 30˚N 60˚N 90˚N Pressure [hPa] 90˚S 60˚S 30˚S Eq 30˚N 60˚N 90˚N 0.001 0.002 0.005 0.01 0.02 0.05 0.1 0.2 0.5 1 2 5 [%] S5 mixed 1000700 500 300 200 10070 50 30 20 10 90˚S 60˚S 30˚S Eq 30˚N 60˚N 90˚N Pressure [hPa] 90˚S 60˚S 30˚S Eq 30˚N 60˚N 90˚N S5-S4 1000700 500 300 200 10070 50 30 20 10 90˚S 60˚S 30˚S Eq 30˚N 60˚N 90˚N Pressure [hPa] 90˚S 60˚S 30˚S Eq 30˚N 60˚N 90˚N S5-S4 1000700 500 300 200 10070 50 30 20 10 90˚S 60˚S 30˚S Eq 30˚N 60˚N 90˚N Pressure [hPa] 90˚S 60˚S 30˚S Eq 30˚N 60˚N 90˚N P4-S5 1000700 500 300 200 10070 50 30 20 10 90˚S 60˚S 30˚S Eq 30˚N 60˚N 90˚N Pressure [hPa] 90˚S 60˚S 30˚S Eq 30˚N 60˚N 90˚N P4-S5 -3 -1 -0.3 -0.1 -0.03 -0.01 0.01 0.03 0.1 0.3 1 3 [0.1 %]
Fig. 4. Top: Zonally averaged contrail cover [%] for the subsonic fleet S4 and the mixed fleet S5 as simulated by ECHAM4 for January (left) and July (right), respectively. Bottom: Changes in the zonal mean contrail cover [0.1%] between S5 and S4 and between P4 and S5 for Jan-uary (left) and July (right), respectively. The bold line indicates a zonal mean tropopause as simulated by ECHAM4 for each respective month.
ACPD
7, 12927–12958, 2007 Do supersonic aircraft avoid contrails? A. Stenke et al. Title Page Abstract Introduction Conclusions References Tables Figures ◭ ◮ ◭ ◮ Back Close Full Screen / EscPrinter-friendly Version Interactive Discussion EGU 0 10 20 30 40 50 60 70 80 90 100 accumulated frequency [%] 0.0001 0.0010.001 0.01 0.1 1 optical depth tropics, 70hPa mid-lats, 200hPa
Fig. 5. Frequency distribution of the contrail optical depth as simulated by ECHAM4 for the 2050 mixed fleet scenario S5 and for different geographical regions. Red: tropical lower stratosphere (20◦N–20◦S, 70 hPa), black: northern extratropical upper troposphere (70◦N–40◦N, 200 hPa). The threshold optical depth of 0.02 is indicated by the vertical dashed line.
ACPD
7, 12927–12958, 2007 Do supersonic aircraft avoid contrails? A. Stenke et al. Title Page Abstract Introduction Conclusions References Tables Figures ◭ ◮ ◭ ◮ Back Close Full Screen / EscPrinter-friendly Version Interactive Discussion EGU 0 5 10 15 20 25 30 35 40 45 CC (0.01%) / RF (mW/m 2 ) 0 100 200 300 400 500 600 700 800 Fuel (Tg/yr) 1992 2015 2025 2050 2050 Contrail Cover Radiative Forcing
Fig. 6. Global mean contrail coverage (squares, [0.01%]) and net radiative forcing (crosses,
[mW m−2]) as a function of fuel consumption [Tg yr−1
] for different air traffic inventories. The blue symbols indicate the results fromMarquart et al. (2003) for the years 1992, 2015 and 2050. The red symbols mark the results for the SCENIC datasets for the years 2025 and 2050, both for the subsonic scenarios (S1 and S4) and the mixed scenarios (S2 and S5, black framed). The black lines show the linear regressions for RF (solid) and contrail cover (dashed), respectively.
ACPD
7, 12927–12958, 2007 Do supersonic aircraft avoid contrails? A. Stenke et al. Title Page Abstract Introduction Conclusions References Tables Figures ◭ ◮ ◭ ◮ Back Close Full Screen / EscPrinter-friendly Version Interactive Discussion EGU Pressure [hPa] 1000 700 500 300 200 100 70 50 30 20 10 90˚S 60˚S 30˚S Eq 30˚N 60˚N 90˚N 90˚S 60˚S 30˚S Eq 30˚N 60˚N 90˚N -3.00 -1.00 -0.30 -0.10 -0.03 -0.01 0.01 0.03 0.10 0.30 1.00 3.00 [.1%]
Fig. 7. Changes in the zonally averaged contrail cover [0.1%] between S5 and S4 as simulated by E39/ATTILA for January. The bold line indicates a zonal mean tropopause.
![Fig. 1. Horizontally integrated fuel consumption [10 −9 kg s −1 m −2 ] of commercial aircraft con- con-sidered in the SCENIC subsonic fleet for 2050 (a)](https://thumb-eu.123doks.com/thumbv2/123doknet/14774219.592845/27.918.130.576.88.476/horizontally-integrated-consumption-commercial-aircraft-sidered-scenic-subsonic.webp)
![Fig. 2. Upper panel: Horizontal distribution of the vertically integrated fuel consumption of commercial aircraft considered in the SCENIC subsonic fleet for 2050 (S4) [Tg yr −1 ]](https://thumb-eu.123doks.com/thumbv2/123doknet/14774219.592845/28.918.181.535.50.523/horizontal-distribution-vertically-integrated-consumption-commercial-aircraft-considered.webp)
![Fig. 3. Annually averaged total contrail cover [%] for the subsonic fleet S4 as simulated by ECHAM4 (left), and di ff erences in total contrail cover [%] between S5 and S4 (right).](https://thumb-eu.123doks.com/thumbv2/123doknet/14774219.592845/29.918.46.663.196.410/annually-averaged-contrail-subsonic-simulated-echam-erences-contrail.webp)
![Fig. 4. Top: Zonally averaged contrail cover [%] for the subsonic fleet S4 and the mixed fleet S5 as simulated by ECHAM4 for January (left) and July (right), respectively](https://thumb-eu.123doks.com/thumbv2/123doknet/14774219.592845/30.918.205.502.34.463/zonally-averaged-contrail-subsonic-simulated-echam-january-respectively.webp)
![Fig. 6. Global mean contrail coverage (squares, [0.01%]) and net radiative forcing (crosses, [mW m −2 ]) as a function of fuel consumption [Tg yr −1 ] for di ff erent air tra ffi c inventories](https://thumb-eu.123doks.com/thumbv2/123doknet/14774219.592845/32.918.178.528.126.378/global-contrail-coverage-squares-radiative-function-consumption-inventories.webp)
![Fig. 7. Changes in the zonally averaged contrail cover [0.1%] between S5 and S4 as simulated by E39/ATTILA for January](https://thumb-eu.123doks.com/thumbv2/123doknet/14774219.592845/33.918.182.524.164.431/changes-zonally-averaged-contrail-cover-simulated-attila-january.webp)
