HAL Id: hal-00674178
https://hal.archives-ouvertes.fr/hal-00674178
Submitted on 25 Feb 2012HAL is a multi-disciplinary open access archive for the deposit and dissemination of sci-entific research documents, whether they are pub-lished or not. The documents may come from teaching and research institutions in France or abroad, or from public or private research centers.
L’archive ouverte pluridisciplinaire HAL, est destinée au dépôt et à la diffusion de documents scientifiques de niveau recherche, publiés ou non, émanant des établissements d’enseignement et de recherche français ou étrangers, des laboratoires publics ou privés.
Computer-Derived K-Indices
Armelle Bernard, Michel Menvielle, Aude Chambodut
To cite this version:
Armelle Bernard, Michel Menvielle, Aude Chambodut. On the Influence of the Data Sampling Interval on Computer-Derived K-Indices. CODATA Data Science Journal, Committee on Data for Science and Technology (CODATA), 2011, 10, pp.41-46. �10.2481/dsj.IAGA-07�. �hal-00674178�
ON THE INFLUENCE OF THE DATA SAMPLING INTERVAL ON
COMPUTER-DERIVED K-INDICES
A Bernard
1, M Menvielle
2,3, and A Chambodut
1*1*
Dept of Magnetic Observatories; Université de Strasbourg/EOST, CNRS; 5 rue Rene Descartes 67084 Strasbourg Cedex, France
Email: [email protected]
2
Université Versailles St-Quentin; CNRS/INSU, LATMOS-IPSL, Guyancourt, France Email: [email protected]
3
Université de Paris-Sud, Département des Sciences de la Terre, Orsay, France
ABSTRACT
The K index was devised by Bartels et al. (1939) to provide an objective monitoring of irregular geomagnetic activity. The K index was then routinely used to monitor the magnetic activity at permanent magnetic observatories as well as at temporary stations. The increasing number of digital and sometimes unmanned observatories and the creation of INTERMAGNET put the question of computer production of K at the centre of the debate. Four algorithms were selected during the Vienna meeting (1991) and endorsed by IAGA for the computer production of K indices. We used one of them (FMI algorithm) to investigate the impact of the geomagnetic data sampling interval on computer produced K values through the comparison of the computer derived K values for the period 2009, January 1st to 2010, May 31st at the Port-aux-Français magnetic observatory using magnetic data series with different sampling rates (the smaller: 1 second; the larger: 1 minute). The impact is investigated on both 3-hour range values and K indices data series, as a function of the activity level for low and moderate geomagnetic activity.
1 INTRODUCTION
The bias on K index values related to the sampling interval in digital recording of magnetic variations became of concern when magnetograms plotted from digital magnetometer data were put into use replacing analog magnetometers for K indices hand-scaling.
Niblett et al. (1984) used data from the Ottawa geomagnetic observatory to investigate the bias introduced by deriving the traditional K index from magnetograms plotted from recorded digital data. They hand-scaled K indices on analog photographic magnetograms (KA) and on analog magnetograms reconstructed using digital magnetic data in the form of 1-minute averaged values or spot values at selected sampling intervals of 1-second or greater (KR). They concluded that the lower K values tend to be biased significantly downward by one level when a digitizing interval greater than 30 seconds is used for construction of the reconstructed magnetograms.
In the course of the development and assessment of methods for computer derivation of K indices, differences between hand-scaled and computer derived K values were extensively studied, but the influence of the sampling interval was not addressed because at that time this sampling interval was always set to 1 minute (see, e.g., Menvielle et al., 1995 and reference therein; Bitterly et al., 1997). To our best knowledge, the influence of the sampling interval on the downward bias on the value of computer derived K indices has not yet been investigated. The present study investigates the impact of the change from 1-minute to 1-second in the INTERMAGNET standard sampling interval on computer derived K values, using Port-aux-Français magnetic observatory data for a 2-year period.
2
DERIVATION OF K INDICES FROM DIGITAL RECORDINGS
The K indices are based upon geomagnetic disturbances, measured in two horizontal geomagnetic components (X and
Y), after eliminating the regular daily variation (SR). An individual K index is an integer in the range 0 to 9 corresponding to a class that contains the largest range of geomagnetic disturbances in either of the two horizontal components during a 3-hour UT interval (Figure 1). Note that these limits may vary from one observatory to another since they depend on the corrected geomagnetic latitude of the observatory (Menvielle & Berthelier, 1991; Menvielle et al., 2011). In this study the two considered magnetic observatories, Ottawa (OTT) and Port-aux-Français (PAF), get a comparable absolute corrected geomagnetic latitude (OTT: 58.9°N; PAF: 58.8°S) and thus have the same classes of ranges (see Table 1).
K indices 0 1 2 3 4 5 6 7 8 9
Range (nT) 0 7.5 15 30 60 105 180 300 495 750 < 750
Table 1. Classes of ranges and corresponding K indices in OTT and PAF
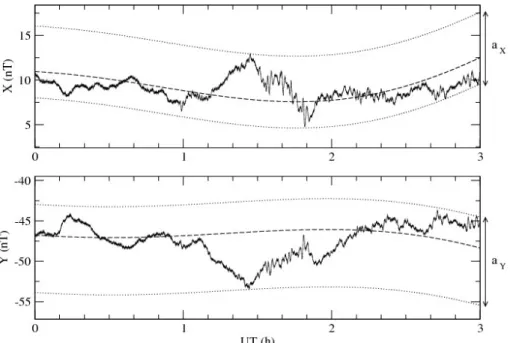
Figure 1. K index determination for the 0000-0300 UT three hour interval on 2010, April 11th at the PAF observatory. For both X and Y components, the dashed line represents the estimated SR variation, and the upper and lower dotted
lines correspond to the SR curve shifted respectively up to the maximum and down to the minimum of the observed
magnetic field deviation from the SR baseline; aX and aY (respectively equal to 7.5 and 9.8 nT) correspond to the three
hour ranges from which the K index is derived (K = 1 in this example).
The original definition of K indices (Bartels et al., 1939) requires hand scaling on analogue magnetograms. The question of the derivation of geomagnetic indices from digital data arose at the end of the seventies. Different algorithms enabling computer derivation of K indices were then developed and carefully assessed in the frame of an international comparison organised by the IAGA Working Group “Geomagnetic indices” (Coles & Menvielle, 1991; Menvielle, 1991). The reader is referred to Menvielle et al. (1995) for a complete review.
Basically, these algorithms estimate the SR variation from the magnetograms. The geomagnetic disturbances, from which the K indices are computed, are derived as the difference between the observed variations and the computer estimated SR ones. In the present study work, we use the so-called FMI algorithm (FMI for “Finnish Meteorological Institute”) (Sucksdorff et al., 1991). Figure 2 shows an example of SR and K determination by the FMI algorithm for a moderately disturbed day (2010, April 12th, 2010; Am = 30 nT) at the PAF observatory.
Figure 2. Magnetograms (minute values) of the horizontal components of the magnetic field recorded at the PAF
observatory during a moderately disturbed magnetic day (April 12th, 2010; Am = 30 nT). Variometer recordings: solid curves; SR : dashed curves; K indices: grey histograms.
3 DATA
The 1Hz data acquisition system at the PAF observatory was installed in March 2008. It consists of an internal digitization at a 10 Hz sampling rate of the variometer measurements. The obtained data series is then automatically filtered and rounded to the nearest second through an adapted INTERMAGNET Gaussian filter (Fotzé et al., 2007). In the present work, we considered the 1-second data produced by the acquisition system and the classical 1-minute data time series computed from 1 Hz data strictly using the INTERMAGNET Gaussian filter as described in the INTERMAGNET Technical Reference Manual (2008). Two years (2008, July 14th to 2010, July 13th) of 1-second recordings of the X (Geographic North) and Y (Geographic East) horizontal components are used. Our data set corresponds to a 2-year period during the deep solar minimum that occurred between solar cycles #23 and #24. During this period, the geomagnetic activity was very low, with a mean value of the am index equal to 8.6 nT.
The dataset used by Niblett et al. corresponds to a 1-year period (1982) just after the maximum of solar cycle #21, which was the second largest of the 20th century, from the point of view of the Wolf number. During this period, the geomagnetic activity was intense, with a mean value of the am index equal to 34.3 nT.
4 COMPARISON BETWEEN K FROM 1-SECOND AND 1-MINUTE VALUES
In the following, let K60s and K1s denote the K values derived using the 1-minute and 1-second sampling interval magnetograms, respectively.
K60s and K1s values corresponding to the same 3-hour interval might be different if the magnetic variations have energies in the frequency range between 1/2 and 1/120 Hz, which are the corresponding Nyquist frequencies respectively for the 1-second and 1-minute sampling rates.
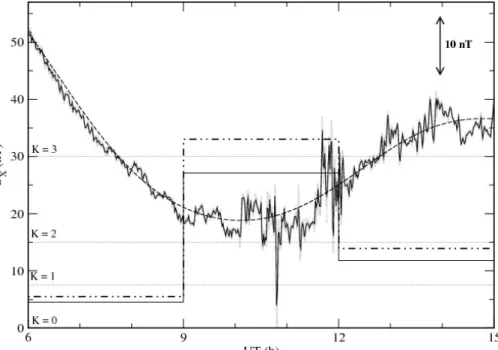
Visual inspection of magnetograms shows that this is clearly the case during periods of geomagnetic activity. Figure 3 presents an example for which aX is underestimated when calculated from the 1-minute data time series. In this case, this leads to a one unit underestimation of the X component corresponding K value for the 0900-1200 interval: K=2 (1-minute values) instead of K=3 (1-second values).
Figure 3. Magnetograms of the North component of the magnetic field at PAF (October 04th, 2009) during three consecutive UT 3-hour intervals. The difference between the 1-minute values magnetogram (solid black curve) and the 1-second values one (solid grey curve) results in a systematic underestimation of the aX 3-hour ranges (1-minute values:
solid step function; 1-second: dot-dashed step function). The up down double arrow indicates the scale, in nT, of the magnetograms.
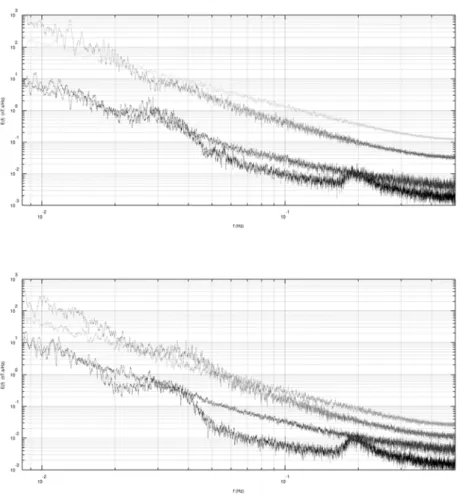
In order to get quantitative information on the energy contained in the range 1/2 and 1/120 Hz between quiet and disturbed periods, the energy density spectrum E(f) was calculated for four different magnetic conditions (Figure 4): very quiet (Am = 4 nT), quiet (Am = 15 nT), moderately disturbed (Am = 30 nT), and disturbed magnetic situations (Am = 64 nT). The results make clear that the level of the energy in the 1/2 to 1/120 Hz frequency range is significant except during very quiet periods. This suggests that downward bias might occur for most of the 3-hour interval.
Figure 4. Energy Density Spectrum for four different magnetic conditions on the X (upper panel) and Y (lower panel)
components of the magnetic field at PAF. From black upwards to the lighter grey curve: very quiet magnetic conditions (April 13th, 2010; Am = 4 nT), quiet (March 10th, 2010; Am = 15 nT; black curve); moderately disturbed (April 12th, 2010; Am = 30 nT), and disturbed (April 5th, 2010; Am = 64 nT)
4.1 Effect of the sampling interval on the K index
The comparison between K60s and K1s values shows that K60s is underestimated (K60s(t) = K1s(t) - 1) for 12% of the intervals. Figure 5 shows that the higher percentage of dissimilarity is observed for lower K values: 98% of the intervals for which K60s K1s corresponds to K60s < 2.
Figure 5. Distribution in percentage of the K60s values (computed using the 1-minute data) for those of the 3-hour intervals for which the K60s value is different from (and smaller than) the K1s one (690 intervals, solid curve) and for all
The energy for frequencies higher than 1/300 Hz is essentially driven by magnetic pulsations. Even if magnetic pulsations may range from tenths of nT to tens of nT, the amplitudes of the related oscillations remain of the order of a few nT (especially during the selected period of low and moderate geomagnetic activity). Such amplitudes correspond to a fraction of the class of ranges that decreases with increasing K values. This part is large for low K values (K= 0 or
K=1) whereas it is very small for high K values.
This argument concurs with that of Niblett et al. (1984) who explained that “the lower K levels (...) contain much of the
low energy pulsational activity with periods of 5 minutes or less”.
4.2 Diurnal and seasonal dependence of the sampling rate effect
Niblett et al. (1984) investigated for the OTT observatory the diurnal and seasonal distribution of the intervals for which
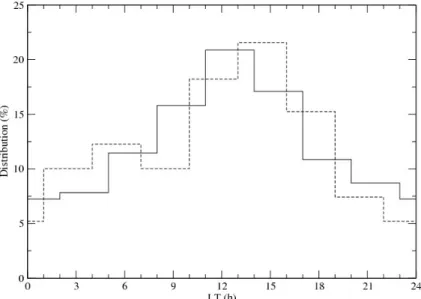
KA and KR have different values. Their results illustrate the intervals for which K60s K1s shows a local time (LT) dependency. We made a similar study for PAF observatory, with K1s and K60s. Figure 6 presents the diurnal LT distribution of discrepant K for both observatories. For each station, a clear maximum appears around 1300 LT, just after the solar maximum irradiance. The secondary maximum observed in the OTT data is not observed in the PAF data.
Figure 6. Diurnal distribution of intervals for discrepant K as a function of LT. The dashed curves correspond to KA
and KR for OTT in 1982 (from Niblett et al., 1984; LT = UT - 5h); the solid curve corresponds to K1s and K60s for PAF
in 2008.5-2010.5 (this study; LT = UT + 5h).
Figure 7. Monthly distribution of intervals of discrepant K as a function of the seasons. The dashed curves correspond
to KA and KR for OTT in 1982 (from Niblett et al., 1984; LT + 6 months); the solid curve corresponds to K1s and K60s
for PAF in 2008.5-2010.5 (this study). LWS means “Local Winter Solstice, and LSS means “Local Summer Solstice”. Data Science Journal, Volume 10, 30 August 2011
Figure 7 presents the seasonal distribution of discrepant K for both observatories. To take into account the latitudinal difference between the two stations, the histograms from Niblett et al. (1984) was shifted by 6 months.
The OTT distribution of discrepant K has a clear maximum around each equinox. The PAF distribution has not such a sharp maximum even if two smaller bumps, each centered on an equinox, may be noticed. Niblett et al. interpreted the OTT distribution as the consequence of the seasonal modulation of the pulsations. Since the intensity of the pulsations also varies jointly with the solar cycle, the seasonal modulation is expected to be weaker during the solar minimum than during the solar maximum, as observed in this study.
5 CONCLUSION
The present work shows that the K60s are biased downward with respect to K1s by one level in about 12% of the intervals. 98% of these low values occurred at the K = 0, 1, 2 levels. These results concur with those already obtained by Niblett et al. (1984), keeping in mind the large difference in geomagnetic activity level between the two considered datasets. Basically, the downward bias leads to an underestimation of the magnetic activity during magnetic quietness while it has very limited effect during a disturbed period.
On the one hand, the bias was observed when rapid geomagnetic fluctuations with periods less than about 200s occurred because these variations are severely attenuated in 1-minute data. A more precise determination of the periods responsible for the bias would require studying data series with various sampling intervals in the range of 1s to 60s. On the other hand, the diurnal and seasonal distributions of discrepant K intervals do not act in synchrony with the solar cycle. The dependency remains to be investigated.
6 REFERENCES
Bartels, J., Heck, N. H., & Johnston, H. F. (1939) The three-hour-range index measuring geomagnetic activity. Terr.
Magn. Atmos. Electr., 44(4), 411-454, doi: 10.1029/TE044i004p00411.
Bitterly, M., Menvielle, M., Bitterly, J. & Berthelier, A. (1997) A comparison between computer derived (FMI method) and hand-scaled K indices at Port-aux-français and Port Alfred French observatories. In Proceedings of the VIth
International workshop on geomagnetic instruments, data acquisition and processing, J. Rasson Ed., Académie Royale
de Belgique, Bruxelles, 136-143.
Coles, R. & Menvielle, M. (1991) Some thoughts concerning new digital magnetic indices. Geophys. Trans., 36, 303-312.
INTERMAGNET Operations Committee and INTERMAGNET, Executive Council, INTERMAGNET Technical Reference Manual, Version 4.4. INTERMAGNET, c/o British Geological Survey, Murchison House, West Mains Road, Edinburgh EH9 3LA, UK, Ed. by: Benoît St-Louis, 2008. Retrieved from the World Wide Web, April 15, 2011:
http://www.intermagnet.org/publications/im_manual.pdf
Fotzé, M., Chambodut, A., Bernard, A., & Schott, J.J. (2007) New acquisition systems in French austral magnetic observatories. Oral presentation, IUGG XXIV General Assembly, July 2-13 2007, Perugia, Italy.
Menvielle, M. (1991) Evaluation of algorithms for computer production of k indices. Geophysical Transactions, 36, 313-320.
Menvielle, M. & Berthelier, A. (1991) The K-derived planetary indices: description and availability. Reviews Geophys.
Space Phys., 29, 415-432.
Menvielle, M., Papitashvili, N.E., Häkkinen, L., & Sucksdorf, C. (1995) Computer production of K indices: review and comparison of methods. Geophys. J. Int., 123(3), 866-886, doi: 10.1111/j.1365-246X.1995.tb06895.x.
Menvielle, M., Iyemori, T., Marchaudon, A., & Nose, M. (2011) Geomagnetic Observations and Models in M. Mandea, M. Korte (eds.), Geomagnetic Observations and Models, IAGA Special Sopron Book Series 5, DOI 10.1007/978-90-481-9858-0_8, Springer.
Niblett, E. R., Loomer, E. I., Coles, R. L. & Jansen Van Beek, G. (1984) Derivation of K-indices using magnetograms constructed from digital data. Geophysical surveys, 6(3-4), 431-437, ISSN 0046-5763. doi: 10.1007/BF01465558. Sucksdorf, C., Pirjola, R., & Häkkinen, L. (1991) Computer production of K-indices based on linear elimination.