HAL Id: insu-01247513
https://hal-insu.archives-ouvertes.fr/insu-01247513
Submitted on 5 Feb 2016
HAL is a multi-disciplinary open access
archive for the deposit and dissemination of
sci-entific research documents, whether they are
pub-lished or not. The documents may come from
teaching and research institutions in France or
abroad, or from public or private research centers.
L’archive ouverte pluridisciplinaire HAL, est
destinée au dépôt et à la diffusion de documents
scientifiques de niveau recherche, publiés ou non,
émanant des établissements d’enseignement et de
recherche français ou étrangers, des laboratoires
publics ou privés.
Inferring field-scale properties of a fractured aquifer
from ground surface deformation during a well test
Jonathan Schuite, Laurent Longuevergne, Olivier Bour, Frédéric Boudin,
Stéphane Durand, Nicolas Lavenant
To cite this version:
Jonathan Schuite, Laurent Longuevergne, Olivier Bour, Frédéric Boudin, Stéphane Durand, et al..
Inferring field-scale properties of a fractured aquifer from ground surface deformation during a well
test. Geophysical Research Letters, American Geophysical Union, 2015, 42 (24), pp.10696-10703
�10.1002/2015GL066387�. �insu-01247513�
Inferring field-scale properties of a fractured aquifer
from ground surface deformation during a well test
Jonathan Schuite1, Laurent Longuevergne1, Olivier Bour1, Frédérick Boudin2, Stéphane Durand3,
and Nicolas Lavenant1
1Géosciences Rennes, UMR-CNRS 6118, Université de Rennes 1, Rennes, France,2Laboratoire de Géologie, UMR-CNRS
8538, Ecole Normale Supérieure, Paris, France,3Laboratoire Géomatique et Foncier (GeF/Cnam), Le Mans, France
Abstract
Fractured aquifers which bear valuable water resources are often difficult to characterize with classical hydrogeological tools due to their intrinsic heterogeneities. Here we implement ground surface deformation tools (tiltmetry and optical leveling) to monitor groundwater pressure changes induced by a classical hydraulic test at the Ploemeur observatory. By jointly analyzing complementary time constraining data (tilt) and spatially constraining data (vertical displacement), our results strongly suggest that the use of these surface deformation observations allows for estimating storativity and structural properties (dip, root depth, and lateral extension) of a large hydraulically active fracture, in good agreement with previous studies. Hence, we demonstrate that ground surface deformation is a useful addition to traditional hydrogeological techniques and opens possibilities for characterizing important large-scale properties of fractured aquifers with short-term well tests as a controlled forcing.1. Introduction
Crystalline aquifers can hold valuable water resources. However, the conductive and capacitive features of these reservoirs are faults and fracture networks where groundwater flow is strongly channelized, which makes targeting of productive zones challenging [Bense et al., 2013]. Hence, a sustained and sound exploita-tion of such water stocks largely depends on the knowledge of the aquifers’ structure. Imaging main flow pathways and assessing storage properties in heterogeneous reservoirs is not straightforward but may be obtained from various hydrogeophysical experiments like single- and cross-borehole hydraulic tests [Illman
et al., 2009; Le Borgne et al., 2006] or single-hole ground penetrating radar [Dorn et al., 2013], often integrated
in sophisticated inversion schemes in 2-D or 3-D [Klepikova et al., 2013; Zhu and Yeh, 2005]. Nonetheless, these methods rely on the presence beforehand of more than one open borehole that intersect connected fractures; they can be invasive (in particular hydraulic tomography methods) and may require the use of pneumatic isolation that is sometimes impossible. More generally, such techniques reach their limits when the scale of investigation goes beyond several tens of meters.
Surface deformation due to fluid pressure variations in geological media has been studied in many ways and with a broad range of geodetic methods. Indeed, coupling fluid dynamics and deformation measurements offer a far-reaching insight of reservoirs’ structural and hydromechanical properties under the unifying frame-work and concepts of poroelasticity [Biot, 1941; Wang, 2000]. For instance, Global Positioning Systems (GPS) or interferometric synthetic aperture radars were proven useful to map surface deformation associated to fluid pressure changes in geological bodies [Beauducel and Cornet, 1999; Bonforte and Guglielmino, 2015; Burbey, 2008; Galloway and Hoffmann, 2007; Moreau and Dauteuil, 2013; Verdon et al., 2013] and to estimate their stor-age properties [Burbey, 2003]. Nevertheless, these absolute methods can be limiting if deformation signals are inframillimetric, if the aim is to capture phenomena occurring at daily or shorter timescales in stiff media, or if they are located in densely vegetalized areas.
In contrast, relative deformation instruments like tiltmeters and strainmeters were introduced in an innovative way to apprehend both short- and long-term subsurface flow phenomena, first in volcanology where the signal is strong due to large inflating cavities [Dzurisin, 2007] and later in hydrogeology thanks to technical improvement of these instruments [Boudin et al., 2008; Hisz et al., 2013]. In particular, much effort has been dedicated into assessing how they can be used to characterize properties of groundwater flow, whether fluxes
RESEARCH LETTER
10.1002/2015GL066387
Key Points:
• Implementing ground geodetic observations to monitor and characterize heterogeneous reservoirs • Field-scale fracture properties from a
single short-timescale experiment • High complementarity between local
and distributed deformation data to image faulted aquifers
Supporting Information: • Text S1 and Figure S1
Correspondence to: J. Schuite,
Citation:
Schuite, J., L. Longuevergne, O. Bour, F. Boudin, S. Durand, and N. Lavenant (2015), Inferring field-scale properties of a fractured aquifer from ground surface deformation during a well test,
Geophys. Res. Lett., 42, 10,696–10,703,
doi:10.1002/2015GL066387.
Received 29 SEP 2015 Accepted 9 DEC 2015
Accepted article online 14 DEC 2015 Published online 28 DEC 2015
©2015. American Geophysical Union. All Rights Reserved.
Geophysical Research Letters
10.1002/2015GL066387
Figure 1. The Ploemeur experimental field. Lower inset: Geographic location; upper inset: direction of maximum deformation through time recorded at the long baseline tiltmeter station (LB1). This station consists of two nearly orthogonal hydrostatic tiltmeters installed in an underground bunker and attached to the granitic bedrock. The LB1 tiltmeters are here represented by the white stripes. Central image: satellite image and isocontour lines of kriged vertical deformation, given in millimeters. The associated error for vertical displacements varies from 1.0 to 1.5 mm across the field. The smallest errors are located along the A-B profile. All white crosses are the node points where leveling measurements were performed. Many of these points coincide with the location of wells, among which the three pumping wells (PE, F31, and F29) and other monitored wells (F32, F35, and F19). Well F30, located at a few hundreds of meters west from the pumping site, was used as the nonmoving reference point for the least squares adjustment of the optical leveling data.
are man driven [Chen et al., 2010; Barbour and Wyatt, 2014; Fabian and Kümpel, 2003] or natural [Braitenberg, 1999; Jahr et al., 2009]. Furthermore, tiltmeters are very efficient when it comes to capture transient responses to subsurface progressive pressure variation, which is a convenient way to spot productive zones without having the need for supplementary boreholes [Vasco et al., 2001]. Longuevergne et al. [2009] showed that tilt measurements at the surface are sensitive to the dip and root depth of a pressurized fracture taken as a plane and therefore may provide valuable information on reservoir’s structural features. Nonetheless, describing the behavior and properties of large conductive objects buried in stiff media from deformation monitoring at short timescales is an issue that has been rarely tackled in hydrogeology.
In this study, we address the large spatial scale versus short-timescale problem in the field of hydrogeodesy. We present the results of an experiment where we combined two different surface deformation tools to monitor the response of a fractured hard-rock aquifer perturbed by a hydraulic load. By coupling these two geodetic methods, namely, tiltmetry and optical leveling, we show how powerful the use of surface defor-mation data can be to assess the geometry and storage properties of a major hydraulically active fault, even when the hydraulic perturbation is produced during only a few hours.
2. The Ploemeur Site, Experimental Setup, and Data
2.1. Study Site
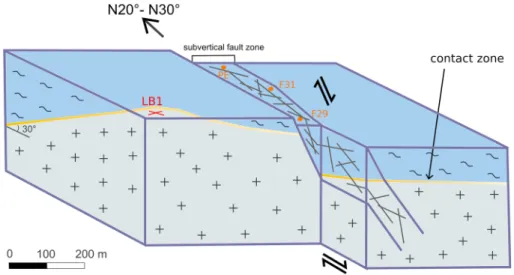
The Ploemeur pumping site and observatory (Figure 1) has been thoroughly studied since the mid-1990s and therefore constitutes an interesting experimental site to design innovative characterization tools and meth-ods. The hydrogeological system emerges from two main tectonic structures (Figure 2): a mylonitized contact zone between a mica-schist unit overlying a granitic rock unit, which dips gently toward the north and an
Figure 2. Structural sketch of the Ploemeur aquifer system. Two main conductive structures shape the reservoir: the contact zone between granite (cross) and mica-schist (tilde), and a subvertical normal fault zone with dextral strike-slip component. Modified after Ruelleu et al. [2010].
associated dextral-slip normal fault zone with estimated strike around N30∘E and dipping more steeply toward the south. Based on structural interpretations and geophysical studies [Ruelleu et al., 2010], it is believed that these structures intercept one another, resulting in a one-of-a-kind crystalline aquifer configu-ration with an outstanding productivity (106m3per year since 1991). Indeed, the deeper gently north dipping
structure is thought to be responsible for the large extension of the aquifer and allows for draining vast areas where recharge can occur [Leray et al., 2012, 2013]. Conversely, the subvertical fault zone might only drain local areas in the vicinity of its roof, but it plays an important role in the vertical ascension of water fluxes allowing for fairly good withdrawal rates in such a geological context. The three pumping wells are established along this subvertical fracture zone (Figure 2). A confined aquifer model suits best this system based on different hydraulic and geophysical observations [Jiménez-Martínez et al., 2013; Le Borgne et al., 2006; Leray et al., 2012].
2.2. Experiment
For the purpose of the experiment, the three pumps were shut down after 8 days of stable withdrawal rates of 128 m3/h which ensured stationary pressure conditions at the site scale. Then after 39 h of recovery, the three
pumps were reengaged one after the other every 2 h, establishing a total extraction rate of 134 m3/h which
was kept for a few days after the experiment. This recovery test was monitored in terms of piezometric head in several boreholes by pressure transducers and in terms of surface deformation by two silica long baseline tiltmeters (LBT).
The specifics of the long baseline tiltmeters can be found in details in the paper by Boudin et al. [2008]. A pair of these instruments were installed a few months before the experiment in a shallow underground bunker inherited from the Second World War, providing a sheltered and stable environment essential for acquiring high-quality measurements [Agnew, 1986]. The first one is 32.8 m long and is oriented N75∘E (WE instrument). The second has been positioned along a N328∘E direction (NS instrument) and is 7.75 m long (Figure 1). They were both carefully attached to the granitic bedrock with silica plates and pins, in order to optimize coupling between the instruments and the rock body. This is to ensure that tiltmeters actually measure a deformation signal proper to the rock formation. We sampled tilt data every 30 s. In order to assess our instruments’ preci-sion, we analyzed the white noise in their signal and found a standard deviation inferior to 10−9radian which
makes our set of LBT outstandingly accurate in agreement with Boudin et al. [2008]. Additionally, orthometric height differences were measured using an automatic Leica NA2 optical level, in three leveling loops over 42 node points throughout the site, in order to map the relative vertical deformation that occurred between the initial state (before pumps were turned off ) and the maximum pressure state (just before pumps were restarted).
It is noteworthy to indicate that GPS stations, two absolute gravimeters, and several relative gravimeters were also used to monitor the experiment on top of the subvertical fault zone. The gravimetric survey did not detect
Geophysical Research Letters
10.1002/2015GL066387
any significant mass variation within the substratum, confirming the confined behavior of the aquifer. GPS data are dealt with in a paper by Moreau and Dauteuil [2013] and will be discussed along with our results.
2.3. Data Processing and Modeling
Tilt time series include the signal generated by earth tides and oceanic tides, which are of no interest in our analysis. Hence, most of the earth tide signal has been filtered out of the tilt series using a suitable tide wave modeling toolbox (T_TIDE) [Pawlowicz et al., 2002].
Vertical displacement measurements from the optical leveling campaign were adjusted with the least squares method, using point F30, located outside the deformation area, as a reference point with fixed orthometric height. A posteriori accuracy for the adjusted heights varies from 1 to 1.5 mm, depending of their localization in the network. Kriging is used for spatial interpolation.
As for the modeling of the deformation data, we aimed at keeping a rather uncomplicated description of the system, firstly, to highlight the value of ground surface deformation methods for characterizing an idealized fractured aquifer during short experiments and secondly, to avoid numerical modeling techniques that entail the full poromechanical coupling but require more computer power, finer definitions for boundary condi-tions and detailed a priori knowledge about the system (Young’s modulus, permeability, porosity, etc.) that we might lack. Assuming that the hydraulic loading occurs mainly in the subvertical fault zone and that pure elastic effects dominate on deformation processes at field scale, we used a simple model built from Okada’s analytical solution in order to analyze transient maximum tilt response and net vertical displacement [Okada, 1985]. By “maximum tilt,” we mean the tilt measured perpendicularly to the fault zone (i.e., N30∘). The original model of Okada gives an exact solution of surface deformation caused by the tensile dislocation of a rectangu-lar plane in a homogeneous elastic half-space, taking into account four geometrical parameters (plane upper edge’s depth F, width LX, length LR, and dip𝛼) and one mechanical parameter (Poisson’s ratio). Employing this framework which is commonly used in volcanology (see, for instance, Bonaccorso [1998] and Bonforte and
Guglielmino [2015]), we developed and applied a straightforward routine to investigate the set of geometrical
and hydromechanical parameters that explains best our data. In order to do so, we implemented the original Okada model in a procedure that suited our needs. For detailed information about our Okada-based model, the reader is referred to the supporting information Text S1.
Note that the above hypothesis might indeed be more valid when analyzing the early stage of the experiment, considering the high transmissivity ratio between the fault zone and surrounding media (about 102to 103,
see Le Borgne et al. [2006]). Consequently, we chose to model the transient tilt only for the first hour of the test in order to keep a coherent quality between high-precision data and simulated response. On the other hand, we simply modeled vertical displacements according to the final state of piezometric head after 39 h, even if the elastic hypothesis is more questionable. Discarding pressure diffusion in the secondary fracture network and rock matrix for late times signifies that we ignore poroelastic deformation [Wang, 2000]. Hence, with an elastic deformation model we expect to overestimate vertical displacements at the end of the experiment. We suppose that this effect is not critical to interpret leveling data which are, although informative, less accurate than tilt.
We used a simple Monte Carlo sampling of a million iterations to estimate both geometrical parameters of the fault zone (dip𝛼, root length LR, and lateral extension LX) and its storativity (S) from ground surface defor-mation and piezometric measurements (see supporting infordefor-mation Text S1). Table 1 provides a summary of all parameters with explored ranges or fixed values, corresponding to what we know or expect for our system based on available data and previous studies.
We assessed each forward model’s efficiency by computing the root-mean-square error (RMSE). A model was considered acceptable (i.e., was not rejected) if and only if (1) RMSE for tilt was below 0.005 μrad (5 times the noise level) and (2) RMSE for vertical deformation was below 1.5 mm (maximum measurement error obtained across the field). Thus, we choose to use a higher constraint of the model by tilt data rather than by vertical displacement data because of the higher uncertainty associated to the latter, as discussed earlier. In other words, we impose that each acceptable model matches the transient tilt data closely but we use vertical dis-placement data only as a safeguard: we verify that when the consistency with tilt observation is achieved for a given forward model, it also honors the order of magnitude—and overall shape—of the observed deformation profile along A-B.
Table 1. Parameter Values or Ranges Used to Run the Okada-Based Model and Parameter Values for Accepted Models (With Root-Mean-Square Error (RMSE) Over Tilt Data Inferior to 5 nrad and RMSE for Vertical Displacement Profile Lower Than 1.5 mm) and for the Best Fitting Model for Tilt T1
Parameter Description Range Tested or Value Accepted Models Average (Stda) T1
𝛼(deg) Fault plane dip angle [45; 90] 54.4 (5.2) 50.6
LR(m) Fault plane length in dip direction [30; 1000] 83 (34) 51
LX(m) Fault plane final length in strike direction [100; 1000] 715 (144) 704
S Fault zone’s storativity [5 × 10⁻⁵;5 × 10⁻³]b 8.1 × 10⁻⁴(2.4 × 10⁻⁴) 7.3 × 10⁻⁴
F(m) Thickness of confining layer 30c
W(m) Fault zone’s width 50
𝜈 Poisson’s ratio 0.27d
aStandard deviation.
bEmbraces widely the range found by Le Borgne et al. [2006] for long-term pumping tests across the field. cMean thickness of weathered layer observed in boreholes across the field.
dEstimated from borehole seismic experiments.
3. Results and Discussion
3.1. Ground Surface Deformation
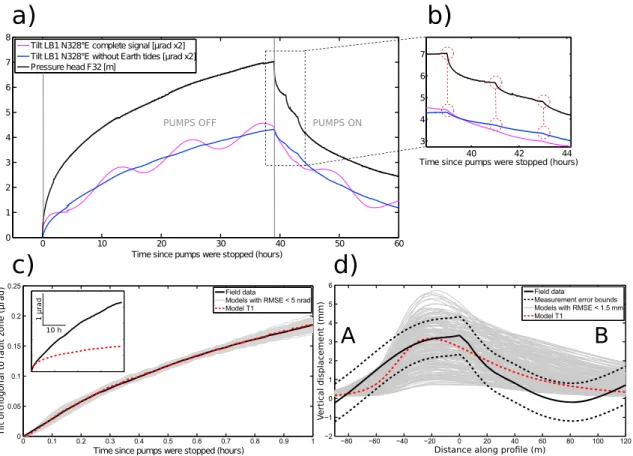
Figure 3a displays the time response of both piezometric head in F32 and surface tilt during the experiment. As a convention, we set that tilt is increasing toward the north and the west. The two long baseline tiltmeters react both almost instantaneously to pressure changes in the fracture, and tilt deformation is strongly correlated to the transient pattern of pressure head. Even the three step reengagement of the pumps is clearly captured by tilt records (Figure 3b).
Having a nearly orthogonal pair of tiltmeters at LB1 station enables us to follow the direction of the defor-mation plane formed by the instruments’ bases. The evolution in time of this defordefor-mation plane can be appreciated through the successive coordinates of its normal vector. Displaying this vector’s spherical coordi-nates in a polar diagram (Figure 1), we observe that deformation at station LB1 follows a direction orthogonal to—and away from—the subvertical fault zone, as pressure increases in the fracture right after pumps are stopped. In other words, immediately after the hydraulic perturbation is initiated, LB1 station as a whole is forced to tilt away from a location in between boreholes F35 and F29, whereas pumping wells are all located northwards from that position. This is coherent with the physical understanding we have of a such a system: when pressure increases in the fracture, its walls experience a slight normal displacement, and therefore, vertical displacement at the surface has a maximum variation in a direction perpendicular to the fault’s strike and minimal along it. As tiltmeters measure a local gradient of vertical displacement, this phenomenon is plainly perceived at station LB1.
A couple of hours later, the tilt shifts slightly more toward the west, possibly revealing that the pressure front extends preferentially toward the north and/or affects other compartments such as the low dip contact zone (Figure 1). Throughout the experiment, the total loading corresponding to a 7 m drawdown in F32 caused a total tilt of about 2.6 μrad at LB1 station, which is located at approximately 120 m from the fault zone. Besides, when pumping restarts, LB1 is tilting back toward the fracture but clearly follows a different path. Hence, this underscores the high sensitivity of tilt to both pressure and structural features. The form and amplitude of the transient tilt records demonstrate the potential for these instruments to monitor hydraulic processes, and the directional information integrated in a dual tilt station shows their potential to discern the geometry of heterogeneous media. Furthermore, tilt measurements are also capable of distinguishing complex nonlin-ear mechanical behaviors in the functioning of this aquifer under cycles of pressure loading and unloading (hysteresis).
The contour lines of total vertical displacement obtained from the optical leveling method show an elongated uplift shape along the damaged zone (Figure 1), with a 1 to 3 mm amplitude in agreement with GPS data [Moreau and Dauteuil, 2013]. These complementary measurements allow for mapping the major hydraulic discontinuity and estimate its strike orientation (≈ N30∘E), which correlates well with those inferred from tilt measurements. These observations also confirm that the subvertical fault, when pressurized, is responsible
Geophysical Research Letters
10.1002/2015GL066387
Figure 3. (a) Tilt data of the N328∘E LB1 instrument and relative pressure head data from borehole F32 throughout the experiment (t = 0corresponds to the moment when pumps are stopped). Tilt data is exaggerated by a factor 2. (b) Enlargement of the period when stepwise reengagement of the three pumps occurs; ground surface deformation data and Okada-based modeling results (accepted models are those satisfying the following criteria: RMSE tilt<5 nrad and RMSE vertical displacement<1.5 mm); (c) maximum tilt versus time and (d) vertical deformation along A-B profile at the end of the experiment (profile on Figure 1). The forward model T1 is the one that reproduces best tilt data.
for most of the recorded deformation signal. Consequently, this supported the choice of adopting a model taking only into account elastic deformation due to a single fault plane.
3.2. Modeling Results
We found that only 0.02% of the initial 1 million parameter sets tested with our Okada-based model were not rejected given the criteria mentioned above (cf. section 2.3). The accepted forward models fit deformation data very well given the simplicity and assumptions inherent to our modeling framework (Figures 3c and 3d). Transient tilt data are especially well described by all accepted models during the first hour. Conversely, the overall shape of the vertical displacement profile is not optimally reproduced by most of these models, in par-ticular for the convex part between 50 and 120 m, which is most likely due to local heterogeneity effects that are completely discarded in the model. Nevertheless, most modeled A-B profiles give a good order of mag-nitude of vertical displacement which is already satisfactory given the low signal-to-noise ratio we expect as regards optical leveling methods for such small amplitudes of deformation. In other words, even if we put more confidence into our tilt measurements and even if we force the forward models to match them quite closely, using vertical displacement data as a complementary constraint is very helpful to discriminate models that may well satisfy tilt observations but provide implausible amplitude and spatial distribution of the pressure induced uplift of ground surface. Hence, the valuable complementarity between the two geodetic methods arises especially because of the interplay of a strong time constraining measurement (tilt) and a more spatially constraining measurement (leveling). In this particular case where continuous data from a very accu-rate geodetic instrument are collected locally during a short-lasting hydraulic experiment, a less precise but spatially informative geodetic method is still of high interest when it comes to seize the field-scale behavior of a fractured reservoir. In addition, we observe that the best fitting model for tilt (model T1) captures reasonably well the vertical deformation profile and falls within its measurement error bounds, supporting the reliability of the data inversion results. For late times, note that the modeled tilt is largely underestimated which confirms
that the pure elastic deformation framework becomes unsatisfactory to describe the mechanical behavior of the system (inset in Figure 3c).
Looking at the associated parameter sets (not shown here), we noticed that models with a deep fault root (LR>150 m) and high dip angle (𝛼 >70∘) were systematically rejected. There is only little complementary information on the structure of this aquifer system that could help us compare our inversion results. From a geological perspective, the subvertical fault zone has a normal component, and therefore, we could expect it to dip around 60∘ which makes our calculated dip a fair estimate. The inferred active depth is more difficult to validate, but this highlights the value of deformation methods to characterize fractured media. The model T1 is obtained for a relatively shallow fault root (LR = 51 m which means that the fault is hydraulically active until ∼70 m under ground surface) and low dip angle (𝛼 = 51∘), Table 1. Note that the computed fault opening for T1 is 1.7 mm after 1 h and 7.5 mm after 39 h.
Furthermore, the modeling results suggest that the hydromechanically reacting part of the fault has an extent of about 700 m within the first hour of the recovery test (Table 1). Although this might be an overestimation due to simplifications in the modeling procedure (namely, we suppose that the pressure is uniformly applied on the fracture’s walls), we can be confident in the order of magnitude because (1) we observe the first draw-down decrease in F19 about 35 min after pumps were stopped (at about 230 m SW from F32, Figure 1) and (2) by looking at the NE-SW elongation of vertical deformation map over the whole test, we infer that the reactive part of the fault stretches out at least 500 m (Figure 1). Finally, the accepted range of storativity (Table 1), from 3.4×10⁻⁴to 1.4×10⁻³, is equivalent to the one obtained from hydraulic tests [Le Borgne et al.,
2006]. Similarly, we estimated transmissivity from the diffusion length LX, T = 7.7 ± 4 ×10⁻³m2/s, which is
slightly overestimated in the same way as LX.
Undoubtedly, our results carry an uncertainty which is inherent to the modeling procedure (simplification of geometry, homogeneous media assumption, pressure distribution on fracture walls, etc.). However, even under all these simplistic assumptions, we are able to propose an ensemble of possible models which offer a consistent and valuable first-order description of the reservoir. In any case, regardless of the modeling results, the raw data are already sufficiently informative in order to capture the active fracture’s extension and orientation. Therefore, ground surface deformation methods may be a good alternative to conventional hydraulic testing methods in heterogeneous reservoirs when it comes to determining their geometrical and hydromechanical properties.
4. Conclusion
We presented the results of a hydraulic recovery test monitored in terms of ground surface deformation, through optical leveling and high-precision continuous tilt measurements. We show that temporal defor-mation data at short timescales, typically during well tests, clearly encompass infordefor-mation about a frac-tured aquifer’s field-scale geometry and hydromechanical functioning. The complementarity between these two geodetic measurements enables the characterization of a hydraulically active fault zone during a short-timescale experiment. Assuming a pure elastic behavior and using a simple analytical modeling framework, we demonstrated that ground surface deformation data show great potential for constraining geometrical and storage properties of a main subvertical fault zone.
Future work should include a more detailed investigation of such a system’s poroelastic response to short-term pressure loading, in order to assess whether ground surface deformation tools can be good complementary or self-sufficient tools in fault zone hydrology, especially for storage and hydraulic diffusivity estimations, as done analogously by Barbour and Wyatt [2014] from borehole strain data.
References
Agnew, D. C. (1986), Strainmeters and tiltmeters, Rev. Geophys., 24(3), 579–624.
Barbour, A. J., and F. K. Wyatt (2014), Modeling strain and pore pressure associated with fluid extraction: The Pathfinder Ranch experiment,
J. Geophys. Res. Solid Earth, 119, 5254–5273, doi:10.1002/2014JB011169.
Beauducel, F., and F. Cornet (1999), Collection and three-dimensional modeling of GPS and tilt data at Merapi volcano, Java, J. Geophys. Res.,
104(B1), 725–736.
Bense, V. F., T. Gleeson, S. E. Loveless, O. Bour, and J. Scibek (2013), Fault zone hydrogeology, Earth Sci. Rev., 127, 171–192. Biot, M. A. (1941), General theory of three-dimensional consolidation, J. App. Phys., 12(2), 155–164.
Bonaccorso, A. (1998), Evidence of a dyke-sheet intrusion at Stromboli Volcano inferred through continuous tilt, Geophys. Res. Lett., 25(22), 4225–4228.
Acknowledgments
This work is part of the French CRITEX project (Critical Zone Exploration Network), the ANR Hydrogeodesy project, and the ORE H+ observatory network from which it has been supported. J. Schuite’s PhD thesis is partly funded by the Brittany Region. F. Beauducel from IPGP (Paris, France) is warmly acknowledged for his MATLAB code of Okada’s model as well as for his helpful discussion. Tilt data are available upon request at http://hplus.ore.fr/. We warmly thank the Editor, M. Bayani Cardenas, as well as two anonymous reviewers for the thorough attention they granted to the critical reading of our paper which helped us improve its quality.
Geophysical Research Letters
10.1002/2015GL066387
Bonforte, A., and F. Guglielmino (2015), Very shallow dyke intrusion and potential slope failure imaged by ground deformation: The 28 December 2014 eruption on Mount Etna, Geophys. Res. Lett., 42, 2727–2733, doi:10.1002/2015GL063462.
Boudin, F., P. Bernard, L. Longuevergne, N. Florsch, C. Larmat, C. Courteille, P.-A. Blum, T. Vincent, and M. Kammentaler (2008), A silica long base tiltmeter with high stability and resolution, Rev. Sci. Instrum., 79(3), 34502, doi:10.1063/1.2829989.
Braitenberg, C. (1999), The hydrologic induced strain-tilt signal: A review, Bull. d’Inf Marées Terr., 131, 10,171–10,181.
Burbey, T. J. (2003), Use of time-subsidence data during pumping to characterize specific storage and hydraulic conductivity of semi-confining units, J. Hydrol., 281, 3–22.
Burbey, T. J. (2008), The influence of geologic structures on deformation due to ground water withdrawal, Ground Water, 46(2), 202–211. Chen, H. C., H.-J. Kümpel, and C. M. Krawczyk (2010), Field layout of a tiltmeter array to monitor micro-deformation induced by pumping
through a horizontal collector well, Near Surf. Geophys., 8, 321–330.
Dorn, C., N. Linde, T. Le Borgne, O. Bour, and J.-R. de Dreuzy (2013), Conditioning of stochastic 3-D fracture networks to hydrological and geophysical data, Adv. Water Resour., 62, 79–89.
Dzurisin, D. (2007), Volcano Deformation: Geodetic Monitoring Techniques, Springer-Praxis books in Geophys. Sci., Chichester, U. K. Fabian, M., and H.-J. Kümpel (2003), Poroelasticity: Observations of anomalous near surface tilt induced by ground water pumping,
J. Hydrol., 281, 187–205.
Galloway, D. L., and J. Hoffmann (2007), The application of satellite differential SAR interferometry-derived ground displacements in hydrogeology, Hydrogeol. J., 15(1), 133–154.
Hisz, D. B., J. C. Murdoch, and L. N. Germanovich (2013), A portable borehole extensometer and tiltmeter for characterizing aquifers,
Water Resour. Res., 49, 7900–7910, doi:10.1002/wrcr.20500.
Illman, W. A., X. Liu, S. Takeuchi, T.-C. J. Yeh, K. Ando, and H. Saegusa (2009), Hydraulic tomography in fractured granite: Mizunami Underground Research site, Japan, Water Resour. Res., 45, W01406, doi:10.1029/2007WR006715.
Jahr, T., G. Jentzsch, and L. Weise (2009), Natural and man-made induced hydrological signals detected by high resolution tilt observations at the Geodynamic Observatory Moxa/Germany, J. Geodyn., 48, 126–131.
Jiménez-Martínez, J., L. Longuevergne, T. Le Borgne, P. Davy, A. Russian, and O. Bour (2013), Temporal and spatial scaling of hydraulic response to recharge in fractured aquifers: Insights from a frequency domain analysis, Water Resour. Res., 49, 3007–3023, doi:10.1002/wrcr.20260.
Klepikova, M. V., T. Le Borgne, O. Bour, and J.-R. de Dreuzy (2013), Inverse modeling of flow tomography experiments in fractured media,
Water Resour. Res., 49, 7255–7265, doi:10.1002/2013WR013722.
Le Borgne, T., O. Bour, J.-R. de Dreuzy, P. Davy, and F. Touchard (2004), Equivalent mean flow models for fractured aquifers: Insights from a pumping tests scaling interpretation, Water Resour. Res., 40, W03512, doi:10.1029/2003WR002436.
Le Borgne, T., O. Bour, F. L. Paillet, and J.-P. Caudal (2006), Assessment of preferential flow path connectivity and hydraulic properties at single-borehole and cross-borehole scales in a fractured aquifer, J. Hydrol., 328, 347–359.
Leray, S., J.-R. de Dreuzy, O. Bour, T. Labasque, and L. Aquilina (2012), Contribution of age data to the characterization of complex aquifers,
J. Hydrol., 464-465, 54–68.
Leray, S., J.-R. de Dreuzy, O. Bour, and E. Bresciani (2013), Numerical modeling of the productivity of vertical to shallowly dipping fractured zones in crystalline rocks, J. Hydrol., 481, 64–75.
Longuevergne, L., N. Florsch, F. Boudin, L. Oudin, and C. Camerlynck (2009), Tilt and strain deformation induced by hydrologically active natural fractures: Application to the tiltmeters installed in Sainte-Croix-aux-Mines observatory (France), Geophys. J. Int., 178, 667–677. Moreau, F., and O. Dauteuil (2013), Geodetic tools for hydrogeological surveys: 3D-displacements above a fractured aquifer from GPS time
series, Eng. Geol., 152, 1–9.
Okada, Y. (1985), Surface deformation due to shear and tensile faults in a half-space, Bull. Seismol. Soc. Am., 75(4), 1135–1154.
Pawlowicz, F., B. Beardsley, and S. Lentz (2002), Classical tidal harmonic analysis including error estimates in MATLAB using T_TIDE, Comput.
Geosci., 28, 929–937.
Ruelleu, S., F. Moreau, O. Bour, D. Gapais, and G. Martelet (2010), Impact of gently dipping discontinuities on basement aquifer recharge: An example from Ploemeur (Brittany, France), J. App. Geophys., 70, 161–168.
Vasco, D. W., K. Karasaki, and K. Kishida (2001), A coupled inversion of pressure and surface displacement, Water Resour. Res., 37(12), 3071–3089.
Verdon, J. P., J.-M. Kendall, A. L. Stork, R. A. Chadwick, D. J. White, and R. C. Bissell (2013), Comparison of geomechanical deformation induced by megatonne-scale CO2storage at Sleipner, Weyburn, and In Salah, Proc. Natl. Acad. Sci., 110(30), E2762–E2771.
Wang, H. F. (2000), Theory of Linear Poroelasticity With Applications to Geomechanics and Hydrogeology, Princeton Univ. Press, Princeton, N. J. Zhu, J., and T.-C. J. Yeh (2005), Characterization of aquifer heterogeneity using transient hydraulic tomography, Water Resour. Res., 41,