HAL Id: hal-00317825
https://hal.archives-ouvertes.fr/hal-00317825
Submitted on 28 Jul 2005
HAL is a multi-disciplinary open access
archive for the deposit and dissemination of
sci-entific research documents, whether they are
pub-lished or not. The documents may come from
teaching and research institutions in France or
abroad, or from public or private research centers.
L’archive ouverte pluridisciplinaire HAL, est
destinée au dépôt et à la diffusion de documents
scientifiques de niveau recherche, publiés ou non,
émanant des établissements d’enseignement et de
recherche français ou étrangers, des laboratoires
publics ou privés.
The electron energy distribution during HF pumping, a
picture painted with all colors
B. Gustavsson, T. Sergienko, M. J. Kosch, M. T. Rietveld, B. U. E.
Brändström, T. B. Leyser, B. Isham, P. Gallop, T. Aso, M. Ejiri, et al.
To cite this version:
B. Gustavsson, T. Sergienko, M. J. Kosch, M. T. Rietveld, B. U. E. Brändström, et al.. The electron
energy distribution during HF pumping, a picture painted with all colors. Annales Geophysicae,
European Geosciences Union, 2005, 23 (5), pp.1747-1754. �hal-00317825�
SRef-ID: 1432-0576/ag/2005-23-1747 © European Geosciences Union 2005
Annales
Geophysicae
The electron energy distribution during HF pumping, a picture
painted with all colors
B. Gustavsson1, T. Sergienko2, M. .J Kosch3, M. T. Rietveld4, B. U. E. Br¨andstr¨om2, T. B. Leyser5, B. Isham6, P. Gallop7, T. Aso1, M. Ejiri1, T. Grydeland8, ˚ A. Steen9, C. LaHoz8, K. Kaila10, J. Jussila10, and H. Holma10
1National Institute of Polar Research, Tokyo, Japan
2Swedish Institute of Space Physics, Kiruna, Sweden
3Department of Communication Systems, Lancaster University, Lancaster, England, UK
4EISCAT, Ramfjordmoen, Norway
5Swedish Institute of Space Physics, Uppsala, Sweden
6EISCAT Scientific Association, Longyearbyen, Norway
7Rutherford Appleton Laboratory, UK
8Dept. of Physics, University of Tromsø, Tromsø, Norway
9Remspace Inc., Link¨oping, Sweden
10Oulo University, Oulu, Finland
Received: 14 July 2004 – Revised: 14 April 2005 – Accepted: 3 May 2005 – Published: 28 July 2005
Abstract. The shape of the electron energy distribution has long been a central question in the field of high-frequency radio-induced optical emission experiments. This report presents estimates of the electron energy distribution
function, fe(E), from 0 to 60 eV, based on optical
multi-wavelength (6300, 5577, 8446, 4278 ˚A) data and 930-MHz
incoherent scatter radar measurements of ion temperature, electron temperature and electron concentration. According to our estimate, the electron energy distribution has a depres-sion at around 2 eV, probably caused by electron excitation of vibrational states in N2, and a high energy tail that is clearly
supra-thermal. The temporal evolution of the emissions in-dicates that the electron temperature still plays an important role in providing electrons with energies close to 2 eV. At the higher energies the electron energy distribution has a non-thermal tail.
Keywords. Active experiments; Ionosphere atmosphere
in-teraction; Ionospheric physics
1 Introduction
Ionospheric high frequency (HF, 3–30 MHz) radio wave-induced optical emissions have been studied since the early 1970s (Biondi et al., 1970; Haslett and Megill, 1974) at low (Bernhardt et al., 1988), middle (Bernhardt et al., 1989a) and auroral (Br¨andstr¨om et al., 1999; Kosch et al., 2000; Pedersen and Carlson, 2001) latitudes. Even so, little is known about
Correspondence to: B. Gustavsson
(bjorn.gustavsson@nipr.ac.jp)
the mechanism by which energy from the HF radio wave is transferred to the excitations of the atoms, molecules and ions that emit the light. One major step to clarify this issue is to determine the shape of the electron energy distribution
function fe(E)during HF-pumping. In this report, we
esti-mate the shape of the electron energy distribution using Eu-ropean Incoherent Scatter (EISCAT) UHF measurements of electron concentration, ne, and temperature, Te, and optical observations by the Auroral Large Imaging System (ALIS) (Steen et al., 1997; Br¨andstr¨om, 2003) and Digital All-Sky Imager (DASI) (Kosch et al., 1998) of enhanced emissions at
4278, 5577, 6300 and 8446 ˚A.
When a powerful HF radio wave is transmitted into the ionosphere with a frequency less than the peak ionospheric plasma frequency, this wave deposits most of its energy into the plasma in a narrow region. This region ranges from the reflection altitude, where the pump frequency equals the
lo-cal plasma frequency, fP, down to the altitude of upper
hy-brid resonance, where the pump frequency, f0, equals the
lo-cal upper hybrid frequency fU H=(fγ2+fP2)1/2), and at times several kilometers below. This process is intricate, primar-ily for the following three reasons: the energy of the pump wave is much less than the thermal energy of the electrons; the plasma is weakly ionized; and there are several possible nonlinear physical processes that can contribute. Moreover, these processes might contribute in different proportions
de-pending on whether f0is above, below or within a few kHz
of a multiple of the electron gyro resonance (f0≈nfγ) at the altitude where f0=fU H.
1748 B. Gustavsson et al.: Electron energy distribution during HF pumping 9 9.5 10 10.5 11 11.5 12 1800 1810 1820 1830 1840 1850 1900 1910 1920 1930 1940 100 200 300 400 500 log 10 electron concentration (m −3 ) altitude (km) 500 1000 1500 2000 2500 3000 3500 1800 1810 1820 1830 1840 1850 1900 1910 1920 1930 1940 100 200 300 400 500 electron temperature (K) altitude (km) Time (UT)
Fig. 1. EISCAT UHF observations of the electron concentration (top panel) and electron temperature (bottom panel). As seen in the top panel the electron concentration in the F region decays steadily, and there are no signs of significant precipitation until 19:30 UT. The electron temperature reaches 3000–3500 K for each pulse. For the first pulses the hot (Te>2500 K) region is approximately 50 km
in altitude extent but gradually the heated region extends to more than 100 km. The dashed black line is the approximate upper hy-brid level, the solid black line is the altitude of the maximum tem-perature enhancements and the white line is the altitude where an MSIS model atmosphere gives the same O(1D)effective lifetime, as estimated from the DASI 6300 ˚A observations.
Early observations of high ratios between enhancements in
5577 and 6300 ˚A presented by Haslett and Megill (1974) and
Bernhardt et al. (1989b) have been taken as an indication that the electron distribution causing the enhanced emissions has a significant accelerated part (e.g. Bernhardt et al., 1989b; Gurevich et al., 1985). Some experimental indications of ac-celerated electrons from Arecibo (IS-radar) have been pre-sented (Carlson et al., 1982; Gurevich et al., 2000). This has been explained with electron acceleration by Langmuir tur-bulence (LT) excited at the reflection altitude. Specifically, weak LT has been dealt with theoretically by, for example, Perkins and Kaw (1971), Weinstock (1975), and Weinstock and Bezzerides (1974), and strong LT by DuBois et al. (1990) and Gurevich et al. (1985). Numerical simulations for iono-spheric conditions have yielded power-law like tails of the electron distribution (Wang et al., 1997). Others (primarily Mantas, 1994; Mantas and Carlson, 1996) argued that the
en-hancements in 6300 ˚A could well be explained by excitation
of the high energy tail of the heated electron distribution and
that the early observations of enhancements in 5577 ˚A were
scarce and unreliably close to the instrumental noise level. With improved optical instrumentation, recent observa-tions (e.g. Gustavsson et al., 2003) show that the
enhance-ments at 5577 ˚A regularly reach 10–30% of the 6300 ˚A
en-hancements. This reinforces the view that a significant part of the enhanced emissions are caused by non-thermal elec-trons. Further, optical and incoherent scatter radar
observa-tions coupled with thermosphere-ionosphere modeling have
shown that the thermal model overestimates the 6300 ˚A
en-hancements (Sergienko et al., 2000; Gustavsson et al., 2001).
This decrease in excitation of the O(1D) state can be
ex-plained by a depletion in the electron energy distribution from 2 to some 6 eV caused by the interaction of the elec-trons with the much more abundant neutrals (typical ion-to-neutral ratios in these nighttime experiments range from 10−4to 10−9) in the F region (Mishin et al., 2000; Gustavs-son et al., 2004). However, this effect cannot explain the large 5577 to 6300 ratio.
Other observations show a minimum in the enhancements
in 6300 ˚A (Kosch et al., 2002; Bernhardt et al., 2000) when
f0 is at an electron gyro resonance at the altitude where
f0=fU H. During these conditions, UH and electron
Bern-stein phenomena are suppressed, as are anomalous absorp-tion and electron heating. This allows more of the pump wave energy to propagate to the pump reflection altitude. De-spite the larger amount of energy available to excite LT, no
significant enhancements at 6300 ˚A are produced. This
in-dicates that LT alone is not the dominant cause of enhanced optical emissions.
2 Experiment and data
From 18:00 to 19:36 UT on 10 March 2002, the EISCAT
Heating Facility (Rietveld et al., 1993) in Tromsø (69.6◦N,
19.2◦E) was operated at 5.423 MHz, transmitting ∼375 MW
effective radiated power in ordinary mode with a 4 min on and 2 min off cycle to enhance airglow in the nighttime F
re-gion ionosphere. The antenna beam was approximately 6.8◦
wide and directed 11.8◦ south of zenith. During the entire
experiment the EISCAT UHF incoherent scatter radar
mea-sured electron temperature (Te) enhancements up to 3000–
3500 K, while the F region electron density decayed, as shown in Fig. 1. The temperatures seen agree well with pre-vious observations (Gustavsson et al., 2001; Rietveld et al., 2003; Leyser et al., 2000), even though the effective radiated power here is approximately 2 times greater. Two factors that contribute to limiting the temperature are that the en-ergy transfer from the electrons increases exponentially with temperature, and that the HF pump deposits its energy where the electron density is 1.7 times higher when transmitting at 5.423 MHz compared to 4.04 MHz .
During this period the Auroral Large Imaging System
(ALIS) imager temporarily located in Skibotn (69.35◦N,
20.36◦E) made observations in the 6300, 5577, 8446 and
4278 ˚A emissions with 7-s exposure every 9–11 s,
switch-ing filters between every image. As can be seen in Fig. 2 the full-width at half-maximum of the region with enhanced emissions is approximately 13±1 km and equal for the 5577 and 8446 ˚A lines. Due to diffusion and drift the full-width at
half-maximum for the 6300 ˚A is slightly larger at 15±2 km.
For the 4278 ˚A emission the size is smaller at 10±4 km but
it might only appear so because the enhancement is close to the noise level.
0 20 40 60 70 80 90 100 110 6300 A (R) pixel # −5 0 5 10 15 20 70 80 90 100 110 5577 A (R) pixel # −5 0 5 10 15 20 70 80 90 100 110 8446 A (R) pixel # −2 0 2 4 6 8 10 1800 1810 1820 1830 1840 1850 1900 1910 1920 1930 1940 70 80 90 100 110 4278 A (R) time (UT) pixel #
Fig. 2. Keograms of the ALIS observations after background sub-traction, in the top panel the enhancements in 6300 ˚A, in the second panel 5577 ˚A, in the third 8446 ˚A and in the fourth 4278 ˚A. The scale on the vertical axis is pixel number, the width of the red-line enhancement is approximately 3◦which corresponds to a 15-km width at 250 km altitude. The enhancement in 6300 ˚A is 40±3 R for the first pulses then, with the rise in altitude and widening of the heated electrons, it increases to 55–70 R. For the 5577 ˚A the en-hancement for the first two pulses are 10–15 R and then it varies around 10 R. For 8446 ˚A the enhancement increases from 10±2 to 15±3 R and for the 4278 ˚A N2+(1N G)) emission the enhancements are indistinguishable from the noise for the first pulses but they grow up to 5 R at 18:42 UT.
Simultaneously, the co-located digital all-sky imager
(DASI) made observations in the 6300 ˚A emission from
O(1D)from 18:00 to 18:30 UT, from 18:50 to 19:06 UT and
from 19:26 to 19:34 UT; and in the 5577 ˚A emission from
O(1S)from 18:33 to 18:47 UT and from 19:09 to 19:23 UT,
all with 10 s exposure and 1 image every 10-s. As can be seen in Fig. 3 the intensity grows from around 10 R for the first pulse to 60–70 R for the pulses after 18:48 UT. From the
initial decay of the 6300 ˚A emission, we estimate the O(1D)
effective lifetime τO(1D)to be 26–33 s, using the method
sug-gested by Bernhardt et al. (2000). The results are listed in Table 1.
Other measurements which were made during the experi-ment, but are not used in this study, included power and spec-tra of Langmuir turbulence using the EISCAT 224 MHz in-coherent scatter radar, and stimulated electromagnetic
emis-Table 1. Estimates of O(1D)effective lifetime from the initial de-cay of the enhancement in 6300 ˚A emission as observed by DASI.
HF-pulse (UT) τO(1D)(s) 18:10 29 18:16 26 18:22 26 18:28 28 18:52 27 18:58 26 19:06 25 19:28 33 1800 1810 1820 1830 1840 1850 1900 1910 1920 1930 1940 −10 0 10 20 30 40 50 60 70 80 Enhancement in 6300 A time (UT)
Column emission rate (R)
Fig. 3. Maximum enhancements in 6300 ˚A after background reduc-tion. The black squares mark the HF-pump-periods.
sions around the HF pump frequency, using a spectrum ana-lyzer 15 km east of the Heating facility.
3 Data analysis
To estimate fe(E)we look at the contribution to the
emis-sions from energetic electrons. For I5577there are two main
sources of O(1S). The most important in the F region is
di-rect electron excitation:
O + e−→O(1S) + e−, (1)
which has an excitation threshold of 4.17 eV and a cross section as depicted in Fig. 4. The second is energy transfer from N2(A36+u)
N2(A36u+) + O → N2+O(1S), (2)
which does not give a significant contribution in the F region
where the concentration of N2is much lower than O.
For I6300 the major sources from energetic electrons to
O(1D)are direct electron excitation
O + e−→O(1D) + e−, (3)
with an excitation threshold of 1.96 eV and about a 10 times
higher cross section than that for O(1S)and cascading from
O(1S)
O(1S) → O(1D) + hν
1750 B. Gustavsson et al.: Electron energy distribution during HF pumping 100 101 102 10−19 10−18 10−17 10−16
Electron energy (eV)
Cross section (cm −2 ) O(1D) O(1S) O(3p3P) N 2 +(1NG) 4278 N2(A3Σu+) N2(C3Πu)
Fig. 4. Cross sections for electron impact excitation of O(1D) −
emitting at 6300 ˚A, with excitation threshold 1.965 eV − experi-mental data from Doering (1992), O(1S) −emitting at 5577 ˚A, with excitation threshold 4.19 eV − experimental data from Doering and Gulcicek (1989), O(3p3P ) −emitting at 8446 ˚A, with excitation threshold 10.99 eV − experimental data from Itikawa and Ichimura (1990). For electron excitation of (N2) we have the emission cross
section for 4278 ˚A from (N2+) with threshold for ionization + ex-citation at 18 eV and exex-citation cross section for N2+(A36u+)and
N2(C35u) −all with experimental data from Itikawa et al. (1986).
In the quiet F-region ionosphere the major source of
O(1D)is excitation from dissociative recombination of O2+.
O2++e−→O(1D) + O (5)
with a yield, Q, of 1.2. For situations with rapid variations this has to be included since its rate varies with Te
k =1.9−7(300/Te)0.5. (6)
However, at steady state, which we considers here, the loss
of O2+is balanced by the source-charge transfer from O+to
O2
O++O2→O + O2+ (7)
Thus, we obtain an O(1D)excitation rate that is independent
of Te rO(1D)=nO+ 2nekQ=nO + 2 nek=nO +nO 2K (nO+nO 2K/nek)nekQ=nO+nO2KQ. (8)
According to Chen et al. (1978) the rate coefficient (K) for
charge transfer from O+is to O2
K=3.33×10⁻¹²exp(3.72(300./Tf)−1.78(300./Tf)2)
. (9)
where Tf is the average of the neutral and ion
tempera-tures. At the end of the 4 min HF pump periods the
modi-fied O(1D)excitation rates from dissociative recombination
is within a few percent of the natural background rates.
There are two sources for I8446: electron excitation of
atomic oxygen and dissociative excitation of molecular oxy-gen. Since the concentration of molecular oxygen is approx-imately 5% of the atomic oxygen at the region of interest and the emission cross section for dissociative excitation is a factor of 5 smaller, we only include direct excitation of
atomic oxygen. Finally, the only source of I4278is electron
impact ionization to the N2+(B26u−)state, for which we use the emission cross section from Itikawa et al. (1986). How-ever, about half the intensity of the 1–5 N22P band at 4268 ˚A
passes through the passband of the filter. Thus, we have to take that into account. For the N2(C35u)we obtain the ex-citation cross section from Itikawa et al. (1986) and use Ein-stein coefficients and Franck-Condon factors from Gilmore et al. (1992).
In order to obtain a simple set of equations for fe(E)we
note that the region of enhanced emission is small, with a typical size of about 30 km (Gustavsson et al., 2001), and assume that all excitation occurs in a 10-km wide region with conditions for the HF-pump wave reflection altitude. This gives us the following set of integral equations for the column emission rates: I5577=10−6 A5577 P AO(1S) nO1z ∞ Z 0
ve(E)σ2(E)fe(E)dE, (10)
I6300=10−6A6300τOI D(I5577+nO1z] ∞
Z
0
ve(E)σ1(E)fe(E)dE), (11)
I8446=10−6nO1z ∞
Z
0
ve(E)σ3(E)fe(E)dE, (12)
I4278=10−6nN21z
∞
Z
0
ve(E)σ4(E)fe(E)dE, (13)
I4268=10−6nN2Q1z
∞
Z
0
ve(E)σ5(E)fe(E)dE. (14)
Here Ai is the Einstein coefficient for the emission, listed
in Table 2, and the sum P A0
i(z) is taken over all
loss processes for the emitting state. (Q) in Eq. (14)
is (qX−CAi,1−5P Ai,1−j=0.308·8.98·105/2.66·107), with
values of Franck-Condon factors and Einstein coefficients from Gilmore et al. (1992).
Furthermore, nj is the local concentration of the
emit-ting species, σi is the excitation cross section, veis the elec-tron velocity, fe(E, z)is the electron energy distribution as a function of energy (E) and altitude (z). For the neutral den-sities we use the MSIS model (Hedin, 1991) at the altitude of interaction.
Table 2. Transition probabilities from O(1S)and O(1D). Einstein coefficients recommended by Itikawa and Ichimura (1990).
Transition Einstein coeff (s−1)
O(1D)−O(3P )2 5.627·10−3 O(1D)−O(3P )1 1.818·10−3 O(1D)−O(3P )3 8.922·10−7 O(1S)−O(3P )2 2.732·10−4 O(1S)−O(3P )1 7.601·10−2 O(1S)−O(1D) 1.215
Equations (10) to (14) are a set of integral equations for
fe(E)that we solve by searching for optimal parameters of
the following parameterization of fe(E):
fe(E) E1/2 ∝ n0e −E kB Te E<=E1 max(n2(EE0)γ, n1e −E kB T1+ n2e −(E−E0)2 dE2 ) E1<E<E0 n1e −E kB T1+n2e −(E−E0) 2 dE2 E>E0. (15)
Here E1=1.96 eV and we take (n1, T1, n2, E0, dE, γ) as
free parameters and determine n0 to give an electron
con-centration according to the EISCAT UHF observations. This parameterization allows us to obtain a wide variety of electron energy distributions. By separating the number of electrons in the tail (by using n1and n2for the electrons
with E>2 eV and n0for the bulk electrons) we can roughly
model the electron “bite-out” at 2 eV. This modification is
caused mainly by energy loss to vibrational states of N2, and
fe(E)is estimated to be depleted to 10–20% in the lower
F region (Mishin et al., 2000). The reason that we require that γ <1/2 is to avoid “bump-on-tail” populations. That HF-pumping cannot produce “bump-on-tail” populations is a reasonable assumption, considering that the energy of the pump wave is much less than the thermal energy of the elec-trons. In order to obtain a good fit with the observed emis-sions it was not enough to assume a power-law tail, and thus we had to add the accelerated population (n2e−(E−E0)
2/dE2
) and the “higher temperature in the tail than the bulk” elec-trons (n1E1/2e−E/ kBT1). This parameterization should
cap-ture the major feacap-tures of the modified electron energy distri-bution. However, keeping in mind the complexity of electron energy distributions in the auroral ionosphere, we are aware that the real modified electron energy distribution might be more complex.
The electron energy distribution is obtained by minimiza-tion of the difference between the observed intensities and the intensities predicted by Eqs. (10) to (14). As can be seen in Fig. 5 it is possible to obtain a good agreement between the observed data and modeled emission enhancements.
The reason that we obtain such a perfect fit for almost all pulses is that there are six degrees of freedom in the
parame-18000 1810 1820 1830 1840 1850 1900 1910 1920 10 20 30 40 50 60 70
Observed and modeled emission enhancements
Time (UT)
Column emission rate (R)
6300 Å 5577 Å 8446 Å 4278 Å
Fig. 5. Modeled electron enhanced emission rates, marked with diamonds and dot-dashed lines, agree well with the observed en-hancements, marked with dots. The fit between observed and mod-eled emissions is almost perfect. For the 6300 and 8446 lines the differences are noticeable only for the second pulse. For 5577 it is possible to see deviations for the second and third pulse. For 4278, only the last pulse has an error large enough to be distinguishable.
terization and only four equations. However, it is worth not-ing the constraints that we impose − that the flux of ener-gized electrons at 100 eV is negligible and that the disconti-nuity a 2 eV corresponds to a depletion − makes the prob-lem solvable. Further, the parameterization is in its struc-ture very smooth which helps to avoid problems common in under-determined problems − noise sensitivity, and rapid fluctuations. To estimate the stability of the solution we also start the optimization at a large number of points in the pa-rameter space, and it appears that the numerical optimization gives approximately the same results for most of the starting points.
3.1 Interpretation of fitted parameters
The typical shape of the estimated electron energy distribu-tion from 2 to 100 eV has a thermal-like part from 2 eV up to some 10–20 eV, then a small but significant accelerated tail with an acceleration energy of between 40 and 60 eV and a sharp cutoff at higher energies, as shown in Fig. 6. Here it should be noted that even though the electron distribution has a positive slope tail, the electron distribution function is flat. At energies from 2 eV to 12–30 eV all but one electron en-ergy distribution (19:00–19:04 UT) have thermal-like com-ponents with temperatures ranging from 12 000 to 47 000 K. As can be seen in Fig. 7 this temperature is much larger than the bulk temperature measured by EISCAT UHF. How-ever, the fraction of electrons in this super-hot tail is very small, which is accentuated by the depletion in fe(E)at 2 eV, caused mainly by excitation of the vibrational states in N2.
1752 B. Gustavsson et al.: Electron energy distribution during HF pumping /home/bjorn/matlab/Heating/fe figspec4.m 05−Jul−2004 /home/bjorn/matlab/Heating/fe figspec4.m 05−Jul−2004 /home/bjorn/matlab/Heating/fe figspec4.m 05−Jul−2004 100 101 102 10−2 10−1 100 101 102 103 104 105 f e(E) for 18:18−18:22 UT electrons (cm −3 eV −1 )
electron energy (eV)
Fig. 6. Electron energy distribution as a function of energy.
18000 1810 1820 1830 1840 1850 1900 1910 1920 1930 2
4 6x 10
4 Electron temperature, high energy tail (K)
1800 1810 1820 1830 1840 1850 1900 1910 1920 2700 2800 2900 3000 3100
Electron temperature, bulk electrons (K)
time (UT)
Fig. 7. Upper panel shows the electron temperature in the high en-ergy tail, from 2 eV to approximately 20 eV. For comparison the lower panel displays the EISCAT UHF measurements of (Te) at
steady state in the region of highest temperature.
For the period from 18:00 to 18:40 UT this depletion de-creases from over 80% during the first pulses to less than 1% around 19:00 UT, as is shown in Fig. 8. For the later period the depletion is again larger by 30 to 50%.
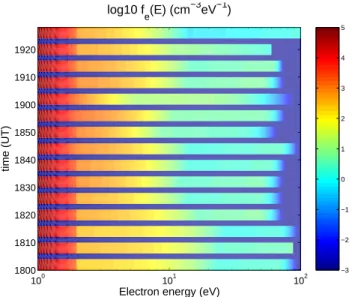
The parameter γ is approximately 1/2 for all but four HF pump pulses. This corresponds to an electron distribu-tion funcdistribu-tion that is flat (f ( ¯v)=C, Emin<mev¯2/2<E0) in the tail from 12–22 eV to the acceleration energy, as can be seen in Fig. 9. For the three pulses (18:48–18:52, 18:54– 18:56 and 19:18–19:22 UT) with a power-law component from 9–11 eV to the acceleration energy the exponent γ in (fe(E)∝(E/E0)γ) is −0.5, −0.04 and −1.23 respectively.
The results here do not, by and large, indicate electron
distri-1800 1810 1820 1830 1840 1850 1900 1910 1920 0.1 0.2 0.3 0.4 0.5 0.6 0.7 0.8 0.9 1 f e(2 eV)/fe th(2 eV) time (UT)
Fig. 8. Estimate of the ratio of fe(E)/fet h(E)at 2 eV. Here fet h(E)
denotes a thermal energy distribution. Note that the depletion is significant for the first five pulses when the approximate altitude of upper hybrid resonance is below 250 km and varies for the last pulses when the interaction altitude is above 250 km. This is con-sistent with the decrease in neutral concentrations with increasing altitudes. 100 101 102 1800 1810 1820 1830 1840 1850 1900 1910 1920
Electron energy (eV)
time (UT) log10 f e(E) (cm −3eV−1) −3 −2 −1 0 1 2 3 4 5
Fig. 9. Electron energy distribution as a function of energy and time.
butions dominated by power-law tails, as has been suggested by Mishin et al. (e.g. 2003).
4 Summary
In this report we have presented incoherent scatter and tical data from a HF pump experiment where enhanced
op-tical emission in 6300, 5577 and 8446 ˚A from atomic
temperature enhancements of up to 3500 K. Further, we have developed a method to estimate the shape of the electron en-ergy distribution function in the enen-ergy range from 1.96 to 100 eV. The resulting estimates of the electron energy dis-tribution show that there is an accelerated component with energies from 15–22 eV to 45–65 eV where the electron
dis-tribution is essentially flat. At intermediate energies
be-low 15 eV and above 1.96 the electron energy distribution is most often thermal-like with temperatures between 9000 and 43 000 K. At 2 eV there seems to be a depletion of be-tween 10 and 90% in the electron energy distribution. Gure-vich and Milikh (1997) and Bernhardt et al. (1989b) have suggested that the super-heated component in the electron energy distribution explains the high ratio between
enhance-ments in 5577 and 6300 ˚A, which is in agreement with the
observations presented in Gustavsson et al. (2003). Mishin et al. (2000) have predicted the depletion at 2 eV to be of the magnitude observed here during F-region HF-pump experi-ments. But in order to explain the observed enhancements in
8446 and 4278 ˚A that we present here, there has to be a
com-ponent of electron distribution accelerated to higher energies than that previously expected.
Acknowledgements. The authors thanks the unknown referees for
their valuable comments.
Topical Editor M. Lester thanks E. Mishin for his help in evalu-ating this paper.
References
Steen, ˚A., Br¨andstr¨om, U., and Gustavsson, B.: ALIS — a multi sta-tion imaging system at high latitude with multi disciplinary sci-entific objectives, in Proceedings 13th ESA Symposium on Eu-ropean Rocket and Balloon Programmes and Related Research, pp. 261–266, ESA, ESA SP-397, 1997.
Bernhardt, P. A., Duncan, L. M., and Tepley, C. A.: Artificial air-glow excited by high-power radio wawes, Science, 242, 1022– 1027, 1988.
Bernhardt, P. A., Duncan, L. M., and Tepley, C. A.: Heater induced cavities as optical tracers of plasma drift, J. Geophys. Res., 94, 7003–7010, 1989a.
Bernhardt, P. A., Tepley, C. A., and Duncan, L. M.: Airglow en-hancements associated with plasma cavities formed during iono-spheric heating experiments, J. Geophys. Res., 94, 9071–9092, 1989b.
Bernhardt, P. A., Wong, M., Huba, J. D., Fejer, B. G., Wagner, L. S., Goldstein, J. A., Selcher, C. A., Frolov, V. L., and Sergeev, E. N.: Optical remote sensing of the thermosphere with HF pumped ar-tificial airglow, J. Geophys. Res., 105, 10 657–10 671, 2000. Biondi, A. A., Sipler, D. P., and Hake, R. D.: Optical (λ−6300)
detection of radio frequency heating of electrons in the F region, J. Geophys. Res., 75, 6421–6424, 1970.
Br¨andstr¨om, B. U. E.: The Auroral Large Imaging System – Design, operation and scientific results, Ph.D. thesis, Swedish Institute of Space Physics, Kiruna, Sweden, Sci. Report 279, 2003. Br¨andstr¨om, B. U. E., Leyser, T. B., Steen, ˚A., Rietveld, M. T.,
Gustavsson, B., Aso, T., and Ejiri, M.: Unambigous evidence of HF pump-enhanced airglow, Geophys. Res. Lett., 26, 3561– 3564, 1999.
Carlson, H. C., Wickwar, V. B., and Mantas, G. P.: Observations of fluxes of suprathermal electrons accelerated by HF excited insta-bilities, J. Atmos. Terr. Phys., 44, 1089–1100, 1982.
Chen, A., Johnsen, R., and Biondi, M. A.: Measurements of the (O++N2) and (O++O2) reaction rates from 300 to 900 K, J.
Chem. Phys., 69, 2688, 1978.
Doering, J. P.: Absolute Differential and Integral Electron Excita-tion Cross SecExcita-tion for Atomic Oxygen 9. Improved Cross Sec-tion for the3P →1DTransition From 4.0 to 30 eV, J. Geophys. Res., 97, 19 531–19 534, 1992.
Doering, J. P. and Gulcicek, E. E.: Absolute Differential and In-tegral Electron Excitation Cross Section for Atomic Oxygen 7. The3P →1D and 3P →1S Transitions From 4.0 to 30 eV, J. Geophys. Res., 94, 1541–1546, 1989.
DuBois, D., Rose, H. A., and Russel, D.: Caviton Dynamics in Strong Langmuir Turbulence, Physica Scripta, T30, 137–158, 1990.
Gilmore, F. R., Laher, R. R., and Espy, P. J.: Franck-Condon Fac-tors, r-Centroids, Electronic Transition Moments, and Einstein Coefficients for Many Nitrogen and OPxygen Band Systems, J. Phys. Chem. Ref. Data, 21, 1005–1107, 1992.
Gurevich, A. V. and Milikh, G. M.: Artificial airglow due to modi-fications of the ionosphere by powerful radio waves, J. Geophys. Res., 102, 389–394, 1997.
Gurevich, A. V., Dimant, Y. S., Milikh, G. M., and Va’skov, V. V.: Multiple acceleration of electrons in the regions high power radio-wave reflection in the ionosphere, J. Atmos. Terr. Phys., 47, 1057–1070, 1985.
Gurevich, A. V., Carlson, H. C., Milikh, G. M., Zybin, K. P., Djuth, F. T., and Groves, K.: Suprathermal electrons generated by the interaction of powerful radio wave with the ionosphere, Geo-phys. Res. Lett., 27, 2461–2464, 2000.
Gustavsson, B., Sergienko, T., Rietveld, M. T., Honary, F., Steen, ˚
A., Br¨andstr¨om, B. U. E., Leyser, T. B., Aruliah, A. L., Aso, T., and Ejiri, M.: First Tomographic estimate of volume distribution of enhanced airglow emission caused by HF pumping, J. Geo-phys. Res., 106, 29 105–29 123, 2001.
Gustavsson, B., Br¨andstr¨om, B. U. E., Steen, ˚A., Sergienko, T., Leyser, T. B., Rietveld, M. T., Aso, T., and Ejiri, M.: Nearly si-multaneous images of HF-pump enhanced airglow at 6300 ˚A and 5577 ˚A, Geophys. Res. Lett., 29, doi:10.1029/2002GL015350, 2003.
Gustavsson, B., Sergienko, T., H¨aggstr¨om, I., and Honary, F.: Sim-ulation of high energy tail of electron distribution function, Adv. Polar Upper Atmos. Res., 18, 1–9, 2004.
Haslett, J. C. and Megill, L. R.: A model of the enhanced airglow excited by RF-radiation, Radio Sci., 9, 1005–1019, 1974. Hedin, A.: Extension of the MSIS Thermospheric Model into the
Middle and Lower Atmosphere, J. Geophys. Res., 96, 1159– 1172, 1991.
Itikawa, Y. and Ichimura, A.: Cross sections for collisions of elec-trons and photons with atomic oxygen, J. Phys. Chem. Ref. Data, 19, 637–651, 1990.
Itikawa, Y., Hayashi, M., Ichimura, A., Onda, K., Sakimoto, K., Takayanagi, K., Nakamura, M., Nishimura, H., and Takayanagi, T.: Cross sections for collisions of electrons and photons with ni-trogen molecules, J. Phys. Chem. Ref. Data, 15, 985–1010, 1986. Kosch, M., Hagfors, T., and Nielsen, E.: A new digital all-sky im-ager experiment for optical auroral studies in conjunction with the Scandinavian twin auroral radar experiment, Rev. Sci. In-strum., 69, 578–584, 1998.
1754 B. Gustavsson et al.: Electron energy distribution during HF pumping
Kosch, M. J., Rietveld, M., T., Hagfors, T., and Leyser, T. B.: High-latitude HF-induced airglow displaced equatorward of the pump beam, Geophys. Res. Lett., 27, 2817–2820, 2000.
Kosch, M. J., Rietveld, M. T., Kavanagh, A. J., Davis, C., Yeoman, T., Honary, F., and Hagfors, T.: High-latitude pump-induced op-tical emissions for frequencies close to the third electron gyro-harmonic, Geophys. Res. Lett., 29, 27-1-274, 2002.
Leyser, T. B., Gustavsson, B., Br¨andstr¨om, B. U. E., Steen, ˚A., Honary, F., Rietveld, M. T., Aso, T., and Ejiri, M.: Simulta-neous measurements of high-frequency pump-enhanced airglow and ionospheric temperatures at auroral latitudes, Adv. Polar Up-per Atmos. Res., 14, 1–11, 2000.
Mantas, G. P.: Large 6300- ˚A airglow intensity enhancements ob-served in ionosphere heating experiments are exited by thermal electrons, J. Geophys. Res., 99, 8993–9002, 1994.
Mantas, G. P. and Carlson, H. C.: Reinterpretation of the 6300-˚
A airglow enhancements observed in ionosphere heating exper-iments based on analysis of Platteville, Colorado, data, J. Geo-phys. Res., 101, 195–209, 1996.
Mishin, E., Carlson, H. C., and Hagfors, T.: On the Electron Dis-tribution Function in the F Region and Airglow Enhancements During HF Modification Experiments, Geophys. Res. Lett., 27, 2857–2860, 2000.
Mishin, E., Burke, W. J., and Pedersen, T. R.: On the on-set of HF-induced airglow at HAARP, J. Geophys. Res., 109, doi:10.1029/2003JA010205, 2003.
Pedersen, T. R. and Carlson, H. C.: First observations of HF heater-produced airglow at the High frequency Active Auroral Research Program facility: Thermal excitation and spatial structuring, Ra-dio Sci., 36, 1013–1026, 2001.
Perkins, F. W. and Kaw, P. K.: On the role of plasma instabilities in ionospheric heating by radio waves, J. Geophys. Res., 76, 282– 284, 1971.
Rietveld, M., Kosch, M., Blagoveshchenskaya, N., Kornienko, V., Leyser, T., and Yeoman, T.: Ionospheric electron heating, optical emissions and striations induced by powerful HF radio waves at high latitudes: Aspect angle dependence, J. Geophys. Res., 108, 1141–, 2003.
Rietveld, M. T., Kohl, H., Kopka, H., and Stubbe, P.: Introduction to ionospheric heating at Tromsø –I. Experimental overview, J. Atmos. Terr. Phys., 55, 577–599, 1993.
Sergienko, T., Gustavsson, B., Steen, ˚A., Br¨andstr¨om, U., Rietveld, M., Leyser, T., and Honary, F.: Analysis of excitation of the 630.0 nm airglow during heating experiment in Tromsø on 16 February 1999, Phys. Chem. Earth, 25, 531–535, 2000. Wang, J. G., Newman, D. L., and Goldman, M. V.: Vlasov
simula-tion of electron heating by Langmuir turbulence near the critical altitude in the radiation-modified ionosphere, J. Atmos. Solar and Terr. Phys., 59, 2461–2474, 1997.
Weinstock, J.: Theory of enhanced airglow during ionospheric modifications, J. Geophys. Res., 80, 4331–, 1975.
Weinstock, J. and Bezzerides, B.: Theory of electron acceleration during parametric instabilities, Phys. Rev. Lett., 32, 754–758, 1974.