HAL Id: hal-01360801
https://hal.archives-ouvertes.fr/hal-01360801
Submitted on 24 May 2021
HAL is a multi-disciplinary open access
archive for the deposit and dissemination of
sci-entific research documents, whether they are
pub-lished or not. The documents may come from
teaching and research institutions in France or
abroad, or from public or private research centers.
L’archive ouverte pluridisciplinaire HAL, est
destinée au dépôt et à la diffusion de documents
scientifiques de niveau recherche, publiés ou non,
émanant des établissements d’enseignement et de
recherche français ou étrangers, des laboratoires
publics ou privés.
magma ocean
C. Boukare, Y Ricard, G Fiquet
To cite this version:
C. Boukare, Y Ricard, G Fiquet. Thermodynamics of the MgO-FeO-SiO2 system up to 140GPa:
Application to the crystallization of Earth’s magma ocean.
Journal of Geophysical Research :
Solid Earth, American Geophysical Union, 2015, Thermodynamics of the MgO-FeO-SiO2 system
up to 140GPa: Application to the crystallization of Earth’s magma ocean, 120, pp.6085-6101.
�10.1002/2015JB011929�. �hal-01360801�
Thermodynamics of the MgO-FeO-SiO
2
system up to
140 GPa: Application to the crystallization
of Earth’s magma ocean
C.-E. Boukaré1, Y. Ricard1, and G. Fiquet2
1Laboratoire de Géologie de Lyon, Université de Lyon, CNRS UMR 5276, Lyon, France,2Institut de Minéralogie, de Physique
des Matériaux et de Cosmochimie, Sorbonne Universités - Pierre et Marie Curie University, CNRS UMR 7590, Paris, France
Abstract
At the end of Earth’s accretion and after the core-mantle segregation, the existence of a basal magma ocean at the top of the core-mantle boundary (CMB) depends on the physical properties of mantle materials at relevant pressure and temperature. Present-day deep mantle structures such as ultralow-velocity zones and low-shear velocity provinces might be directly linked to the still ongoing crystallization of a primordial magma ocean. We provide the first steps toward a self-consistent thermodynamic model of magma ocean crystallization at high pressure. We build a solid-liquidthermodynamic database for silicates in the MgO-FeO-SiO2system from 20 GPa to 140 GPa. We use
already published chemical potentials for solids, liquid MgO, and SiO2. We derive standard state chemical
potential for liquid FeO and mixing relations from various indirect observations. Using this database,
we compute the ternary phase diagram in the MgO-FeO-SiO2system as a function of temperature and
pressure. We confirm that the melt is lighter than the solid of same composition for all mantle conditions but at thermodynamic equilibrium, the iron-rich liquid is denser than the solid in the deep mantle. We compute a whole fractional crystallization sequence of the mantle and show that an iron-rich and fusible layer should be left above the CMB at the end of the crystallization.
1. Introduction
In Hadean times, giant impactors of the size of the Moon may have significantly melted the early Earth [Benz and Cameron, 1990; Tonks and Melosh, 1993; Weidenschilling et al., 1997]. The segregation of the core was also likely associated with the melting of the deep mantle [Ricard et al., 2005]. Large low-shear velocity provinces (LLSVPs) have been suggested to be indicative of chemical anomalies related to the crystallization sequence of the mantle [Labrosse et al., 2007; McNamara and Zhong, 2005]. Currently, seismic observations of ultralow-velocity zones (ULVZs) raise the question of the existence of partially molten regions in the present lower mantle [Garnero et al., 1998]. The nature of mantle phases both at solidus and liquidus represents therefore a key part in the understanding of the dynamics of the deep mantle.
One of the most important issue regarding the chemistry of the deep mantle is the partitioning of iron. Iron plays indeed a key role in the buoyancy and in the elastic properties of mantle phases, thus affecting the inter-pretation of seismic observations. In the last decade, a number of researchers have sought to determine the iron partition coefficient between solid phases [Kobayashi et al., 2005; Murakami et al., 2005; Auzende et al., 2008; Irifune et al., 2010]. Recently, iron partition measurements between melt and solid [Nomura et al., 2011; Andrault et al., 2012; Tateno et al., 2014] revealed that iron goes preferentially into the melt. Moreover, Stixrude and Karki [2005] and Stixrude et al. [2009] pointed out that silicate melt exhibits larger uncompressibilities that solid mantle phases hence suggesting the occurrence of a solid-liquid density crossover at depth. Labrosse et al. [2007] proposed a scenario of the deep mantle long-term evolution where fractional crystallization generated a stable dense layer of melt at the base of the mantle whose relics are the present ULVZs. Numerous studies have attempted to confirm the existence of a density inversion between crystal and melt [Ohtani, 1983; Funamori and Sato, 2010; Thomas et al., 2012; Sanloup et al., 2013] which is a crucial point in Labrosse et al.’s [2007] scenario. So far, however, there is no self-consistent description of silicate melt crystallization at temperature and pressure relevant for the deep mantle. The effects of fractional crystallization on crystal-melt density contrast are still poorly constrained.
RESEARCH ARTICLE
10.1002/2015JB011929
Key Points:
• We construct a thermodynamic database for solid and liquid silicates at HP/HT
• We compute crystallization sequences of simplified peridotite composition • We show that a gravitationally stable
melt layer at the CMB should form
Correspondence to: C.-E. Boukaré,
Citation:
Boukaré, C.-E., Y. Ricard, and G. Fiquet (2015), Thermodynam-ics of the MgO-FeO-SiO2system up to 140 GPa: Application to the crystallization of Earth’s magma ocean, J. Geophys. Res. Solid Earth,
120, 6085–6101,
doi:10.1002/2015JB011929.
Received 5 FEB 2015 Accepted 30 JUL 2015
Accepted article online 4 AUG 2015 Published online 16 SEP 2015
©2015. American Geophysical Union. All Rights Reserved.
The aim of this study is to establish self-consistent phase relations in the solid-liquid ternary system MgO-FeO-SiO2. Starting from standard state chemical potential of DeKoker et al. [2013], iron partition coeffi-cient measurements between melt and solids [Nomura et al., 2011; Andrault et al., 2012] and the melting curve of FeO [Fischer and Campbell, 2010], we build solid-liquid phase diagrams in the system MgO-FeO-SiO2up to
140 GPa. We then discuss a preliminary model of the crystallization of primordial Earth magma ocean.
2. Thermodynamic Model
We consider here eight species distributed in four phases, a liquid phase containing the oxides (MgO)l, (FeO)l, and (SiO2)land three solid phases: a bridgmanite phase (perovskite structure with magnesium and iron end-members, MgSiO3and FeSiO3), a ferropericlase phase (containing periclase (MgO)s and wüstite (FeO)s), and stishovite (SiO2)s. The postperovskite phase [Murakami et al., 2004], only present at relatively low temperature, should not appear at the melting conditions that we consider. MgSiO3bridgmanite has indeed been shown to be the solid at liquidus in experiments carried out on peridotite composition at 140 GPa [Fiquet et al., 2010].
The determination of the phases and compositions present at given pressure P and temperature T conditions can then be obtained by Gibbs minimization once the thermodynamic parameters and mixing properties of all end-members are defined.
2.1. Reference Potentials
In this study, all solid standard state chemical potential are taken from Stixrude and Lithgow-Bertelloni [2005] except for the equation of state of wüstite [Fischer et al., 2011] (the nonstoichiometry of (FeO)sis neglected in this study). We follow DeKoker et al. [2013] for liquid standard state chemical potential of (MgO)land (SiO2)l. The fifth-order equation of state of molten (SiO2)laccounts for pressure-induced structural changes in silicate melts [Sanloup et al., 2013; De Koker and Stixrude, 2009]. By comparison, the standard state chemical potential of (FeO)lliquid is still poorly known.
2.2. Chemical Potential of Liquid FeO
Up to know, description from first principles of strongly electronic correlated material such as iron-rich compounds remains challenging [Cococcioni and de Gironcoli, 2005]. We propose here to determine an effective standard chemical potential for (FeO)lstarting from a relatively simple equation of state. Taking into
account the limited amount of observations available for (FeO)l, we start from the Murnaghan expression
[Murnaghan, 1951] 𝜌0 𝜌 ≈ ( 1 + n P KT 0 )−1n (1)
as the density𝜌 is mostly a function of the pressure P. In this equation, 𝜌0is the density at zero pressure, KT 0is
the isothermal incompressibility at reference conditions, and n is an exponent of order 3. To account for the minor effect of temperature T, we choose a linear correction:
𝜌0 𝜌 = ( 1 + nP KT 0 )−1n + A(P)𝛼0(T − T0) (2)
where A(P) is a yet unknown nondimensional function of P and T0is the reference temperature at which
thermal expansivity is𝛼0. We assume, as what is usually done with solid EOS [Anderson, 1979] that
( 𝜕P 𝜕T ) 𝜌=𝛼0K T 0 ( 𝜌 𝜌0 )1−q (3)
where the exponent q, likely negative for fluids [Boehler and Ramakrishnan, 1980], controls the variations of the Gruneisen parameter with density. This equation using (2) constrains A(P) and leads to the semi-empirical EOS 𝜌0 𝜌 = ( 1 + n P KT 0 )−1n + ( 1 + nP KT 0 )−n+qn 𝛼0(T − T0) (4)
The shape of this last equation is certainly arbitrary. With extensive laboratory data, we could have used a more complex formalism [e.g., Ghiorso, 2004]. However, it is a simple, mathematically well behaved equation, with only five parameters (𝜌0,𝛼0, K0T, q, and n). We verified that this EOS gives a perfect fit to the densities that
DeKoker et al. [2013] computed for (MgO)lfrom 0 to 140 GPa and for (SiO2)lfrom 30 to 140 GPa (a more complex
EOS would be needed the fit of (SiO2)ldensities from 0 to 140 GPa). From the Maxwell relation𝜕(1∕𝜌)∕𝜕T|P=
−𝜕S∕𝜕P|T, we can derive the pressure dependence of the entropy according to (4), and we choose as a general
entropy parametrization: S = S0+ C0log T T0+ C1(T − T0) + 𝛼0K0 𝜌0q ( 1 + nP KT 0 )−qn (5)
where S0is a reference entropy and where the heat capacity Cpvaries linearly with T, Cp = C0+ C1T. Finally,
we obtain an expression for the reference potential by using
d𝜇0= 1 𝜌dP − SdT (6) which is 𝜇0= G 0− S0(T − T0) − C0 ( T log ( T T0 ) − (T − T0) ) −C1 2 ( T − T0 )2 −𝛼0K T 0 𝜌0q ( 1 + n P KT 0 )−qn ( T − T0 ) + K T 0 𝜌0(n − 1) ( 1 + n P KT 0 )1−1n (7)
where G0is another integration constant.
2.3. Mixing Model
The chemical potential of each end-member i in a solid or liquid solution is given by
𝜇i=𝜇i0+ RT log ai (8)
where aiis the activity. For simplicity, the solid solutions are considered here ideal with ai = Zi, where Ziis the molar proportion of the Mg end-member in the ferropericlase or bridgmanite phases. We define nisas the molar abundance of species i in the solid, and the proportions of Mg in the two solid solutions are therefore
Zfp= n(MgO)s n(MgO)s+ n(FeO)s Zpv= n(MgSiO3) s n(MgSiO3) s+ n(FeSiO3)s (9)
The activities of the oxides in the liquid are more complex and expressed as ai=𝛾ixi, where xistands for the molar proportions in the liquid phase
x1= x(MgO)l= n(MgO)l n(MgO)l+ n(FeO)l+ n(SiO2)l
x2= x(FeO)l= n(FeO)l n(MgO)l+ n(FeO)l+ n(SiO2)l
x3= x(SiO 2)l= n(SiO2)l n(MgO)l+ n(FeO) l+ n(SiO2)l (10)
and where the nonideality coefficients 𝛾i are described using ternary Margules expansions [Spear, 1993;
Helffrich and Wood, 1989]. According to the scarcity of available activity measurements in the MgO-FeO-SiO2
nonsymmetric Margules parameters might be slightly more appropriate in the MgO-SiO2system. We also
con-sider the mixing between (MgO)land (FeO)las ideal. With these assumptions, our mixing model must only depend on two functions W13and W23:
RT log𝛾1=((1 − x1)W13− x2W23)x3
RT log𝛾2=(−x1W13+ (1 − x2)W23)x3
RT log𝛾3=(x1W13+ x2W23)(x1+ x2)
(11)
The subscript “13” stands for (MgO)l-(SiO2)land “23” for (FeO)l-(SiO2)l. Each Margules parameter is a function of pressure and temperature. The Margules parameters for (MgO)l-(SiO2)l can be fitted from DeKoker et al. [2013]. For (FeO)l-(SiO2)lwe assume a simple case where,
W23= W0+ V1(P − P0) − S1(T − T0) (12)
with P0= 20 GPa and T0= 1500 K and where the excess volume and entropy, V1and S1, are constant.
2.4. Building a Self-Consistent Thermodynamic Database Using Experiments 2.4.1. Observations
In principle, the knowledge of the reference potentials and activities completely determines the behavior upon melting. The (FeO)lthermodynamic database is, however, largely uncertain and controlled in our model by as much as 12 parameters (nine thermodynamic parameters for liquid FeO: G0, S0, C0, C1,𝛼0,𝜌0, K0T, n, and q,
see (7), and three parameters for the mixing relation: W0, V1, and S1, see (12)). We constrain these parameters using various observations:
1. The melting curve of wüstite has been measured by Fischer and Campbell [2010]. This observation constrains the reference potential of (FeO)l,𝜇0(FeO)lalong the P(T) melting curve and its relative value with respect to
𝜇0
(FeO)sin the P-T space.
2. The density of liquid Fe2SiO4has been measured by Thomas et al. [2012] using shock wave experiments and
confirmed by molecular dynamics simulations of Ramo and Stixrude [2014]. This observation constrains the EoS of (FeO)land the Margules pressure derivative related to the mixing of (FeO)lwith (SiO2)l, i.e., the excess mixing volume.
3. The Mg/Fe partitioning between melt and bridgmanite
Kpv=
x1∕x2
Zpv∕(1 − Zpv)
(13) has been measured by a number of experimentalists [Nomura et al., 2011; Tateno et al., 2014]. We use also Mg/Fe partitioning coefficient between melt and ferropericlase measured up to 35 GPa [Katsura and Ito, 1996; Ohtani et al., 1998; Nomura et al., 2011]
Kfp=
x1∕x2
Zfp∕(1 − Zfp)
(14) The partitioning Kfpand Kpv, when both bridgmanite and ferropericlase coexist at chemical equilibrium, are related to the Mg/Fe partitioning Kdbetween the two solid phases,
Kd= Zfp∕ ( 1 − Zfp ) Zpv∕ ( 1 − Zpv ) =KKpv fp (15) The Kddepends neither on the chemical potential nor on the mixing relations of liquids but only on the ther-modynamic properties of the solid phases. According to our database, it decreases from 0.5 to less than 0.1 throughout the lower mantle. Experimentally (and in our simulations) the solid phase in equilibrium with the melt is ferropericlase near the top of the lower mantle and bridgmanite above 30 GPa [Ito et al., 2004; Fiquet
et al., 2010; Nomura et al., 2011; Tateno et al., 2014]. Therefore, near 30 GPa, Kpv∕Kfpshould be of order of 0.4.
So far, there has been little agreement on the experimental measurements of Kfp, Kpv, and Kd. Various issues have been raised to explain the inconsistencies in the observed Kd: differences of chemical analysis methods (electron microprobe versus analytical transmission electron microscopy), changes in the iron oxydation state
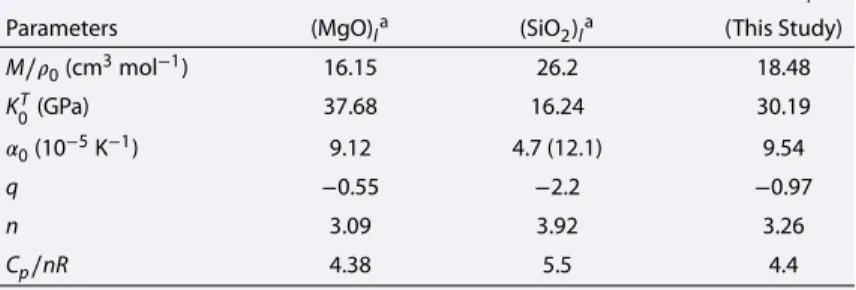
Table 1. Thermodynamic Properties of (MgO)l, (SiO2)l, and (FeO)lat 3000 K and Atmospheric Pressure
(FeO)l
Parameters (MgO)la (SiO
2)la (This Study) M∕𝜌0(cm3mol−1) 16.15 26.2 18.48 KT 0(GPa) 37.68 16.24 30.19 𝛼0(10−5K−1) 9.12 4.7 (12.1) 9.54 q −0.55 −2.2 −0.97 n 3.09 3.92 3.26 Cp∕nR 4.38 5.5 4.4
aDe Koker and Stixrude [2009].
[McCammon, 1997], transitions of the iron spin state [Badro et al., 2003; Auzende et al., 2008], and the presence of aluminum [Murakami et al., 2005]. The presence of aluminum should indeed favor the incorporation of iron into the bridgmanite. Since our thermodynamic model does not take into account aluminum, we try to match the aluminum-free experiments.
It was also proposed that the differences between Al-free system (olivine-like) and Al-bearing system (pyrolitic and chondritic) explained the variations in the observed Kpv. However, both Nomura et al. [2011] (in Al-free systems) and Tateno et al. [2014] (in Al-bearing system) have observed similar Mg/Fe distributions between melt and bridgmanite, as low as 0.08 at very high pressure (above 60 GPa). We show later that in a close system, the compositions of the liquid and solid in equilibrium, and therefore, the computed Mg/Fe distributions vary with the proportion of melt. As it is difficult from the published experimental values to know exactly the proportion of liquid (and to know precisely the local temperature) we assume that the observed Kpvare bracketed by the partitionings that we can compute at the onset of fusion and close to the liquidus. The difference in the observed Kpvmight be due to the fact that the observations are done at different condi-tions between liquidus and solidus. Notice also that Andrault et al. [2012] reported partitioning values for iron between solid and melt
D = ZFeO∕x2, (16)
i.e., the proportion of iron in the solid, ZFeO(whatever the solid is ferropericlase, bridgmanite, or both) divided by the proportion of iron in the liquid. Near the onset of crystallization, when the bridgmanite phase is at equilibrium ZFeO= (1 − Zpv), and D = Kpv(Zpv∕x1) must be larger than Kpvas there is more Mg in the solid than in the melt (i.e., Zpv∕x1> 1). Later during crystallization, solid oxides are formed, and as they are richer in iron than bridgmanite, D increases furthermore compared to Kpv. The differences between the values reported by Andrault et al. [2012] and by Tateno et al. [2014] are only related to the differences in the definition of the iron partitioning (D versus Kpv), and we will see that they both agree with our predictions.
Finally, we do not constrain our model by the solidus or liquidus that have been measured for peridotite [Fiquet et al., 2010], chondrite [Andrault et al., 2011], and MORB [Andrault et al., 2014]. The composition of MORB is
indeed too far from the MgO-FeO-SiO2domain and cannot be used. Elements such as Al or Ca might have
significant effects on melting curves. Our calculated liquidus and solidus temperatures in the MgO-FeO-SiO2
Table 2. Mixing Parameters
W2−3
Parameters W1−3a (This Study)
W0(kJ mol−1) −125 −45.2
V1(cm3mol−1) 0.088 0.19
S1(J K−1mol−1) 30.0
-S2(10−3J K−2mol−1) 17.0
-aDeKoker et al. [2013]; it includes a term inS
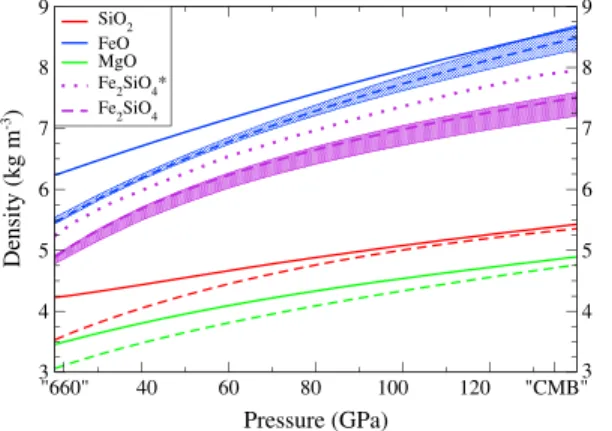
"660" 40 60 80 100 120 "CMB" Pressure (GPa) 3 3 4 4 5 5 6 6 7 7 8 8 9 9 Density (kg m -3) SiO2 FeO MgO Fe2SiO4* Fe 2SiO4
Figure 1. Densities of MgO, FeO, and SiO2computed along their respective melting curve presented in Figure 2 (dashed for liquids, solid for solids). The density of Fe2SiO4melt predicted by our model (dashed purple) is computed using the volume contribution of the mixing relations (i.e., nonideal mixing model). The
predictions of Thomas et al. [2012] based on shock experiments are also depicted (purple dotted line). The shadings depicts the estimated uncertainties.
system are thus independent of experimen-tal observations that we will use to check the quality of our predictions a posteriori.
2.4.2. Parameter Selection
From this set of experimental measurements, we can thus formulate an inverse problem in order to extract the unknown thermodynam-ical parameters of our model [Ghiorso et al., 1983]. In this study, the inversion is achieved by a generalized inverse method [Tarantola and Valette, 1982].
The thermodynamic parameters (G0, S0, C0,
C1, 𝛼0,𝜌0, K0T, n, and q for (FeO)l; W0, V1,
and S1for the mixing relation) are the model
parameters (the vector p). The data vector d0
consists of the values of (i) iron partition coef-ficients between melt and bridgmanite, (ii) iron partition coefficients between melt and ferropericlase, (iii) the density of (Fe2SiO4)l and (iv) the chemical potential of wüstite on its melting curve. We ensure that melt is sta-ble above its melting curves and not below by imposing (𝜇0
(FeO)s−𝜇 0 (FeO)l)∕|𝜇 0 (FeO)s−𝜇 0
(FeO)l| to be 1 above and
−1 below the melting curve.
The forward model g expresses the procedure of computing the data, d = g(p), from the parameters p of our thermodynamic model. We determine the best set of parameters by minimizing the following misfit function:
M(p) = [d0− g(p)]tCd−10d0[d0− g(p)] + [p − p0]
tC−1
p0p0[p − p0] (17)
Therefore, we try to fit the observations within their uncertainties (Cd0d0is a diagonal matrix containing the
square of the data uncertainties), with parameters close to an a priori set within some uncertainties (Cp0p0is a
diagonal matrix containing the square of the parameter uncertainties). Clearly this inversion problem is both overdetermined (we cannot fit all the data together as they are often contradictory) and underdetermined (some parameters are mostly controlled by their a priori values). The inverted parameters are, however, a reasonable set of self-consistent values that can be derived from experiments. Corresponding uncertainties can also be computed from the posteriori covariance matrix.
"660" 40 60 80 100 120 "CMB" Pressure (GPa) 2000 3000 4000 5000 6000 7000 8000 Temperature (K) FeO SiO 2 MgO
Figure 2. Melting curves of pure end-members MgO, SiO2, and FeO. For the two first oxides we use the parameters of De Koker and
Stixrude [2009]. The melting curve of FeO with uncertainties is the
result of our parameter inversion. It compares closely to the melting curve of Fischer and Campbell [2010] (blue thin line) that they extrapolated to the CMB (dashed blue line).
2.5. Results
The minimum of the misfit (17) is attained for the 12 parameters shown in Tables 1 and 2. It appears that adding higher orders of Margules parameters (e.g., in T2or P2) does
not improve the fit.
The molar volume of (FeO)lis slightly larger than that of (MgO)l which is also the case when the properties of the solid counter-parts are considered [Mattern et al., 2005]. The Gruneisen q is negative which is nor-mal for fluids [Boehler and Ramakrishnan, 1980]. The other parameters are predicted in between those for (MgO)land (SiO2)l. We show in Figure 1 the density of the solid end-members (MgO)s, (FeO)s, and (SiO2)s (green, blue, and red curves, respectively) compared to their associated liquids. These
"660" 40 60 80 100 120 "CMB"
Pressure (GPa)
0.1 1
Partition Coefficient
Figure 3. Red: observations [Auzende et al., 2008; Kobayashi et al., 2005] and predictions ofKd(bridgmanite-ferropericlase Mg/Fe
partitioning). Green: observations [Ohtani et al., 1998; Nomura et al., 2011] and prediction ofKfp(melt-ferropericlase Mg/Fe partitioning). Blue: observations [Tateno et al., 2014; Nomura et al., 2011] and prediction ofKpv(melt-bridgmanite Mg/Fe partitioning). The shadings represent the possible variations of the partitioning from solidus to liquidus. The solid phase in equilibrium with the melt is ferropericlase below 30 GPa, bridgmanite above. The observations ofKfpabove 30 GPa or ofKpvbelow 30 GPa would require to analyze the composition of the solid. The orange squares and the associated shading are the observations [Andrault et al., 2012] and prediction of the ratioDbetween the iron proportions in
solid and liquid.
densities are computed along the melt-ing curves (Figure 2) of the respective species. De Koker and Stixrude [2009] have reported that (MgO)l and (SiO2)l remain less dense compared to their isochemi-cal solids from the “660” discontinuity to the core-mantle boundary. This latter is consistent with the positive derivative of the melting curve. Indeed, the sign of the
Clapeyron slope dT∕dP = ΔVL−S∕ΔSL−S
is determined by the sign of liquid-solid
volume change ΔVL−S, assuming a
pos-itive liquid-solid entropy change ΔSL−S [Funamori and Sato, 2010]. Therefore, it seems unlikely that (FeO)lcould become denser than its solid counterpart accord-ing to the meltaccord-ing curve of wüstite, and this is indeed the case for our predictions in Figure 1.
Our prediction for the density of (FeO)l (blue dashed line) is in good agree-ment with recent calculations [Ramo and Stixrude, 2014]. The blue shading depicts the uncertainties that our inversion pre-dicts. However, our liquid Fe2SiO4(purple dashed line of Figure 2) remains significantly lighter that of Thomas et al. [2012] (purple dotted line) along
a 10 K GPa−1geotherm. This seems contradictory with the fact that along Hugoniot paths, the molecular
dynamics simulations of Ramo and Stixrude [2014] are said to be in good agreement with the shock experi-ments of Thomas et al. [2012]. Even using large Margules, our model has difficulties in predicting a (Fe2SiO4)l with a density close to that of (FeO)l. Other publications have already pointed out that shock experiments seem difficult to interpret during phase transition [Wakabayashi et al., 2014].
The melting temperature of FeO (thick blue line in Figure 2) is in reasonable agreement with the observations of Fischer and Campbell [2010] (based on experiments at pressures lower than 80 GPa, thin blue line, extrap-olated to the core-mantle boundary (CMB), dashed blue line) but has a larger curvature with pressure. The blue shading indicates the uncertainties that we estimate assuming that the chemical potential of (FeO)sis exactly known.
The various observed and predicted partitioning coefficients are reported in Figure 3 (green for Kfp, blue for
Kpv, orange for D, and red for Kd). The shadings represent the possible variations of the computed coefficients between liquidus and solidus. The change of the phase appearing at liquidus, observed around 30 GPa for peridotite and olivine composition [Ito et al., 2004; Fiquet et al., 2010; Nomura et al., 2011; Tateno et al., 2007] is indicated by a change in the shading intensity; Kfpcannot be measured at high pressure, and Kpvcannot be measured at low pressure. The Mg/Fe distribution between melt and ferropericlase, Kfp(green), remains about 1 in the lower mantle. Since the relation Kd = Kpv∕Kfpis verified in our model, this is consistent with the fact that the experimental values of Kd(red) are very closed those of Kpv(blue). Our model predicts that Mg/Fe distribution between melt and bridgmanite, Kpv, decreases from 0.35 at 20 GPa to 0.06 at 140 GPa. Although a possible step as been suggested between 60 and 80 GPa [Tateno et al., 2014; Nomura et al., 2011], our prediction is in rather good agreement with the experimental data according to the limited number of chemical species of our model. The observations of D [Andrault et al., 2012] (orange) which are rather well fitted do not evidence any discontinuity in Kpv. If a Kpvdrop due to the iron spin crossover [Nomura et al., 2011] or due to a change of the location of the Al3+from B-site to A-site in bridgmanite [Tateno et al., 2014] were
confirmed, a more detailed thermodynamic database would be necessary.
With our model, it does not seem possible to reconcile the melting curve of wüstite and the Mg/Fe distribu-tions Kpv, Kfp, and Kdwith the density of (Fe2SiO4)lestimated from shock experiments. Liquid Fe2SiO4could be
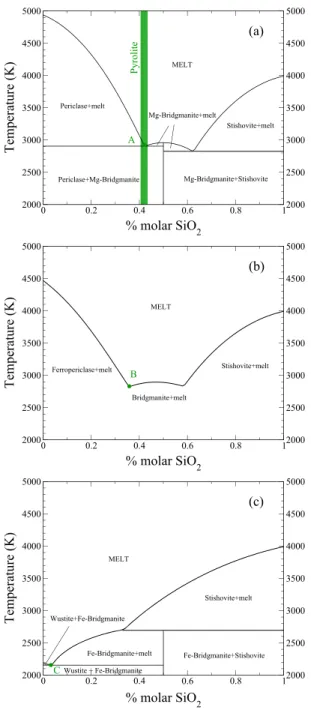
Figure 4. Binary joints in MgO-FeO-SiO2at 25 GPa. (a) MgO-SiO2 joint. We reproduce the two eutectics points predicted by DeKoker
et al. [2013]. Pyrolitic composition is very close to
periclase-bridgmanite eutectic, point A. (b) Mg0.7Fe0.3-SiO2binary joint. This binary joint corresponds to the Alkemade line of Mg/Fe ratio of7∕3
(see Figure 6). The point B depicts the melt composition at the onset of fractional melting. (c) FeO-SiO2joint. We predict a eutectic and a peritectic point. The point C depicts the melt composition at the end of fractional crystallization.
made denser (i) by increasing the density of (FeO)lbut this would flatten the Clapey-ron slope of wüstite and decrease its melting temperature unrealistically or (ii) by adding a negative mixing volume which would sta-bilize the iron in the liquid phase at high pressure, thus lowering drastically the Mg/Fe distribution between melt and solids (typ-ically below 0.001, much below what is observed). In this study, we choose to respect the wüstite melting curve and the Mg/Fe par-titioning between melt and bridgmanite.
2.5.1. Ternary Phase Diagram
The ternary phase diagram in the system
MgO-FeO-SiO2 is determined by solving
(18)–(20) which return, respectively, the liq-uidus conditions depending on the incipient solid phases at equilibrium: ferropericlase, bridgmanite, and stishovite. For these three scenarios, the solid-liquid thermodynamic equilibrium can be written as follows: 1. Liquid in equilibrium with oxide.
⎧ ⎪ ⎪ ⎨ ⎪ ⎪ ⎩ 𝜇0 (MgO)s+ RT log(Zfp) = 𝜇0 (MgO)l+ RT log (𝛾1x1) 𝜇0 (FeO)s+ RT log(1 − Zfp) = 𝜇0 (FeO)l+ RT log (𝛾2x2) (18)
2. Liquid in equilibrium with bridgmanite. ⎧ ⎪ ⎪ ⎨ ⎪ ⎪ ⎩ 𝜇0 (MgSiO3)s+ RT log(Zpv) =𝜇 0 (MgO)l+
RT log(𝛾1x1) +𝜇0(SiO2)l+ RT log (𝛾3x3)
𝜇0
(FeSiO3)s+ RT log(1 − Zpv) =𝜇 0 (FeO)l+
RT log(𝛾2x2) +𝜇0(SiO2)l+ RT log (𝛾3x3)
(19) 3. Liquid in equilibrium with stishovite.
𝜇0 (SiO2)s=𝜇
0
(SiO2)l+ RT log(𝛾3x3) (20)
where 𝜇0
i is the standard state chemical
potential of the pure end-member i and𝛾ithe activity coefficient of the species i.
Figure 4 depicts the phase diagrams com-puted at low pressure (25 GPa) along the binary joints MgO-SiO2 (a), (Mg0.7Fe0.3)
O-SiO2 (b), and FeO-SiO2 (c). Our model,
see Figure 4a, reproduces the positions of the two eutectic points on the MgO-SiO2 joint computed by
DeKoker et al. [2013]. For a pyrolitic SiO2 content, crystallization of ferropericlase occurs very close to the
ferropericlase-bridgmanite eutectic. On the FeO-SiO2 joint (Figure 4c), we predict a eutectic point with a
temperature very close to the melting temperature of FeO and a peritectic point near 35% molar SiO2. For the
intermediate composition (Figure 4b) we only report the liquidus. It is indeed confusing to discuss a ternary diagram with solid solution using a binary representation; the solid which appears at liquidus is depleted in
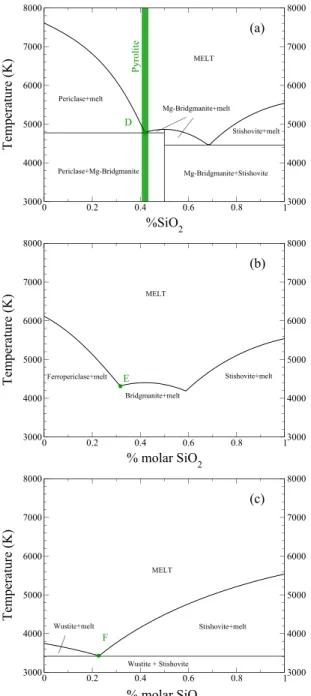
Figure 5. Same as Figure 4 but at 130 GPa. (a) MgO-SiO2joint. (b) Mg0.5Fe0.5-SiO2binary joint. This binary joint corresponds to the Alkemade line of Mg/Fe ratio of 1 (see Figure 6). The point E depicts the melt composition at the onset of fractional melting. (c) FeO-SiO2joint. At 130 GPa, we predict only one eutectic point. The point F depicts the melt composition at the end of fractional crystallization.
iron and thus does not belong to the (Mg0.7Fe0.3)O-SiO2joint as will be discussed below.
Figure 5 is similar to Figure 4, but near CMB pressure (130 GPa) and the middle diagram (Figure 4b) are now along the binary joint (Mg0.5Fe0.5)O-SiO2. The temperatures at
liq-uidus are now much higher than at low pres-sure. We still predict two eutectic points on the MgO-SiO2joint (Figure 4a) but only one on the FeO-SiO2joint (Figure 4c).
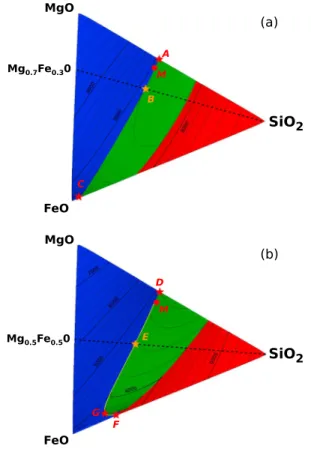
The complete liquidus surfaces are depicted in ternary phase diagrams in Figure 6 at the low and high pressures in Figures 4 and 5. The color indicates the phase that crystal-lizes first (blue for ferropericlase, green for bridgmanite, and red for stishovite). The con-tour lines indicate the temperature. At low pressure, eutectics on the MgO-SiO2joint are
connected to eutectics on the FeO-SiO2joint
by two cotectic valleys. These two cotectic valleys merge at high pressure to form a sin-gle eutectic on the FeO-SiO2joint. The two dotted lines correspond to the cross sections plotted in Figures 4b and 5b (such straight lines reaching the submit of a ternary dia-gram are called Alkemade lines).
An important feature of these phase dia-grams is that the liquidus temperature decreases with the iron content (near the CMB, the minimum of liquidus, (4) in Figure 5, is, however, not exactly located along the FeO-SiO2joint). Evidently, this was expected from the low melting temperature of FeO compared to the other end-members. Since liquid composition evolves on these equi-librium surfaces during crystallization in the direction of the minima, our model confirms that magma are enriched in iron during crystallization.
2.5.2. Magma Crystallization Sequences
We can now use the phase diagram in the
ternary system MgO-FeO-SiO2 to compute
crystallization sequences (fractional crystal-lization) of a deep magma ocean. We can divide a crystallization sequence into several parts: (i) a first solid appears at liquidus which modifies the liquid composition since the crystallization proceeds incongruently. The liquid composition evolves on the liquidus surface. (ii) As soon as the composition of the liquid reaches a cotectic, two solid phases crystallize simulta-neously while the liquid evolves following the cotectic valley. And (iii) a global minimum is reached, and the rest of the solid crystallizes.
Note that this fractional crystallization sequence assumes that the new solid which is formed is in chemical equilibrium with the liquid. As the liquid composition evolves, the composition of the newly formed solid
Figure 6. Ternary phase diagram in this system MgO-FeO-SiO2at (a) 25 GPa and (b) 130 GPa. Blue: ferropericlase crystallizes first. Green: bridgmanite crystallizes first. Red: stishovite crystallizes first. The thinner black lines are isotherms. The stars A–F correspond to the points in Figures 4 and 5. The Alkemade lines associated to the binary joints in Figures 4b and 5b are depicted in black dashed line. The melting path, starting from M (pyrolitic composition), is discussed later (see Figure 7).
must also evolves. The total solid that has been formed since the beginning of crystallization contains therefore compo-sitional gradients. Its bulk composition must be distinguished from that of the solid at equilibrium. Compositional gradi-ents can be maintained because diffusion time in solids is much longer than that of crystallization.
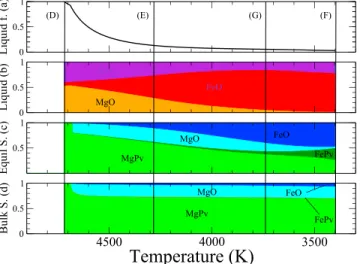
We plot in Figure 7 our prediction for the crystallization sequence at 130 GPa of a pyrolitic composition. The crystallization follows the yellow line in Figure 6b with a starting pyrolitic composition (point M in Figure 6b) very close to the cotectic. Bridg-manite is the solid appearing at liquidus (the composition of the solid at equi-librium, Figure 7c), shows clearly a first sequence at ≈4700 K, where solids close to pure Mg-bridgmanite are formed. The liquid enriched in (FeO)l (Figure 7b) reaches rapidly the cotectic where fer-ropericlase (blue) and bridgmanite (green) are formed simultaneously (the propor-tion of the Fe and Mg end-members is depicted separately, but the two phases are solid solutions). The bridgmanite that crystallizes contains much less iron than the oxides (as iron prefers ferropericlase Kfp≈1 to bridgmanite Kpv ≈0.1). The iron content of the liquid phase is maximum in point G, see Figure 6. The end of crys-tallization of a very Fe rich liquid occurs at 3400 K. Most of the cryscrys-tallization is achieved, however, within a few hundred degrees (Figure 7a). The bulk solid formed since the beginning of crystallization has a rather constant composition, 70% bridgmanite and 30% ferropericlase (Figure 7d).
2.5.3. Remarks on Mantle Melting
Note that the compositional paths and temperatures followed during mantle melting (fractional melting) are very different from those previously computed during fractional crystallization. During fractional crystalliza-tion, the last drop of liquid to crystallize contains basically no Mg and solidifies at very low temperature. For example, at 130 GPa, crystallization starts at 4800 K (point D in Figures 5a and 6b, neglecting the minor effect of a few % Fe) and ends up at 3400 K (point F in Figures 5c and 6b, neglecting this time, the minor effect of a few % Mg), i.e., occurs across a range of 1400 K. On the contrary, during the melting of the solid mantle, the first liquid that appears is moderately enriched in iron with a Mg/Fe ratio close to 1 (obtained again from equations (18) and (19), but solving for the melt composition, xi, when the solid compositions, Zfpand Zpv, are known). This composition (see point E on the Alkemade line in Figures 5b and 6b) melts near 4300 K. The ongoing melting depletes the remaining solid in iron, and the last solid melts at a temperature of order 4800 K (near the point D in Figures 5a and 6b). The fractional melting at 130 GPa occurs therefore over a range of only 500 K. Similarly, at low pressure, 25 GPa, fractional crystallization starts near A and ends near C (see Figures 4 and 6a), with a temperature range of 750 K, but fractional melting starts with a first liquid drop with compo-sition Mg/Fe ratio of ≈7∕3 (point B on the Alkemade line in Figures 4b and 6a) and ends again near A, with a temperature range of only ≈100 K. Since experimentalists proceed by increasing temperature until they observe melt, their solidus should correspond to the onset of fractional melting and be within a few hundreds Kelvin of the liquidus.
Figure 7. Crystallization sequence at 130 GPa of melt with pyrolitic composition: 53% MgO, 6% FeO, and 41% SiO2. The crystallization path is depicted in yellow in Figure 5starting at M. (a) Liquid fraction, (b) melt composition, (c) composition of the solid at equilibrium, and (d) composition of the bulk solid. The vertical lines correspond to points D–F in Figure 5.
3. Application to the Crystallization of Earth’s Mantle
3.1. Solidus and Liquidus of the Mantle
We show in Figure 8 the melting curves computed for a bulk pyrolitic composition and the experimental melting curves of peridotite [Fiquet et al., 2010], chondrite [Andrault et al., 2011], and mid-ocean ridge basalt (MORB) [Andrault et al., 2014]. The liquidus of a pyrolitic mantle is close to the eutectic temperatures proposed by Liebske and Frost [2012] for a mantle without iron. Our computed liquidus does not integrate highly refrac-tory elements such as aluminum or calcium which may explain the higher liquidus of Fiquet et al. [2010]. On the contrary, it seems difficult to explain the low liquidus of Andrault et al. [2011]. According to our model, the end of fractional crystallization occurs at the minimum of the liquidus surface for a Mg-free liquid. This temperature (blue line with uncertainties related to those of𝜇0
(FeO)l) should therefore be always lower than
the melting temperature of pure FeO (black line). During fractional melting, the onset of melting for a man-tle composition (green line) is close to the liquidus, as proposed by Liebske and Frost [2012]. Experimental observations of solidus are in between the blue and green curves and should approach one of these curves depending on whether the experiment is sensible to the last or to the first drop of liquid. As experimentalists detect the onset of melting, their solidus should therefore correspond to our green line or plot slightly above (as it is difficult to measure a very low fraction of melt in high-pressure experiments). It is therefore surprising
"660" 40 60 80 100 120 "CMB" Pressure (GPa) 2000 2500 3000 3500 4000 4500 5000 5500 Temperature (K) Our Liquidus
Our Solidus - Fractional crystallization Our Solidus - Fractional melting FeO (This model)
peridotite (Fiquet el al., 2010) chondrite (Andrault et al., 2011) MORB (Andrault et al., 2014) pyrolite (Nomura et al., 2014)
Figure 8. We show here our computed liquidus (red) and solidus (fractional melting in green and fractional crystallization in blue) curves compared to the results of Andrault et al. [2011, 2014],
Nomura et al. [2014], and Fiquet et al. [2010].
that such a large temperature range between liquidus and solidus is estimated in these experimental reports. As far as crystallization of the mantle is concerned, the blue line is, however, the relevant calculation.
3.2. Gravitational Equilibrium Versus Thermochemical Equilibrium
In this paper, we assess self-consistently the effect of the two major contributions of solid-liquid density contrast, largely discussed dur-ing the past 30 years: (i) silicate melt have higher compressibility than their solid coun-terparts [Rigden et al., 1984], and (ii) melt is enriched in iron due to the low values (< 1) of the liquid-solid Mg/Fe partitioning coeffi-cients [Ohtani, 1983].
"660" 40 60 80 100 120 CMB Pressure (GPa) 3.5 4 4.5 5 5.5 6 6.5 7 Density (g cm -3) 0 % of solid 90 % of solid solid mantle melt solid
Figure 9. Densities of melt and solid depending on the solid fraction (0% or incipient crystallization, red, and 90%, blue). The initial melt is composed of 53% mol of MgO, 6% mol of FeO, and 41% mol of SiO2. The melt (dashed red) is in equilibrium with the new formed crystal (solid red). As crystallization proceeds, the Fe-rich remaining liquid becomes very dense (dashed blue) and much denser than the solid at equilibrium (solid blue). The black dashed line represents the density of the total solid, at the end of the crystallization. The thin vertical lines indicate the pressures at which the liquid becomes denser than the solid at equilibrium.
We report in Figure 9 the densities of both solid and liquid at thermochemical equi-librium for different degrees of crystal-lization as function of pressure. We also show the density of the total solid (solid black) at the end of the crystallization which does not differ significantly from the solid that appears at liquidus (solid red). Previous studies [Stixrude and Karki, 2005; Mosenfelder et al., 2007, 2009] have revealed that Fe-free melt remains nega-tively buoyant compared to bridgmanite (or postperovskite) up to the CMB. The present study supports the fact that a pyrolitic melt containing iron (dashed red in Figure 9) is also lighter than its iso-chemical solid (solid black) as proposed by Thomas et al. [2012]. Nevertheless, if we consider thermochemical equilibrium at the onset of crystallization, the densities of melt (dashed red) and solid (solid red) cross over at 88 GPa because solid bridg-manite is depleted in iron compared to the melt. Additionally, we also show in Figure 9 that the density crossover moves rapidly to lower pressures as crystallization proceeds (25 GPa for 10% residual melt, blue). The solid at equilibrium when only 10% of
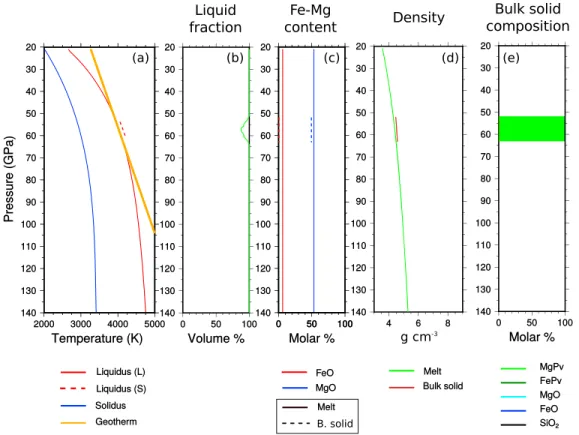
Figure 10. Deep mantle at the onset of crystallization. (a) Imposed geotherm (orange), liquidus of the liquid (solid red) and of the solid (dashed red), and solidus (blue). (b) Melt fraction. (c) FeO molar fraction in the solid (dashed red) and in the liquid (solid red). MgO molar fraction in the solid (dashed blue) and in the liquid (dashed blue). (d) Melt density (green) and bulk solid density (brown). (e) Mineralogical composition of the solid mantle.
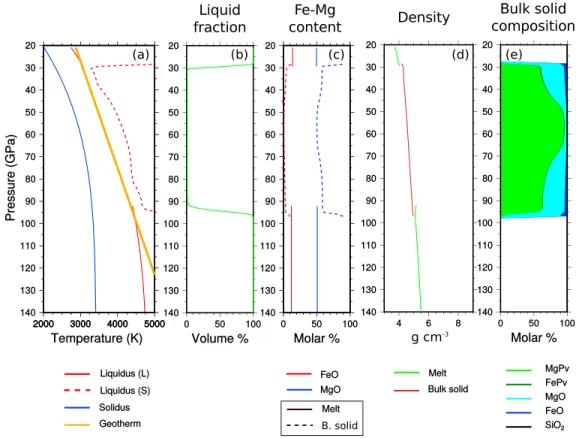
Figure 11. Same as Figure 10 during crystallization.
the liquid remains (solid blue) is also significantly denser than the first solid that had crystallized (solid red). However, the density of the bulk solid formed during crystallization is rather constant, evolving from the solid red line to the solid black line.
It may be possible that melts including aluminum and calcium become denser than their isochemical solids near the CMB [Sanloup et al., 2013; Asimow and Ahrens, 2010]. Nevertheless, in the MgO-FeO-SiO2system, we predict that iron partitioning is already sufficient to generate a density crossover at midmantle depth at the onset of crystallization.
3.3. Deep Earth Evolution at Thermochemical Equilibrium
We present here a preliminary mantle crystallization model which partially accounts for chemical differentia-tion. In this numerical experiment, crystals do not move depending on their density because no mechanical model of compaction, percolation, or convection has been implemented. Therefore, our assumption is that the solids remain in place, at the depth where they have been formed without sinking or rising. On the con-trary, the magma is homogenized due to an expected vigorous convective regime in the liquid mantle and by percolation through the solid phase. As our simulation implies that a shallow magma ocean and a basal magma ocean are both formed, we separately homogenize the liquid phase in these two reservoirs when they are isolated by a solid shell. We assume that the planet cools while keeping a geotherm with a constant slope of 1 K km−1, corresponding roughly to an adiabatic gradient in the molten phase. In the present work, our
simulations do not model the mantle crystallization coupled with proper thermal evolution [Labrosse et al., 2007]. We are aware of the unphysical nature of this temperature profile and evolution, but we think that with-out a complex two-phase convection model, it would be unrealistic to try to parametrize the evolution of the temperature gradients including thermal boundary layers building up near the solid-liquid interfaces, nona-diabatic compacting zones and a mechanically unstable density profile. We thus model here only the mantle thermochemical response to temperature changes.
Figures 10–12 depict mantle depth profiles at the onset of crystallization, during solidification and close to the end of crystallization, respectively. In this simulation, we report, (Figures 10a, 11a, and 12a) the imposed temperature (orange), the liquidus (red), and the solidus (blue). We distinguish the liquidus associated with
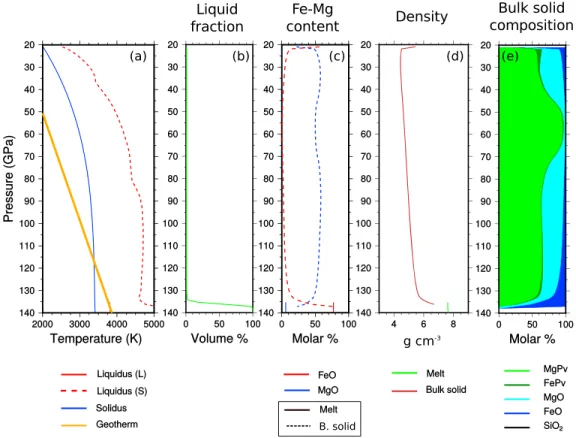
Figure 12. Same as Figure 10 but near the end of the crystallization.
the liquid composition (solid red) from that of the solid that has been formed (dotted red), (Figures 10a, 11a, and 12b) the liquid fraction at a given depth, (Figures 10c, 11c, and 12c) the iron and magnesium content of both melt and bulk solid, (Figures 10d, 11d, and 12d) the densities of melt (green) and bulk solid mantle (brown), and (Figures 10e, 11e, and 12e) the mineralogical composition of the solid mantle.
We predict that mantle crystallization starts at midmantle (≈ 60 GPa) (Figure 10). The first crystals are slightly denser than the liquid but are formed around the solid-liquid density inversion (Figure 10d). The first solid, depleted in Fe, is close to pure magnesium bridgmanite (Figure 10e). The crystallization front moves upward and downward and increases the iron content of the fluid phase. An upper magma ocean and a basal magma ocean are rapidly isolated by a solid shell (Figure 11).
In the upper magma ocean, crystallization proceeds upward from the bottom (solid is denser than melt) whereas the basal magma ocean undergoes a crystallization from its top (solid is lighter than melt) (see Figure 11d). The solid which is formed contains now bridgmanite and ferropericlase (Figure 11e). In Figure 11a, a close attention to the liquidus (solid red) indicates a slight decrease in temperature (compare to Figure 10) due to the antifreeze effect associated with the addition of iron. The liquidus associated with the mantle that has already crystallized (red dashed) is higher than the initial liquidus as its composition is depleted in iron. We show in Figure 12 the mantle near the end of the crystallization. The density stratification (Figure 12d) is stable in the lower mantle but instable in the upper mantle suggesting the possibility of a shallow mantle over-turn similar to that proposed by Elkins-Tanton et al. [2005] for Mars (notice, however, that Mars is richer in iron and that our model does not include upper mantle phases). The chemical compositions and the mineralogical species are not homogeneous in the mantle (Figure 12e). In the deepest mantle, the composition becomes gravitationally stable, dominated by simple oxides and enriched in iron as depth increases. An important melt fraction remains in the lowermost mantle (Figure 12b). The thermodynamic model confirms here that the incorporation of iron in the lower mantle stabilizes a basal melt layer. The incorporation of iron in the basal magma is achieved by mixing the iron-rich residual melt located at the solid-liquid interface with the rest of the fluid below. As the liquidus temperature decreases with the iron content, this delays furthermore the crystallization (an antifreeze effect): in Figure 12a, the liquidus temperature of the melt follows closely
the imposed geotherm and is 3750 K which corresponds roughly to the eutectic temperature of FeO-SiO2 joint (see Figure 5c). These two effects act both in favor of the stabilization of stable melt layer at the base of the mantle.
In the CMB region, the iron contents of both melt and solid mantle predicted by our model are very high (see Figure 11c). It is tempting to interpret this dense mantle with the large low-shear velocity provinces (LLSVPs) and the iron-rich melt as the ultralow-velocity zones (ULVZ). Nonetheless, it seems difficult to explain the large radial extension of the LLSVP [Ni et al., 2002]. A too large compositional density difference, much larger than the available thermal density variation, should rather favor a horizontal stratification [Garnero and McNamara, 2008].
4. Conclusion
The paper proposes a complete thermodynamic model of the solid-liquid equilibrium in the MgO-FeO-SiO2
system. It synthesizes various kinds of data (observed and computed equations of state, melting curves, and Mg/Fe partitioning). In particular, the large scatter of the measurements of partitioning might largely be due to the fact that these ratios evolve significantly as a function of the degree of melting. Observations that might have seemed contradictory (e.g., the observations of Andrault et al. [2012] compared to those of Nomura et al. [2011] and Tateno et al. [2014]) can be reconciled.
The present study confirms previous findings that at similar compositions, melts are lighter than solids throughout the mantle. However, at thermodynamic equilibrium, the first solids that crystallize in the deep mantle are lighter than the liquid as they are more Mg rich. This further enriches the melt in iron, and this residual melt becomes much denser than the solid phase. Both the antifreeze effect of iron and its high den-sity suggest a mantle crystallization scenario similar to that described in Labrosse et al. [2007] where the ULVZ are iron rich and very fusible remnants of a primordial basal ocean.
The present thermodynamical model offers new insights toward self-consistent models of the terrestrial magma ocean crystallization. The limits of our approach are due partly to the limited number of cations that we have considered (e.g., no Al or Ca are included) and to the iron spin transition that we have neglected. The postperovskite has also been neglected but should not appear at the large temperatures that we have considered. A more serious limit is the absence of coupling between the thermodynamic and mechanical con-ditions. Coupling together the thermodynamic model with the convective and multiphase dynamics remains a formidable task, but most of the ingredients are now separately available.
References
Anderson, O. L. (1979), Evidence supporting the approximation𝛾𝜌= const for the Grüneisen parameter of the Earth’s lower mantle,
J. Geophys. Res., 84(B7), 3537–3542, doi:10.1029/JB084iB07p03537.
Andrault, D., N. Bolfan-Casanova, G. L. Nigro, M. A. Bouhifd, G. Garbarino, and M. Mezouar (2011), Solidus and liquidus profiles of chondritic mantle: Implication for melting of the Earth across its history, Earth Planet. Sci. Lett., 304(1–2), 251–259, doi:10.1016/j.epsl.2011.02.006. Andrault, D., S. Petitgirard, G. L. Nigro, J.-L. Devidal, G. Veronesi, G. Garbarino, and M. Mezouar (2012), Solid-liquid iron partitioning in Earth’s
deep mantle, Nature, 497(7407), 354–357, doi:10.1038/nature11294.
Andrault, D., G. Pesce, M. A. Bouhifd, N. Bolfan-Casanova, J.-M. Hénot, and M. Mezouar (2014), Melting of subducted basalt at the core-mantle boundary, Science, 344, 892–895, doi:10.1126/science.1250466.
Asimow, P. D., and T. J. Ahrens (2010), Shock compression of liquid silicates to 125 GPa: The anorthite-diopside join, J. Geophys. Res., 115, B10209, doi:10.1029/2009JB007145.
Auzende, A.-L., J. Badro, F. J. Ryerson, P. K. Weber, S. J. Fallon, A. Addad, J. Siebert, and G. Fiquet (2008), Element partitioning between magnesium silicate perovskite and ferropericlase: New insights into bulk lower-mantle geochemistry, Earth Planet. Sci. Lett., 269(1–2), 164–174, doi:10.1016/j.epsl.2008.02.001.
Badro, J., G. Fiquet, F. Guyot, J.-P. Rueff, V. V. Struzhkin, G. Vankó, and G. Monaco (2003), Iron partitioning in Earth’s mantle: Toward a deep lower mantle discontinuity, Science, 300(5620), 789–791, doi:10.1126/science.1081311.
Benz, W., and A. G. W. Cameron (1990), Terrestrial effects of the giant impact, in Origin of the Earth, edited by W. Benz and A. G. W. Cameron, pp. 61–67, Oxford Univ., New York.
Boehler, R., and J. Ramakrishnan (1980), Experimental results on the pressure dependence of the Grüneisen parameter: A review, J. Geophys.
Res., 85(B12), 6996–7002, doi:10.1029/JB085iB12p06996.
Cococcioni, M., and S. de Gironcoli (2005), Linear response approach to the calculation of the effective interaction parameters in the LDA+U method, Phys. Rev. B, 71, 035105, doi:10.1103/PhysRevB.71.035105.
De Koker, N., and L. Stixrude (2009), Self-consistent thermodynamic description of silicate liquids, with application to shock melting of MgO periclase and MgSiO3perovskite, Geophys. J. Int., 178(1), 162–179, doi:10.1111/j.1365-246X.2009.04142.x.
DeKoker, N., B. B. Karki, and L. Stixrude (2013), Thermodynamics of the MgO-SiO2liquid system in Earth’s lowermost mantle from first principles, Earth Planet. Sci. Lett., 361, 58–63, doi:10.1016/j.epsl.2012.11.026.
Elkins-Tanton, L. T., P. C. Hess, and E. M. Parmentier (2005), Possible formation of ancient crust on Mars through magma ocean processes,
J. Geophys. Res., 110, E12S01, doi:10.1029/2005JE002480.
Acknowledgments
Thermodynamic data are taken from the paper of Stixrude and
Lithgow-Bertelloni [2005] for solids
and from the one of DeKoker et al. [2013] for liquid MgO, liquid SiO2, and mixing relations in the MgO-SiO2 system. Thermodynamic properties of FeO liquid and mixing relations in the MgO-FeO-SiO2system are shown in the present work. The authors thank ANR-2010-BLAN-622-01 “CMB Melt” for funding. They are also very grateful for valuable discussions with J. Matas, S. Labrosse, J.-P. Perillat, and T. Alboussière.
Fiquet, G., A. L. Auzende, J. Siebert, A. Corgne, H. Bureau, H. Ozawa, and G. Garbarino (2010), Melting of peridotite to 140 gigapascals,
Science, 329(5998), 1516–1518, doi:10.1126/science.1192448.
Fischer, R. A., and A. J. Campbell (2010), High-pressure melting of wüstite, Am. Mineral., 95, 1473–1477.
Fischer, R. A., A. J. Campbell, G. A. Shofner, O. T. Lord, P. Dera, and V. B. Prakapenka (2011), Equation of state and phase diagram of FeO, Earth
Planet. Sci. Lett., 304(3–4), 496–502, doi:10.1016/j.epsl.2011.02.025.
Funamori, N., and T. Sato (2010), Density contrast between silicate melts and crystals in the deep mantle: An integrated view based on static-compression data, Earth Planet. Sci. Lett., 295, 435–440, doi:10.1016/j.epsl.2010.04.021.
Garnero, E., J. Revenaugh, Q. Williams, T. Lay, and L. Kellogg (1998), Ultralow velocity zone at the core-mantle boundary, in The Core-Mantle
Boundary Region, edited by M. Gurnis et al., pp. 319–334, AGU, Washington, D. C.
Garnero, E. J., and A. K. McNamara (2008), Structure and dynamics of Earth’s lower mantle, Science, 320( 5876), 626–628, doi:10.1126/ science.1148028.
Ghiorso, M. (2004), An equation of state for silicate melts: I. Formulation of a general model, Am. J. Sci., 304(8–9), 637–678, doi:10.2475/ajs.304.8-9.637.
Ghiorso, M., I. Carmichael, M. Rivers, and R. Sack (1983), The Gibbs free energy of mixing of natural silicate liquids: An expanded regular solution approximation for the calculation of magmatic intensive variables, Contrib. Mineral. Petrol., 84(2–3), 107–145, doi:10.1007/BF00371280.
Helffrich, G., and B. Wood (1989), Subregular model for multicomponent solutions, Am. Mineral., 74, 1016–1022.
Irifune, T., T. Shinmei, C. A. McCammon, N. Miyajima, D. C. Rubie, and D. J. Frost (2010), Iron partitioning and density changes of pyrolite in Earth’s lower mantle, Science, 327(5962), 193–195, doi:10.1126/science.1181443.
Ito, E., A. Kubo, T. Katsura, and M. Walter (2004), Melting experiments of mantle materials under lower mantle conditions with implications for magma ocean differentiation, Phys. Earth Planet. Inter., 143–144, 397–406, doi:10.1016/j.pepi.2003.09.016.
Katsura, T., and E. Ito (1996), Determination of Fe-Mg partitioning between perovskite and magnesiowustite, Geophys. Res. Lett., 23(16), 2005–2008, doi:10.1029/96GL02086.
Kobayashi, Y., T. Kondo, E. Ohtani, N. Hirao, N. Miyajima, T. Yagi, T. Nagase, and T. Kikegawa (2005), Fe-Mg partitioning between (Mg, Fe)SiO3post-perovskite, perovskite, and magnesiowüstite in the Earth’s lower mantle, Geophys. Res. Lett., 32, L19301, doi:10.1029/2005GL023257.
Labrosse, S., J. Hernlund, and N. Coltice (2007), A crystallizing dense magma ocean at the base of the Earth’s mantle, Nature, 450(7171), 866–869, doi:10.1038/nature06355.
Liebske, C., and D. J. Frost (2012), Melting phase relations in the MgO-MgSiO3system between 16 and 26 GPa: Implications for melting in
Earth’s deep interior, Earth Planet. Sci. Lett., 345, 159–170, doi:10.1016/j.epsl.2012.06.038.
Mattern, E., J. Matas, Y. Ricard, and J. Bass (2005), Lower mantle composition and temperature from mineral physics and thermodynamic modelling, Geophys. J. Int., 160(3), 973–990, doi:10.1111/j.1365-246X.2004.02549.x.
McCammon, C. (1997), Perovskite as a possible sink for ferric iron in the lower mantle, Nature, 387, 694–696.
McNamara, A. K., and S. Zhong (2005), Thermochemical structures beneath Africa and the Pacific Ocean, Nature, 437(7062), 1136–1139, doi:10.1038/nature04066.
Mosenfelder, J. L., P. D. Asimow, and T. J. Ahrens (2007), Thermodynamic properties of Mg2SiO4liquid at ultra-high pressures from shock measurements to 200 GPa on forsterite and wadsleyite, J. Geophys. Res., 112, B06208, doi:10.1029/2006JB004364.
Mosenfelder, J. L., P. D. Asimow, D. J. Frost, D. C. Rubie, and T. J. Ahrens (2009), The MgSiO3system at high pressure: Thermodynamic
properties of perovskite, postperovskite, and melt from global inversion of shock and static compression data, J. Geophys. Res., 114, B01203, doi:10.1029/2008JB005900.
Murakami, M., K. Hirose, K. Kawamura, N. Sata, and Y. Ohishi (2004), Post-perovskite phase transition in MgSiO3, Science, 304(5672),
855–858, doi:10.1126/science.1095932.
Murakami, M., K. Hirose, N. Sata, and Y. Ohishi (2005), Post-perovskite phase transition and mineral chemistry in the pyrolitic lowermost mantle, Geophys. Res. Lett., 32, L03304, doi:10.1029/2004GL021956.
Murnaghan, F. D. (1951), Finite Deformation of an Elastic Solid, John Wiley, New York.
Ni, S., E. Tan, M. Gurnis, and D. Helmberger (2002), Sharp sides to the African superplume, Science, 296(5574), 1850–1852, doi:10.1126/ science.1070698.
Nomura, R., H. Ozawa, S. Tateno, K. Hirose, J. Hernlund, S. Muto, H. Ishii, and N. Hiraoka (2011), Spin crossover and iron-rich silicate melt in the Earth’s deep mantle, Nature, 473(7346), 199–202, doi:10.1038/nature09940.
Nomura, R., K. Hirose, K. Uesugi, Y. Ohishi, A. Tsuchiyama, A. Miyake, and Y. Ueno (2014), Low core-mantle boundary temperature inferred from the solidus of pyrolite, Science, 343(6170), 522–525, doi:10.1126/science.1248186.
Ohtani, E. (1983), Melting temperature distribution and fractionation in the lower mantle, Phys. Earth Planet. Inter., 33(1), 12–25, doi:10.1016/0031-9201(83)90003-1.
Ohtani, E., K. Moriwaki, T. Kato, and K. Onuma (1998), Melting and crystal-liquid partitioning in the system Mg2SiO4-Fe2SiO4to 25 GPa,
Phys. Earth Planet. Inter., 107(1–3), 75–82, doi:10.1016/S0031-9201(97)00125-8.
Ramo, D. M., and L. Stixrude (2014), Spin crossover in Fe2SiO4liquid at high pressure, Geophys. Res. Lett., 41, 4512–4518, doi:10.1002/2014GL060473.
Ricard, Y., E. Mattern, and J. Matas (2005), Synthetic tomographic images of slabs from mineral physics, in Earth’s Deep Mantle: Structure,
Composition, and Evolution, edited by R. D. Van Der Hilst et al., pp. 283–300, AGU, Washington, D. C., doi:10.1029/160GM17
Rigden, S. M., T. J. Ahrens, and E. M. Stolper (1984), Densities of liquid silicates at high pressures, Science, 226(4678), 1071–1074. Sanloup, C., J. W. E. Drewitt, Z. Konôpková, P. Dalladay-Simpson, D. M. Morton, N. Rai, W. van Westrenen, and W. Morgenroth (2013),
Structural change in molten basalt at deep mantle conditions, Nature, 503, 104–107, doi:10.1038/nature12668.
Spear, F. (1993), Metamorphic phase equilibria and pressure-temperature-time paths, in Monograph/Mineralogical Society of America, vol. 1, edited by P. H. Ribbe, Mineral. Soc. Am., Chantilly, Va.
Stixrude, L., and B. Karki (2005), Structure and freezing of MgSiO3liquid in Earth’s lower mantle, Science, 310(5746), 297–299, doi:10.1126/science.1116952.
Stixrude, L., and C. Lithgow-Bertelloni (2005), Thermodynamics of mantle minerals—I. Physical properties, Geophys. J. Int., 162(2), 610–632, doi:10.1111/j.1365-246X.2005.02642.x.
Stixrude, L., N. de Koker, N. Sun, M. Mookherjee, and B. B. Karki (2009), Thermodynamics of silicate liquids in the deep Earth, Earth Planet.
Sci. Lett., 278(3–4), 226–232, doi:10.1016/j.epsl.2008.12.006.
Tarantola, A., and B. Valette (1982), Generalized nonlinear inverse problems solved using the least squares criterion, Rev. Geophys., 20(2), 219–232, doi:10.1029/RG020i002p00219.
Tateno, S., K. Hirose, N. Sata, and Y. Ohishi (2007), Solubility of FeO in (Mg, Fe)SiO3perovskite and the post-perovskite phase transition, Phys.
Earth Planet. Inter., 160, 319–325, doi:10.1016/j.pepi.2006.11.010.
Tateno, S., K. Hirose, and Y. Ohishi (2014), Melting experiments on peridotite to lowermost mantle conditions, J. Geophys. Res. Solid Earth,
119, 4684–4694, doi:10.1002/2013JB010616.
Thomas, C. W., Q. Liu, C. B. Agee, P. D. Asimow, and R. A. Lange (2012), Multi-technique equation of state for Fe2SiO4melt and the density of Fe-bearing silicate melts from 0 to 161 GPa, J. Geophys. Res., 117, B10206, doi:10.1029/2012JB009403.
Tonks, W. B., and H. J. Melosh (1993), Magma ocean formation due to giant impacts, J. Geophys. Res., 98( E3), 5319–5333, doi:10.1029/92JE02726.
Wakabayashi, D., N. Funamori, T. Sato, and T. Sekine (2014), Equation of state for silicate melts: A comparison between static and shock compression, Geophys. Res. Lett, 41, 50–54, doi:10.1002/2013GL058328.
Weidenschilling, S., D. Spaute, D. Davis, F. Marzari, and K. Ohtsuki (1997), Accretional evolution of a planetesimal swarm, Icarus, 128(2), 429–455, doi:10.1006/icar.1997.5747.
![Figure 3. Red: observations [Auzende et al., 2008; Kobayashi et al., 2005] and predictions of K d (bridgmanite-ferropericlase Mg/Fe partitioning)](https://thumb-eu.123doks.com/thumbv2/123doknet/14778917.595283/8.918.286.587.135.349/figure-observations-auzende-kobayashi-predictions-bridgmanite-ferropericlase-partitioning.webp)