HAL Id: hal-00298915
https://hal.archives-ouvertes.fr/hal-00298915
Submitted on 23 Nov 2007HAL is a multi-disciplinary open access
archive for the deposit and dissemination of sci-entific research documents, whether they are pub-lished or not. The documents may come from teaching and research institutions in France or abroad, or from public or private research centers.
L’archive ouverte pluridisciplinaire HAL, est destinée au dépôt et à la diffusion de documents scientifiques de niveau recherche, publiés ou non, émanant des établissements d’enseignement et de recherche français ou étrangers, des laboratoires publics ou privés.
Forecasting land-use change and its impact on the
groundwater system of the Kleine Nete catchment,
Belgium
J. Dams, S. T. Woldeamlak, O. Batelaan
To cite this version:
J. Dams, S. T. Woldeamlak, O. Batelaan. Forecasting land-use change and its impact on the groundwa-ter system of the Kleine Nete catchment, Belgium. Hydrology and Earth System Sciences Discussions, European Geosciences Union, 2007, 4 (6), pp.4265-4295. �hal-00298915�
HESSD
4, 4265–4295, 2007 Impact of land-use change on the groundwater system J. Dams et al. Title Page Abstract Introduction Conclusions References Tables Figures ◭ ◮ ◭ ◮ Back CloseFull Screen / Esc
Printer-friendly Version
Interactive Discussion
EGU
Hydrol. Earth Syst. Sci. Discuss., 4, 4265–4295, 2007 www.hydrol-earth-syst-sci-discuss.net/4/4265/2007/ © Author(s) 2007. This work is licensed
under a Creative Commons License.
Hydrology and Earth System Sciences Discussions
Papers published in Hydrology and Earth System Sciences Discussions are under open-access review for the journal Hydrology and Earth System Sciences
Forecasting land-use change and its
impact on the groundwater system of the
Kleine Nete catchment, Belgium
J. Dams1, S. T. Woldeamlak1, and O. Batelaan1,2
1
Dept. of Hydrology and Hydraulic Engineering, Vrije Universiteit Brussel, Pleinlaan 2, 1050 Brussels, Belgium
2
Dept. Geography-Geology, Katholieke Universiteit Leuven, Celestijnenlaan 200E, 3001 Heverlee, Belgium
Received: 24 October 2007 – Accepted: 31 October 2007 – Published: 23 November 2007 Correspondence to: J. Dams ([email protected])
HESSD
4, 4265–4295, 2007 Impact of land-use change on the groundwater system J. Dams et al. Title Page Abstract Introduction Conclusions References Tables Figures ◭ ◮ ◭ ◮ Back CloseFull Screen / Esc
Printer-friendly Version
Interactive Discussion
EGU
Abstract
Land-use change and climate change, along with groundwater pumping are frequently indicated to be the main human-induced factors influencing the groundwater system. Up till now, research has mainly been focusing on the effect of the water quality of these human-induced changes on the groundwater system, often neglecting changes
5
in quantity. The focus in this study is on the impact of land-use changes in the near fu-ture, from 2000 until 2020, on the groundwater quantity and the general hydrologic bal-ance of a sub-catchment of the Kleine Nete, Belgium. This study tests a new methodol-ogy which involves coupling a land-use change model with a water balance model and a groundwater model. The future land-use is modelled with the CLUE-S model. Four
10
scenarios (A1, A2, B1 and B2) based on the Special Report on Emission Scenarios (SRES) are used for the land-use modelling. Water balance components, groundwa-ter level and baseflow are simulated using the WetSpass model in conjunction with a MODFLOW groundwater model. Results show that the average recharge slowly de-creases for all scenarios, the dede-creases are 2.9, 1.6, 1.8 and 0.8% for respectively
15
scenario A1, A2, B1 and B2. The predicted reduction in recharge results in a small decrease of the average groundwater level, ranging from 2.5 cm for scenario A1 to 0.9 cm for scenario B2, and a reduction of the total baseflow with maximum 2.3% and minimum 0.7% respectively for scenario A1 and B2. Although these average values do not indicate significant changes for the groundwater system, spatial analysis of the
20
changes shows the changes are concentrated in the neighbourhood of the major cities in the study areas. It is therefore important for spatial managers to take the ground-water system into account for reducing the negative impacts of land-use and climate change as much as possible.
HESSD
4, 4265–4295, 2007 Impact of land-use change on the groundwater system J. Dams et al. Title Page Abstract Introduction Conclusions References Tables Figures ◭ ◮ ◭ ◮ Back CloseFull Screen / Esc
Printer-friendly Version
Interactive Discussion
EGU
1 Introduction
Groundwater is a major source of drinking water across the world and plays a vital role in maintaining the ecological value of many areas (Batelaan and De Smedt, 2001; IPCC, 2001). However, the quantity and quality of groundwater are changing as a consequence of human activity (Gehrels et al., 2001) and climate change (IPCC, 2001)
5
jeopardizing the suitability of the groundwater system as a source of drinking water and affecting major natural reserves. Assessing the impact on the groundwater system and predicting the magnitude of change in the future is therefore a major scientific challenge.
Since people started to live in settlements they have adapted the land cover and
10
land-use to their needs. Today not much remains of the original natural land cover of Western Europe, which was mostly forest (Goldewijk, 2004). The original land cover has been replaced by cities, farmlands, industrial sites, roads, canals etc. Furthermore, land-use and land cover change is an ongoing process.
Land-use changes are known to impact the hydrology of the catchment area (Calder,
15
1993; Krause, 2007; Ott and Uhlenbrook, 2004; Ashagrie et al. 2006). However, the quantitative effects of land-use changes on the groundwater system have so far been poorly studied (Batelaan et al. 2003). Until the mid nineties most of the knowledge about the effects of land-use changes on water quantity and quality came from exper-imental catchment studies (Bosch and Hewlett, 1982) and long-term observations of
20
runoff (e.g. Schwarze et al., 1994). Nowadays, the use of distributed hydrological mod-els, which account for the temporal variability and spatial distribution of water balance components, offer increasing opportunities. The main advantage of these models is that they allow water balance components to be predicted on physical grounds. As-suming that the hydrological processes in the study basin will not change in the near
25
future, validated models can be used to assess the impact of changed conditions, such as land-use (Kl ¨ocking, 2002).
HESSD
4, 4265–4295, 2007 Impact of land-use change on the groundwater system J. Dams et al. Title Page Abstract Introduction Conclusions References Tables Figures ◭ ◮ ◭ ◮ Back CloseFull Screen / Esc
Printer-friendly Version
Interactive Discussion
EGU
of their inputs. The WetSpass model (Batelaan and De Smedt, 2001, 2007), used in this study, uses land-use parameters to simulate seasonal and yearly recharge rates, which allows the impact of land-use changes on the groundwater system to be as-sessed.
The impact of land-use changes on the hydrology has been a major hydrological
5
research topic over the last decade (Zang et al., 2001; Bhaduri et al., 2000; Grove et al., 2001; Fohrer et al., 2001; Kim et al., 2002; Tang et al., 2005; Siriwardena et al., 2006; and Lin et al., 2007). Nevertheless, in most of the above mentioned studies the effect on the groundwater system is not investigated or is only a minor component.
Kl ¨ocking and Haberlandt (2002), Batelaan and De Smedt (2001) and Batelaan et
10
al. (2003) are among the few researchers who have focussed on the effect of land-use changes on the groundwater system. Kl ¨ocking and Haberlandt (2002) used the hydro-logical model ArcEGMO to investigate hypothetical land-use change scenarios on the River basins of the Saale and Havel, two main tributaries of the River Elbe, Germany. They found that there was a significant decrease in the mean annual baseflow when
15
arable areas in the basins were reduced and converted to mixed forest. In other tested scenarios the baseflow was relatively constant. Batelaan and De Smedt (2001) and Batelaan et al. (2003) examined the impact of land-use changes on regional ground-water discharge in the Grote Nete River basin (Belgium) by using a combination of the distributed water balance model WetSpass and a MODFLOW groundwater flow model.
20
Batelaan et al. (2003) simulated future use scenarios by looking at planned land-use changes in the basin. A distinction was made between two different regions: re-gions where recharge is expected to decrease in response to increased evapotranspi-ration and shallow subsurface drainage for agricultural improvement (areas earmarked for land-use changes) and regions where recharge is expected to increase as a result
25
of reducing evapotranspiration and runoff (areas earmarked for compensation of the effects of land-use changes). It was concluded that significant changes in groundwater discharge would result from the assessed land-use scenarios. One third of the dis-charge regions would receive less disdis-charge, one third would receive more disdis-charge
HESSD
4, 4265–4295, 2007 Impact of land-use change on the groundwater system J. Dams et al. Title Page Abstract Introduction Conclusions References Tables Figures ◭ ◮ ◭ ◮ Back CloseFull Screen / Esc
Printer-friendly Version
Interactive Discussion
EGU
and one third of the discharge area would remain unaffected.
The improvement of land-use change models combined with developments in hy-drological models allows more realistic predictions of future subsurface hydrology. The aim of this paper is to assess the quantitative change in the water balance components and the groundwater flow on a yearly basis from 2000 until 2020, taking into account
5
realistic land-use change scenarios. A new modelling approach is evaluated for as-sessing the impact of the land-use changes on the groundwater system by coupling a land-use change model (CLUE-S) with a distributed water balance (WetSpass) and a groundwater flow model (MODFLOW). A case study is worked out on a sub-basin of the Kleine Nete basin, Belgium.
10
The groundwater flow is mainly determined by the characteristics of the subsurface, topography and rivers, and by the amount of recharge, which is influenced by numer-ous factors including the amount and intensity of rainfall, soil runoff characteristics, rainfall interception, evapotranspiration, etc. Today, the two major human-induced driv-ing factors of change in recharge and groundwater flow are climate and land cover
15
change. Both land-use and climate changes should be assessed individually and com-bined subsequently to gain insight into their impacts. The aim of this paper is to assess only the impact of the land cover change. This means that all climate variables such as temperature, potential evapotranspiration, wind speed, rainfall, etc. and other factors affecting the hydrology of the catchment have been kept constant.
20
2 Methodology
2.1 Overview
The methodology consists of three parts. In the first part the near future land-use change in the study area is modelled. Yearly land-use maps have been created starting from the original land-use map (2000) until 2020. Next, the future land-use maps are
25
HESSD
4, 4265–4295, 2007 Impact of land-use change on the groundwater system J. Dams et al. Title Page Abstract Introduction Conclusions References Tables Figures ◭ ◮ ◭ ◮ Back CloseFull Screen / Esc
Printer-friendly Version
Interactive Discussion
EGU
Finally, the recharge is used in a steady state MODFLOW model of the study basin to determine the groundwater levels and fluxes. All the models used in this study require spatially distributed raster data; these data have been prepared using ArcView GIS 3. 2. With a grid resolution of 50 by 50 meters. The choice for this resolution is mainly based on the arguments that with this resolution still the whole catchment can be modelled
5
as well as the fact that 50 m resolution provides reasonable homogeneous land use classes.
2.2 Modelling land-use change
The land-use change model, Conversion of Land-Use and its Effects at Small regional extent (CLUE-S) (Verburg, 1999), is used to simulate future land-use change. The
10
CLUE-S model is an empirical based model developed at the University of Wageningen in the Netherlands. The model attempts to identify causes of land cover changes (driving forces), using a multivariate analysis on the possible contributors, to empirically derive rates of change (Verburg et al., 1999). The CLUE-S model has been chosen for the land-use modelling in this study based on the selection criteria developed by the
15
US Environmental Protection Agency (US EPA, 2000). The most important reasons for choosing this model were: the flexibility on the input data (driving forces), the possibility of linking the output to the WetSpass model and free access to the model.
The CLUE-S modelling procedure consists of two parts; a non-spatial analysis part with a land-use demand module and a spatial analysis part with a land-use allocation
20
module. The land-use demand data (2000–2020) of the study region needed for the non-spatial analysis part in the CLUE-S model is obtained using the present land-use in combination with the European trend calculated in the EURURALIS project (Klijn et al., 2005). The EURURALIS project is a European project whose aim is to guide European policy makers in taking decisions for the future of agriculture in Europe. In
25
this project, the land-use demand for different land-use classes is calculated for the whole of Europe using a combination of the LEITAP model, an adapted version of the Global Trade Analysis Project (GTAP), and the Integrated Model to Assess the Global
HESSD
4, 4265–4295, 2007 Impact of land-use change on the groundwater system J. Dams et al. Title Page Abstract Introduction Conclusions References Tables Figures ◭ ◮ ◭ ◮ Back CloseFull Screen / Esc
Printer-friendly Version
Interactive Discussion
EGU
Environment (IMAGE) (Klijn et al., 2005).
In order to incorporate some of the uncertainties faced in land-use modelling, a mul-tiple scenario approach is used based on the Special Report on Emission Scenarios (SRES) developed by the Intergovernmental Panel on Climate Change (Masui et al., 2001). Four scenarios are assumed: A1 a global economic scenario, A2 a local
eco-5
nomic scenario, B1 a global environmental scenario and B2 a local environmental sce-nario (Carter et al., 2001). It should be noted that although these are climate based scenarios, they do not include climate change itself in this study.
For the land-use change allocation procedure four inputs are required: spatial poli-cies and restrictions, land-use type specific conversion settings, location characteristics
10
and future land-use requirements.
In the input section “spatial policy and restrictions” of the CLUE-S model, areas that are protected for nature conservation can be indicated for the exclusion of certain forms of use change in those areas. For this study, forest, heather and meadow land-use types are not allowed to change to urban, industrial or agricultural land-land-use types
15
if they are situated in the areas protected for nature conservation.
The input section “land-use type specific conversion settings” characterize the re-versibility of a certain land-use change. Conversion settings in this study are based on data described in the Verburg et al. (2004).
The driving forces behind the allocation of land-use changes used in this study are
20
soil type, topography, slope, groundwater depth, distances to major cities and distance to major roads and cannels. In order to calculate the location characteristics for the different pixels a logistic regression is performed for each land-use type, using present land-use as dependent variable and driving forces as independent variables. Next, the coefficients obtained from the logistic regression are imported into the CLUE-S model.
25
Finally, land-use requirements, calculated in the non-spatial analysis part, serve as the last input for the allocation procedure of the CLUE-S model.
The allocation procedure of the CLUE-S model is shown in Fig. 2. The first step is the determination of the grid cells that are allowed to change using the spatial policies
HESSD
4, 4265–4295, 2007 Impact of land-use change on the groundwater system J. Dams et al. Title Page Abstract Introduction Conclusions References Tables Figures ◭ ◮ ◭ ◮ Back CloseFull Screen / Esc
Printer-friendly Version
Interactive Discussion
EGU
and conversion settings. In the next step, the total probability for each of the land-use types for all grid cells is calculated. This is done by taking the summation of the suit-ability of each grid cell for a certain land-use type (based on the logistic regression), the conversion elasticity for that land-use type and an iteration variable indicating the relative competitive strength of the land-use type. In the third step a preliminary
allo-5
cation is made using the same iteration variable for all land-use types. Lastly, the total allocated area of each land-use type from the third step is compared to the land-use requirements (demand). If the allocated area is smaller than the demand, the iteration value for that land-use is increased. If the allocated area is greater than the demand the iteration value is decreased. Steps two to four are repeated until the demand is
10
equal to the area allocated.
2.3 Recharge and groundwater modelling
Groundwater recharge, actual evapotranspiration and surface runoff is simulated with the distributed Water and Energy Transfer between Soil, Plants and Atmosphere un-der quasi-Steady State model (WetSpass) (Batelaan and De Smedt, 2001, 2007).
15
The model takes into account distributed soil, land-use, slope, groundwater depth and hydro-climatological maps with associated parameter tables.
Groundwater recharge is simulated in WetSpass as the residual term of the water balance:
R = P − S − ET − E − I (1)
20
where R is groundwater recharge [LT−1
], P is the average seasonal precipitation [LT−1
],
S is runoff over land surface [LT−1], E T is the actual evapotranspiration [LT−1], E is
evaporation from the bare soil [LT−1] and I is the interception by vegetation [LT−1].
Finally, the groundwater system is modelled by applying the USGS modular three-dimensional finite difference groundwater model (MODFLOW) (Harbaugh and
McDon-25
ald, 2000). Because the aim is to assess the long term effect of land-use change on the groundwater levels and fluxes, a steady state MODFLOW model of the study basin is
HESSD
4, 4265–4295, 2007 Impact of land-use change on the groundwater system J. Dams et al. Title Page Abstract Introduction Conclusions References Tables Figures ◭ ◮ ◭ ◮ Back CloseFull Screen / Esc
Printer-friendly Version
Interactive Discussion
EGU
used. A steady state is modelled for each year from 2000 until 2020. Each steady state represents the equilibrium condition assuming the recharge derived from the WetSpass model incorporating the future land-use simulated for that particular year.
The groundwater model developed for this study is adapted from the Flemish Groundwater Model of the Nete basin (Meyus et al., 2004; Verbeiren et al., 2006).
5
The conceptual model schematizes the Quaternary and Tertiary sediments in two lay-ers; these sediments are limited at the bottom by the Boom clay aquitard. The top layer of the model combines Quaternary and Tertiary layers except the Miocene aquifer sys-tem, while the bottom layer is solely represented by the Miocene aquifer system. The outer boundaries of the model are set to no-flow conditions, as they coincide with the
10
groundwater divides modelled by Verbeiren et al. (2006). After calibration the optimized hydraulic conductivity ranges between 0.1–20.5 m/d for the top layer, and 6.1 m/d for the bottom layer. The calibrated groundwater model shows a mean absolute error of 0.41 m, a root mean square error of 0.51 m, and a model efficiency of 0.996 between observed and simulated groundwater levels. This shows that the model is performing
15
well.
The different yearly recharge maps simulated with the WetSpass model and us-ing the modelled future land-use maps are parameterizus-ing the MODFLOW models. For each simulated year between 2000 and 2020, the MODFLOW output includes the groundwater head, budget and flow direction maps for the two layers.
20
3 Study area
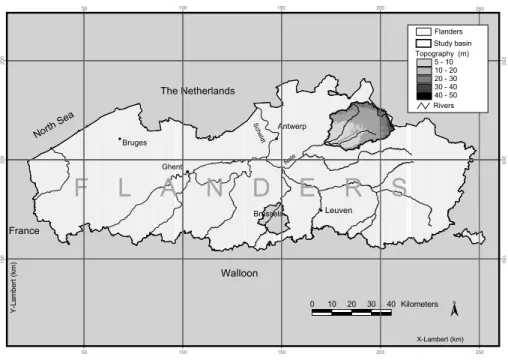
The study area is located in Belgium about 60 km north-east of Brussels (Fig. 3). It comprises 581 km2 and covers a major part of the Kleine Nete basin. Geologically, it belongs to the Campine basin, a subsidence area north of the Massive of Brabant (Wouters and Vandenberghe, 1994). From the Late Cretaceous until the end of the
Ter-25
tiary, the basin went through a subsidence period with deposits of marine sediments. During the early Oligocene, the Clay of Boom was deposited; this heavy clay layer is
HESSD
4, 4265–4295, 2007 Impact of land-use change on the groundwater system J. Dams et al. Title Page Abstract Introduction Conclusions References Tables Figures ◭ ◮ ◭ ◮ Back CloseFull Screen / Esc
Printer-friendly Version
Interactive Discussion
EGU
considered to be the base of the aquifer system. In the Miocene period, the Formation of Berchem and Diest were deposited in a marine environment. During the Pliocene, the study area was dominated by a shallow marine environment, resulting in the sand deposits of Kattendijk and Kasterlee. During the Quaternary, the sea level decreased and sand sediments were deposited by the River Rhine. In the north of the study area,
5
these sands were covered by the Complex of the Campine, a complex of fine sand with clay layers. During the late Pleistocene, the study area was covered by an eolian sand and loess layer of about two meters thick. Finally, during the Holocene, the existing river valley was filled with fluvial sediments with an average thickness of one meter.
The basin has a gradually decreasing slope from the Campine plateau, where the
10
Kleine Nete has its origin, situated north-east of the study area to the mouth of the Nete River in the south-west (Fig. 3). The elevation above sea level ranges from 3 to 48 meters, the average elevation is about 24 meters, the average slope 0.4%. In-terfluves are slightly elevated, the valleys broad and swampy (Wouters and Vanden-berghe, 1994). The average precipitation in the area is around 840 mm/y. The
domi-15
nant soil type is sand, though in the valleys some loamy sand, sandy loam and sandy clay is present. In 2000, the land-use of the study area consisted of 38% agriculture, 19% meadow, 16% coniferous forest, 11% urban, 7% deciduous forest, 4% mixed for-est, 2% open water, 1% heather and 2% other (OC GIS-Vlaanderen, 2001).
4 Results and discussion
20
4.1 Land-use modelling
Based on the most recent land-use map of the study area (2000), future European land-use demands calculated in the EURURALIS project (Klijn et al., 2005), and in-corporating the four scenarios, the future land-use changes for the study basin have been determined. Results are presented in Table 1. All scenarios predict an increase
25
HESSD
4, 4265–4295, 2007 Impact of land-use change on the groundwater system J. Dams et al. Title Page Abstract Introduction Conclusions References Tables Figures ◭ ◮ ◭ ◮ Back CloseFull Screen / Esc
Printer-friendly Version
Interactive Discussion
EGU
All scenarios also predict a decrease in agricultural land-use; the maximum change is predicted for scenario A1, and the minimum for scenario A2. Forest and meadow land-use areas increase except for respectively scenario A2 and A1. In this study, the change in land-use demand is assumed to be linear over the modelled 20 yrs.
The land-use maps are created using the CLUE-S model. Fig. 4b–e shows
respec-5
tively the land-use maps for scenario A1, A2, B1 and B2 for the year 2020. It can be observed that the increase in urban area is mainly situated close to existing city cen-tres. The results also show that the increase in forest area predicted in scenario B1 and B2 is mainly situated in the eastern part of the study area.
4.2 Present water balance
10
The minimum, maximum, average and standard deviation of the recharge, evapotran-spiration and runoff fluxes are given in Table 2. The yearly fluxes are a summation of the summer and winter results.
Table 2 shows that the yearly simulated runoff is between 0 and 660 mm. Com-paring the runoff map from WetSpass with the land-use map, it becomes clear that
15
land-use greatly affects the runoff. Most of the pixels in the basin have a runoff value between 0 and 20 mm/yr. Build up and industry typically have a runoff between 160 and 250 mm/yr; rivers and lakes between 315 and 570 mm/yr; and the highest runoff, between 570 and 660 mm/yr, is obtained in some pixels with city centre build up or in some groundwater discharge areas.
20
Evapotranspiration (E T ) is the most important component of the water balance. WetSpass estimates the E T in the basin as 54.5% of the total precipitation. Most E T in the basin occurs during summer (62%) when the average temperature is higher than in winter (14.1 compared to 5.0◦C). In relation to land-use, the highest values for E T
are found for open waters, followed by (wet) meadow and forest areas. Lower values
25
for E T are found in residential and industrial areas. Agricultural areas generally have an E T situated midway between meadow and residential E T . The E T of vegetation on loamy sand is generally higher than for a sand soil.
HESSD
4, 4265–4295, 2007 Impact of land-use change on the groundwater system J. Dams et al. Title Page Abstract Introduction Conclusions References Tables Figures ◭ ◮ ◭ ◮ Back CloseFull Screen / Esc
Printer-friendly Version
Interactive Discussion
EGU
The average yearly recharge is estimated as 292 mm/year. From this yearly recharge, only 10 mm occurs during summer; all remaining recharge occurs during winter time. During summer negative recharge values are observed because discharge from groundwater to land surface in valley areas is counted as negative recharge. Hence, in these valleys vegetation is able to maintain a higher E T by pumping up
5
groundwater. Discharge areas cover about 10% of the basin and have an average dis-charge of 314 mm/yr. Large parts of the disdis-charge areas correspond to depressions and valleys; at these places average rates of 4 mm/day are calculated. Rates of about 25 mm/day are restricted to the river networks. Industrial and residential areas have a recharge between 240 and 320 mm/yr. Agricultural areas and forests have a recharge
10
between 320 and 450 mm/yr. When discharge is excluded, the areal average recharge is 312 mm/yr, or about 37% of the annual precipitation.
4.3 Future water balance due to changing land-use
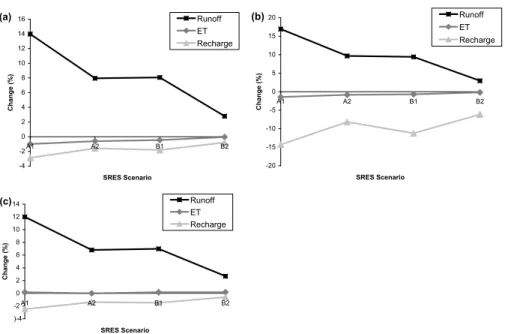
The summer, winter and yearly water balances are modelled for the four different sce-narios using the future land-use maps in the WetSpass model. The results for the year
15
2020 are shown in Fig. 5, the percentages indicate the change from 2000 to 2020. For all scenarios an increase of yearly runoff occurs. However scenario A1 has the largest impact on the water balance with an increase of 14%, while scenario B2 has the smallest increase (2.8%). Scenarios A2 and B1 both have an increase in runoff of approximately 8%. The increase in runoff is slightly higher during the summer if
20
compared with the increase in runoff during the winter.
A very small decrease of the average evapotranspiration is calculated in all scenarios (all smaller than 1%) as a consequence of a small decrease during the summer and an even smaller increase during the winter.
The impact of the land-use changes on the recharge is one of the key factors in
25
this study. The predicted decrease in average recharge is with 2.9% also highest for scenario A1. Scenarios A2, B1 and B2 have an average recharge decrease of respectively 1.6, 1.8 and 0.8%.
HESSD
4, 4265–4295, 2007 Impact of land-use change on the groundwater system J. Dams et al. Title Page Abstract Introduction Conclusions References Tables Figures ◭ ◮ ◭ ◮ Back CloseFull Screen / Esc
Printer-friendly Version
Interactive Discussion
EGU
Comparing Fig. 5b and 5c shows that recharge decreases more during the summer than during the winter. A closer look at this difference confirms that recharge decreases and that discharge, calculated as negative groundwater recharge, remains more or less constant.
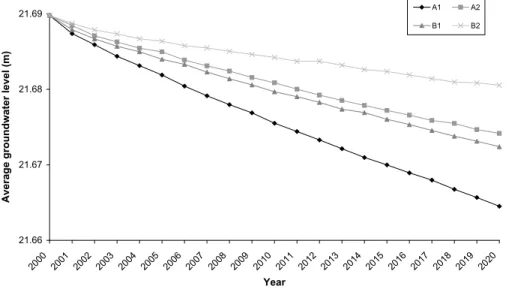
4.4 Changes in the groundwater system
5
The results of the MODFLOW model show a decrease in average groundwater level for all four scenarios. A comparison between the different scenarios is shown in Fig. 6. The decrease is maximum for scenario A1, i.e. 2.5 cm over the 20 yrs. Scenario B2 predicts the lowest decrease: 9 mm. For scenario A2 and B1, the decrease is moderate with respectively 16 and 17 mm. Again these decreases are almost linear in time.
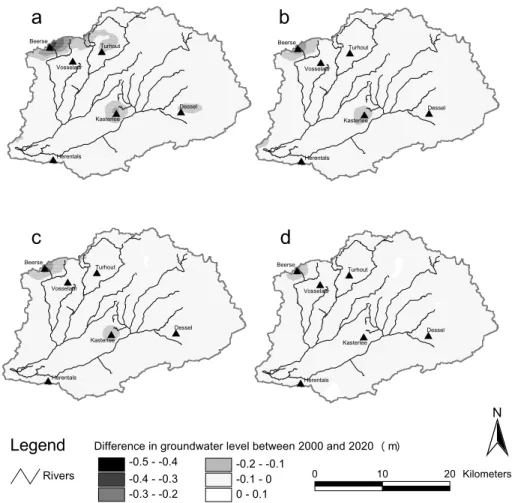
10
Figure 7 shows the spatial distribution of the difference in groundwater level due to land-use change in 2020. It can be noted that around cities, where the urbanization is high, the decrease in groundwater level is also relatively high. For other places in the basin, the decrease in groundwater level is limited and more or less equally distributed. The maximum modelled decrease is 0.45 meter. Scenario A1 shows a high decrease in
15
the area around the cities of Beerse and Vosselaar, in the north-west of the basin, and around the city of Kasterlee, in the centre of the study basin. Clearly, the groundwater level in these regions is sensitive to land-use changes. A relatively high decrease is also found around the city of Turnhout, in the north, and the city of Dessel in the East of the study basin.
20
Table 3 presents the fluxes into and out of the saturated zone, and the baseflow calculated as the sum of the drains and river leakage out of the saturated zone.
The baseflow in 2000 is simulated as 314 mm/yr and consists of 103 mm (33%) dif-fuse groundwater discharge (simulated by the drains) and 211 mm (67%) of groundwa-ter discharge into the river system.
25
It should be noted that the recharge out of the saturated zone remains almost con-stant for all the scenarios. The amount of drainage decreases for all scenarios with a maximum decrease for scenario A1 (3 mm in 20 yrs). Similarly, the amount of
ground-HESSD
4, 4265–4295, 2007 Impact of land-use change on the groundwater system J. Dams et al. Title Page Abstract Introduction Conclusions References Tables Figures ◭ ◮ ◭ ◮ Back CloseFull Screen / Esc
Printer-friendly Version
Interactive Discussion
EGU
water discharge into the rivers decreases for all scenarios; the highest decrease is again found for scenario A1 (5 mm in 20 yrs). As a consequence of the changing land-use, the amount of baseflow is decreasing. The highest decrease is predicted by scenario A1 (7 mm in 20 yrs); scenarios A2, B1 and B2 respectively predict a decrease of 4, 5 and 2 mm in the 20 yrs.
5
4.5 Comparing the different scenarios
Scenario A1, representing a global-economic future, predicts an increase in urban and forest areas, by 58 and 2% respectively, and a decrease in agricultural and meadow areas, by 18 and 6% respectively from 2000 to 2020. This scenario predicts the highest impact on recharge in the basin. The yearly recharge decrease, calculated as 2.9%
10
over the 20-year-period that is modelled, is mainly caused by an increase in urban runoff. The decrease in recharge is a result of a 14.3% decrease during summer and 2.5% during winter. The baseflow will be reduced by 2.3% and the groundwater head by 2.5 cm, if scenario A1 materializes.
Scenario A2 represents a local-economic future and forecasts an increase in urban
15
and meadow areas by 32 and 1% respectively, and a reduction in agricultural and forest land-uses by 8 and 5% respectively over the modelled 20 yrs. The recharge during summer decreases by 8.2%, while the recharge during winter only decreases by 1.4%, the yearly recharge reduces by 1.6%. Finally, this decrease in recharge would reduce the baseflow by 1.3% and the groundwater level by 1.6 cm.
20
Scenario B1 symbolizes a global-environmental future. The calculated land-use changes produce more urban and forest areas, respectively 34 and 8%, and 17% less agriculture from 2000 to 2020. The impact on the subsurface hydrology of scenario B1 is comparable to the impact of scenario A2. The yearly recharge reduces by 1.8%; the reduction during summer and winter is 11.2 and 1.5% respectively. The baseflow
25
shrinks by 1.5%, the groundwater level by 1.7 cm.
Finally, scenario B2 stands for a local-environmental future. This scenario has the smallest impact on land-use and on the hydrologic characteristics of the basin when
HESSD
4, 4265–4295, 2007 Impact of land-use change on the groundwater system J. Dams et al. Title Page Abstract Introduction Conclusions References Tables Figures ◭ ◮ ◭ ◮ Back CloseFull Screen / Esc
Printer-friendly Version
Interactive Discussion
EGU
compared with the other scenarios. Urban, meadow and forest areas are expected to increase by respectively 14, 3 and 10%. Agricultural areas are assumed to decrease by almost 13%. This results in a yearly recharge decrease of 1%, 6% during summer and 0.6% during winter. The baseflow declines by 0.7%, the groundwater level by 0.9 cm.
5 Conclusions
5
This study simulates the effects of future land-use change until the year 2020 on the groundwater system and water balance of the Kleine Nete sub-catchment. Four sce-narios (A1, A2, B1 and B2) based on the widely used Special Report on Emission Scenarios (SRES) are considered. Future land-use demands are calculated based on the current situation and future European trend calculated in the EURURALIS project
10
(Klijn et al., 2005). A coupling of the CLUE-S, WetSpass and MODFLOW models is used. The CLUE-S model (Verburg, 1999) is used for the spatial allocation of the dif-ferent land-use demands in the sub-catchment. The distributed recharge is modelled with WetSpass (Batelaan and De Smedt, 2001, 2007), which has land-use as one of its inputs. Finally, the distributed recharge is used in a MODFLOW groundwater model
15
set up for the sub-catchment (Woldeamlak, 2006) to calculate head differences and baseflow.
The compatibility of the WetSpass and MODFLOW models had already been demonstrated by Batelaan and De Smedt (2003). This study shows that land-use change models, such as the CLUE-S model, are valuable tools to assess the
hydrolog-20
ical impact of land-use change. The WetSpass model shows its ability to link land-use change models to steady state groundwater models developed in MODFLOW. Further-more, the analysis of the water balance modelled with WetSpass provides very useful information on the impact of land-use changes on the hydrology of the basin.
The most important results with respect to the impact on the groundwater system are
25
summarized in Table 3. Some caution should be considered when evaluating these re-sults. The land-use, soil and runoff parameters and coefficients used in the WetSpass
HESSD
4, 4265–4295, 2007 Impact of land-use change on the groundwater system J. Dams et al. Title Page Abstract Introduction Conclusions References Tables Figures ◭ ◮ ◭ ◮ Back CloseFull Screen / Esc
Printer-friendly Version
Interactive Discussion
EGU
model determining the amount of impervious, vegetated, bare, etc. area for the dif-ferent land-use classes are considered constant in this study. Future changes in, for example, urban structure or agriculture caused by new architectural trends or agricul-tural management practices could have an impact on the recharge in the basin. In this study, only changes in land-use classes are considered.
5
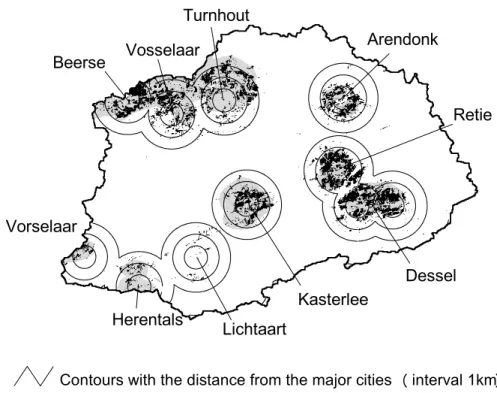
The results of this study show that the effects of land-use changes from 2000 un-til 2020 on the groundwater system are on average relatively small. However, the changes are concentrated around certain cities. Figure 8 presents the spatial distribu-tion of areas with a groundwater decrease of more than 5 cm, the locadistribu-tion of new urban areas predicted for scenario A1 and the distance to major cities in the study area. The
10
figure clearly shows that almost all groundwater decreases of more than 5 cm are situ-ated within a distance of 3 km from major city centres. Also, almost all new urban areas are predicted within the same perimeter.
The results also indicate a considerable difference between the response of the sum-mer and winter recharge on land-use changes. This could lead to higher groundwater
15
fluctuations affecting the availability of groundwater during summer especially in the vicinity of expanding cities.
Finally, it can be concluded that although, on average, changes in groundwater level and flux are not very large. However, in the neighbourhood of urban areas the effects of land-use changes on the groundwater system are considerable and deserve necessary
20
pro-active planning for compensation of the negative effects.
References
Ashagrie, A. G., de Laat, P. J. M., de Wit, M. J. M., Tu, M., and Uhlenbrook, S.: Detecting the influence of land use changes on the discharges and floods in the Meuse River Basin – the predictive power of a ninety-year rainfall-runoff relation?, Hydrol. Earth Syst. Sci., 10,
25
691–701, 2006,
HESSD
4, 4265–4295, 2007 Impact of land-use change on the groundwater system J. Dams et al. Title Page Abstract Introduction Conclusions References Tables Figures ◭ ◮ ◭ ◮ Back CloseFull Screen / Esc
Printer-friendly Version
Interactive Discussion
EGU
Batelaan, O. and De Smedt, F.: GIS-based recharge estimation by coupling surface-subsurface water balances, J. Hydrol., 337(3-4), 337–355, 2007.
Batelaan, O. and De Smedt, F.: WetSpass: a flexible, GIS based, distributed recharge method-ology for regional groundwater modelling, in: Impact of Human Activity on Groundwater Dy-namics, edited by: Gehrels, H., Peters, J., Hoehn, E., Jensen, K., Leibundgut, C., Griffioen,
5
J., Webb, B., and Zaadnoordijk, W-J., IAHS Publ. No. 269, 11–17, 2001.
Batelaan, O., De Smedt, F., and Triest, L.: Regional groundwater discharge: phreatophyte mapping, groundwater modelling and impact analysis of land-use change, J. Hydrol., 275(1– 2), 86–108, 2003.
Bhaduri, B., Harbor, J., Engel, B. A., and Grove, M.: Assessing watershed-scale, long-term
10
hydrologic impacts of land use change using a GIS-NPS model, Environ. Manage., 26(6), 643–658, 2000.
Bosch, J. M. and Hewlett, J. D.: A review of catchment experiments to determine the effect of vegetation changes on water yield and evapotranspiration, J. Hydrol., 55(1–4), 3–23, 1982. Calder, I. R.: Hydrologic effects of land-use change, in: Handbook of hydrology, edited by:
15
Maidment, D. R., McGraw-Hill, New York, USA, 13.1–13.50, 1993.
Carter, T. R., La Rovere, E. L., Jones, R. N., Leemans, R., Mearns, L. O., Nakicenovic, N., Pittock, A. B., Semenov, S. M., and Skea, J., 2001, Chapt. 3: Developing and applying scenarios, in: Climate change 2001: impacts, adaptation and vulnerability, IPCC Third as-sessment report WG2, edited by: McCarthy, J., Canziani, O., Leary, N. A., Dokken, D. J.,
20
and White, K. S., 145–190, Cambridge University Press, Cambridge, UK, 2001.
Fohrer, N., Haverkamp, S., Eckhardt, K., and Frede, H.-G.: Hydrologic response to Land use changes on the catchment scale, Phy. Chem. Earth, 26(7–8), 577–582, 2001.
Gehrels, H., Peters, N. E., Hoehn, E., Jensen, K., Leibundgut, C., Griffioen, J., Webb, B., and Zaadnoordijk, W.-J. (Eds.): Impacts of human activity on groundwater dynamics, IAHS Publ.
25
No 269, 2001.
Goldewijk, K. K. and Ramankutty N.: Land cover change over the last three centuries due to human activities: The availability of new global data sets, GeoJournal, 61, 335–344, 2004. Grove, M., Harbor, J., Engel, B., and Muthukrishnan, S.: Impacts of urbanization on surface
hydrology, Little Eagle Creek, Indiana, and analysis of L-THIA model sensitivity to data
res-30
olution, Phys. Geogr., 22, 135–153, 2001.
Harbaugh, A. W. and McDonald, M. G.: MODFLOW-2000, The U.S. Geological Survey mod-ular groundwater model – User guide to modmod-ularization concepts and the groundwater flow
HESSD
4, 4265–4295, 2007 Impact of land-use change on the groundwater system J. Dams et al. Title Page Abstract Introduction Conclusions References Tables Figures ◭ ◮ ◭ ◮ Back CloseFull Screen / Esc
Printer-friendly Version
Interactive Discussion
EGU
process, U.S. Geological Survey, Reston, Virginia, USA, Open File Rep. 00–92, 121 pp., 2000.
IPCC: Climate Change 2001: The Scientific Basis. Contribution of Working Group I to the Third Assessment Report of the Intergovernmental Panel on Climate Change, edited by: Houghton, J. T., Ding, Y., Griggs, D. J., Noguer, M., van der Linden, P. J., Dai, X., Maskell,
5
K., and Johnson, C. A., Cambridge University Press, Cambridge, United Kingdom and New York, NY, USA, 881 pp., 2001.
Kim, Y., Engel, B. A., Lim, K. J., Larson, V., and Duncan, B.: Runoff impacts of land-use change in Indian River Lagoon watershed, J. Hydrol. Eng., 7(3), 245–251, 2002.
Klijn, J. A., Vullings, L. A. E., v.d. Berg, M., van Meijl, H., van Lammeren, R., van Rheenen,
10
T., Tabeau, A. A., Veldkamp, A., Verburg, P. H., Westhoek, H., and Eickhout, B., The EURU-RALIS study: Technical document, Wageningen, The Netherlands, Alterra, Alterra-rapport 1196, 215 pp., 2005.
Kl ¨ocking, B. and Haberlandt, U.: Impact of land use changes on water dynamics – a case study in temperate meso and macroscale river basins, Phys. Chem. Earth, 27, 619–629, 2002.
15
Krause, S., Jacobs, J., and Bronstert, A.: Modelling the impacts of land-use and drainage density on the water balance of a lowland-floodplain landscape in northeast Germany, Ecol. Model., 200(3–4), 475–492, 2007.
Lin, Y. P., Hong, N. M., Wu, P. J., Wu, C. F., and Verburg, P. H.: Impacts of land use change scenarios on hydrology and land use patterns in the Wu-Tu watershed in Northern Taiwan,
20
Landscape Urban Plan., 80, 111–126, 2007.
Masui, T., Matsuoka, Y., Morita, T., Kainuma, M., and Takahashi, K.: Development of Land Use Model for IPCC New Emission Scenarios (SRES), in: Present and Future of Modeling Global Environmental Change, Toward Integrated Modeling, edited by: Matsuno T. and Kida H., ISBN 4-88704-127-6, Terra Scientific Publishing Company, Tokyo, Japan, 441–448, 2001.
25
Meyus, Y., Adyns, D., Severyns, J., Batelaan, O., and De Smedt, F.: Development of regional models in requirement of the Flemish Groundwater Model in GMS/MODFLOW. Parcel 1: The central Campine model (In Dutch), in: Report part 1: Basic data and conceptual model (In Dutch), Ministry of the Flemish government, Departement Leefmilieu en Infrastructuur, Ad-ministratie Milieu, Natuur, Land- en Waterbeheer, Afdeling Water (currently Vlaamse Milieu
30
Maatschappij, Afdeling Water), 131 pp., 2004.
OC GIS-Vlaanderen: Digital version of Land-cover data set of Flanders 2001, Agentschap voor Geografische Informatie Vlaanderen, Ghent, Belgium, 2001.
HESSD
4, 4265–4295, 2007 Impact of land-use change on the groundwater system J. Dams et al. Title Page Abstract Introduction Conclusions References Tables Figures ◭ ◮ ◭ ◮ Back CloseFull Screen / Esc
Printer-friendly Version
Interactive Discussion
EGU
Ott, B. and Uhlenbrook, S.: Quantifying the impact of land-use changes at the event and sea-sonal time scale a process-oriented catchment model, Hydrol. Earth Syst. Sci., 8, 62–78, 2004,
http://www.hydrol-earth-syst-sci.net/8/62/2004/.
Schwarze, R., Herrmann, A., and Mendel, O.: Regionalization of runoff components for central
5
European basins, in: FRIEND; Flow Regimes from International Experimental and Network Data, Proceeding Braunschweig Conference, October 1993, edited by: Seuna, P., Gustard, A., Arnell, N. W., and Cole, G. A., AHS Publ. No. 221, 493–502, 1994.
Siriwardena, L., Finlayson, B. L., and McMahon, T. A.: The impact of land use change on catchment hydrology in large catchments: The Comet River, Central Queensland, Australia,
10
J. Hydrol., 326, 199–214, 2006.
Tang, Z., Engel, B. A., Pijanowski, B. C., and Lim, K. J.: Forecasting land use change and its environmental impact at a watershed scale, J. Environ. Manage., 76, 35–45, 2005.
US EPA: Projecting Land-use change: summary of models for assessing the effects of commu-nity growth models and change of land use patterns, United States Environmental Protection
15
Agency, Washington, United States of America, EPA/600/R-00/098, September 2000. Verbeiren, B., Batelaan, O., and De Smedt, F.: Development of Regional Models for the
Flan-ders Groundwater Model in GMS/MODFLOW. Part 1: Central Campine System (In Dutch), in: Report part 2: Building up the groundwater model, sensitivity analysis and calibration (In Dutch), Ministry of the Flemish government, Departement Leefmilieu en Infrastructuur,
Ad-20
ministratie Milieu, Natuur, Land- en Waterbeheer, Afdeling Water (currently Vlaamse Milieu Maatschappij, Afdeling Water), 60 pp., 2006
Verburg, P. H., Mastura, S. S. A., Soepboer, W., Veldkamp, A., Limpiada, R., and Espaldon, V.: Modelling the spatial dynamics of regional land use: the CLUE-S Model, Environ. Manage., 30(3), 391–405, 1999.
25
Verburg, P. H., Veldkamp, T., Overmars, K., Lesschen, J. P., and Kok, K.: Manual for the CLUE-S model, Wageningen University, The Netherlands, 47 pp., available at: http://www.
cluemodel.nl, 2004.
Woldeamlak, S. T.: Modelling the impact of climate and land-use change on catchment hydrol-ogy using distributed modelling approach and GIS, Ph.D. thesis, Department of Hydrolhydrol-ogy
30
and Hydraulic Engineering, Vrije Universiteit Brussel, Belgium, 2006.
Wouters, L. and Vandenberge, N.: Geology of the Kempen: a synthesis (In Dutch), Nationale instelling voor radio-actief afval en verrijkte splijtstoffen (NIRAS) 94-11, Brussels, Belgium,
HESSD
4, 4265–4295, 2007 Impact of land-use change on the groundwater system J. Dams et al. Title Page Abstract Introduction Conclusions References Tables Figures ◭ ◮ ◭ ◮ Back CloseFull Screen / Esc
Printer-friendly Version
Interactive Discussion
EGU
208 pp., 1994.
Zhang, L., Dawes, W. R., and Walker, G. R.: Response of mean annual ET to vegetation changes at catchment scale, Water Resour. Res., 37(3), 701–708, 2001.
HESSD
4, 4265–4295, 2007 Impact of land-use change on the groundwater system J. Dams et al. Title Page Abstract Introduction Conclusions References Tables Figures ◭ ◮ ◭ ◮ Back CloseFull Screen / Esc
Printer-friendly Version
Interactive Discussion
EGU
Table 1. Land use change in the study area from 2000 until 2020 for four SRES development
scenarios A2, A2, B1 and B2.
Land use change (%)
Urban Agriculture Forest Meadow Scenario A1 +58 −18 +2 −6 Scenario A2 +32 −8 −5 +1 Scenario B1 +34 −17 +8 +0 Scenario B2 +14 −13 +10 +3
HESSD
4, 4265–4295, 2007 Impact of land-use change on the groundwater system J. Dams et al. Title Page Abstract Introduction Conclusions References Tables Figures ◭ ◮ ◭ ◮ Back CloseFull Screen / Esc
Printer-friendly Version
Interactive Discussion
EGU
Table 2. Runoff, actual evapotranspiration and recharge yearly, summer and winter water
balance components for the Kleine Nete Basin for the year 2000.
Yearly
Average Minimum Maximum Standard deviation (mm) (mm) (mm) (mm)
Runoff 93 1 656 168
Actual evapotranspiration 462 260 672 68 Recharge 292 −342 476 186
Summer
Average Minimum Maximum Standard deviation (mm) (mm) (mm) (mm)
Runoff 37 0 290 70
Actual evapotranspiration 345 144 555 66 Recharge 10 −360 116 88
Winter
Average Minimum Maximum Standard deviation (mm) (mm) (mm) (mm)
Runoff 56 0 382 111
Actual evapotranspiration 117 98 143 9 Recharge 283 −29 379 113
HESSD
4, 4265–4295, 2007 Impact of land-use change on the groundwater system J. Dams et al. Title Page Abstract Introduction Conclusions References Tables Figures ◭ ◮ ◭ ◮ Back CloseFull Screen / Esc
Printer-friendly Version
Interactive Discussion
EGU
Table 3. Budget of MODFLOW (mm/year).
2000 2020 A1 A2 B1 B2 IN RIVER LEAKAGE 56 57 56 56 56 RECHARGE 313 304 308 307 310 OUT WELLS 34 34 34 34 34 DRAINS 103 101 102 102 102 RIVER LEAKAGE 211 206 208 208 209 RECHARGE 20 20 20 20 20 BASE FLOW 314 307 310 309 312
HESSD
4, 4265–4295, 2007 Impact of land-use change on the groundwater system J. Dams et al. Title Page Abstract Introduction Conclusions References Tables Figures ◭ ◮ ◭ ◮ Back CloseFull Screen / Esc
Printer-friendly Version
Interactive Discussion
EGU
HESSD
4, 4265–4295, 2007 Impact of land-use change on the groundwater system J. Dams et al. Title Page Abstract Introduction Conclusions References Tables Figures ◭ ◮ ◭ ◮ Back CloseFull Screen / Esc
Printer-friendly Version
Interactive Discussion
EGU
HESSD
4, 4265–4295, 2007 Impact of land-use change on the groundwater system J. Dams et al. Title Page Abstract Introduction Conclusions References Tables Figures ◭ ◮ ◭ ◮ Back CloseFull Screen / Esc
Printer-friendly Version Interactive Discussion EGU # # # #
F L A N D E R S
Nete Brussels Scheldt Antwerp Bruges Ghent Leuven Walloon France North Sea The Netherlands N 0 10 20 30 40 Kilometers 50 50 100 100 150 150 200 200 250 250 150 150 200 200 250 250 40 - 50 30 - 40 20 - 30 10 - 20 5 - 10 Topography (m) Flanders Study basin Rivers X-Lambert (km) Y-Lambert (km)HESSD
4, 4265–4295, 2007 Impact of land-use change on the groundwater system J. Dams et al. Title Page Abstract Introduction Conclusions References Tables Figures ◭ ◮ ◭ ◮ Back CloseFull Screen / Esc
Printer-friendly Version Interactive Discussion EGU 0 10 20 Kilometers N Landuse agriculture build up city center build up coniferous forest deciduous forest road heather industry lake meadow mixed forest wet meadow
rivers
a
b
d
e
Legend
c
Fig. 4. Land-use maps for the year 2000 (a) and for the year 2020 assuming SRES scenario
HESSD
4, 4265–4295, 2007 Impact of land-use change on the groundwater system J. Dams et al. Title Page Abstract Introduction Conclusions References Tables Figures ◭ ◮ ◭ ◮ Back CloseFull Screen / Esc
Printer-friendly Version Interactive Discussion EGU (a) -4 -2 0 2 4 6 8 10 12 14 16 A1 A2 B1 B2 SRES Scenario C h a n g e (% ) Runoff ET Recharge (b) -20 -15 -10 -5 0 5 10 15 20 A1 A2 B1 B2 SRES Scenario C h a n g e (% ) Runoff ET Recharge (c) )-4 -2 0 2 4 6 8 10 12 14 A1 A2 B1 B2 SRES Scenario C h a n g e (% ) Runoff ET Recharge
Fig. 5. Average change in runoff, evapotranspiration and recharge fluxes in 2020 compared to
2000 resulting from different land use scenarios: yearly change (a), changes in summer (b), changes in winter (c).
HESSD
4, 4265–4295, 2007 Impact of land-use change on the groundwater system J. Dams et al. Title Page Abstract Introduction Conclusions References Tables Figures ◭ ◮ ◭ ◮ Back CloseFull Screen / Esc
Printer-friendly Version Interactive Discussion EGU 21.66 21.67 21.68 21.69 2000 2001 2002 2003 2004 2005 2006 2007 2008 2009 2010 2011 2012 2013 2014 2015 2016 2017 2018 2019 2020 Year A v e ra g e g ro u n d w a te r le v e l (m ) A1 A2 B1 B2
Fig. 6. Average change in groundwater level from 2000 till 2020 resulting from different land
HESSD
4, 4265–4295, 2007 Impact of land-use change on the groundwater system J. Dams et al. Title Page Abstract Introduction Conclusions References Tables Figures ◭ ◮ ◭ ◮ Back CloseFull Screen / Esc
Printer-friendly Version Interactive Discussion EGU $ $ $ $ $ $ Beerse Vosselaar Turhout Dessel Kasterlee Herentals 0 10 20 Kilometers N Difference in groundwater level between 2000 and 2020 (m)
-0.5 - -0.4 -0.4 - -0.3 -0.3 - -0.2 -0.2 - -0.1 -0.1 - 0 0 - 0.1 Rivers
Legend
$ $ $ $ $ $ Beerse Vosselaar Turhout Dessel Kasterlee Herentalsa
$ $ $ $ $ $ Beerse Vosselaar Turhout Dessel Kasterlee Herentals $ $ $ $ $ $ Beerse Vosselaar Turhout Dessel Kasterlee Herentalsb
c
d
Fig. 7. Spatially distributed change in groundwater level assuming SRES scenario A1 (a), A2 (b), B1 (c) and B2 (d).
HESSD
4, 4265–4295, 2007 Impact of land-use change on the groundwater system J. Dams et al. Title Page Abstract Introduction Conclusions References Tables Figures ◭ ◮ ◭ ◮ Back CloseFull Screen / Esc
Printer-friendly Version Interactive Discussion EGU
Beerse
Vosselaar
Turnhout
Arendonk
Retie
Dessel
Kasterlee
Lichtaart
Herentals
Vorselaar
0 10 20 KilometersN
Groundwater level decline > 5 cm
New urban areas
Contours with the distance from the major cities (interval 1km)
Fig. 8. Comparing groundwater level decrease between 2000 and 2020 and the increase in
urban area both for SRES scenario A1 with the distance to the present major cities in the study areas.