HAL Id: hal-00296470
https://hal.archives-ouvertes.fr/hal-00296470
Submitted on 4 Mar 2008
HAL is a multi-disciplinary open access
archive for the deposit and dissemination of
sci-entific research documents, whether they are
pub-lished or not. The documents may come from
teaching and research institutions in France or
abroad, or from public or private research centers.
L’archive ouverte pluridisciplinaire HAL, est
destinée au dépôt et à la diffusion de documents
scientifiques de niveau recherche, publiés ou non,
émanant des établissements d’enseignement et de
recherche français ou étrangers, des laboratoires
publics ou privés.
Does the threshold representation associated with the
autoconversion process matter?
H. Guo, Yehan Liu, J. E. Penner
To cite this version:
H. Guo, Yehan Liu, J. E. Penner. Does the threshold representation associated with the autoconversion
process matter?. Atmospheric Chemistry and Physics, European Geosciences Union, 2008, 8 (5),
pp.1225-1230. �hal-00296470�
www.atmos-chem-phys.net/8/1225/2008/ © Author(s) 2008. This work is distributed under the Creative Commons Attribution 3.0 License.
Chemistry
and Physics
Does the threshold representation associated with the
autoconversion process matter?
H. Guo1, Y. Liu1, and J. E. Penner2
1Atmospheric Science Division, Brookhaven National Laboratory, Upton, NY, USA
2Department of Atmospheric, Oceanic and Space Sciences, the University of Michigan, Ann Arbor, MI, USA
Received: 24 October 2007 – Published in Atmos. Chem. Phys. Discuss.: 14 November 2007 Revised: 29 January 2008 – Accepted: 2 February 2008 – Published: 4 March 2008
Abstract. Different ad hoc threshold functions associated
with the autoconversion process have been arbitrarily used in atmospheric models. However, it is unclear how these ad hoc functions impact model results. Here systematic investi-gations of the sensitivities of climatically-important proper-ties: CF (cloud fraction), LWP (liquid water path), and AIE (aerosol indirect effect) to threshold functions have been per-formed using a 3-D cloud-resolving model. It is found that the effect of threshold representations is larger on instanta-neous values than on daily averages; and the effect depends on the percentage of clouds in their transitional stages of con-verting cloud water to rain water. For both the instantaneous values and daily averages, the sensitivity to the specification of critical radius is more significant than the sensitivity to the “smoothness” of the threshold representation (as embod-ied in the relative dispersion of droplet size distribution) for drizzling clouds. Moreover, the impact of threshold repre-sentations on the AIE is stronger than that on CF and LWP.
1 Introduction
The autoconversion process generally refers to the process whereby droplets grow into embryonic raindrops. It deter-mines the onset of precipitation of warm clouds, influences the precipitation amount, and thereby the global hydrological cycle. Furthermore, the autoconversion process is an impor-tant bridge between aerosols, clouds, and precipitation, in that the suppression of precipitation by aerosols could in-crease cloud spatial and temporal extent (Albrecht, 1989; Pincus and Baker, 1994). Therefore, an appropriate
repre-Correspondence to: H. Guo ([email protected])
sentation of the autoconversion process is critical for advanc-ing our scientific understandadvanc-ing of cloud micro- and macro-properties, as well as cloud and/or aerosol effects on climate (Boucher et al., 1995; Rotstayn and Liu, 2005).
All the autoconversion parameterizations that have been developed so far can be generically written as
P = P0T , (1)
where P is the autoconversion rate (g cm−3s−1), P0 is the
rate function describing the conversion rate after the onset of the autoconversion process, and T (0 ≤T ≤ 1) is the threshold function describing the threshold behavior of the autoconver-sion process. To date, the primary foci of both parameteriza-tion development (Kessler, 1969; Manton and Cotton, 1977; Liu and Daum, 2004) and sensitivity investigations (Iacobel-lis and Somerville, 2006) have been on the rate function P0.
The threshold function has received little attention. In most global climate models (GCMs) and/or cloud resolving models (CRMs), the threshold behavior has been represented by an ad hoc function of liquid water content or droplet size. It ranges from an all-or-nothing Kessler-type (T = Heavi-side function, Kessler, 1969) to a smoother Sundqvist-type (T = exponential function, Sundqvist, 1978; Del Genio et al., 1996) and to a constant Berry-type (T = 1, Berry, 1968; Be-heng, 1994). Despite their dramatic differences, these func-tions have been used arbitrarily, and no systematic investiga-tion has been performed to examine whether or not these dif-ferent representations exert significant effects on model re-sults.
To fill this gap, this study explores how the climatically important properties, i.e. cloud fraction (CF), liquid water path (LWP), and aerosol indirect effect (AIE), respond to different threshold representations by applying a theoretical threshold function to a 3-D cloud-resolving model, ATHAM
1226 H. Guo et al.: Threshold of autoconversion (Active Tracer High-resolution Atmospheric Model)
(Her-zog et al., 1998, 2003; Guo et al., 2007a).
2 Threshold representation
Liu et al. (2006a) derived a theoretical threshold function (Tε) that covers all the existing types of threshold
represen-tations. Briefly, Tεis described by
Tε=γ (6ε + 1, [Ŵ(3ε + 1)]1/(3ε)xc1/(3ε)) ×γ (3ε + 1, [Ŵ(3ε + 1)]1/(3ε)xc1/(3ε)), (2) where Ŵ(a)= ∞ R 0
ta−1e−tdt is the Gamma function;
γ (a, x)= ∞ R x ta−1e−tdt ,∞ R 0
ta−1e−tdt is the normalized
incomplete Gamma function; ε is the relative dispersion (the ratio of the standard deviation to the mean radius of the cloud droplet size distribution); and xc is the ratio of the
critical to the mean mass concentration of cloud liquid water (Liu et al., 2006a). Equation (2) indicates that Tε depends
on two dimensionless variables, ε and xc, as compared to ad
hoc threshold functions which depend only on xc. It should
be emphasized that ε controls the “type” of Tε, changing
from the Kessler-type to the Berry-type as ε increases from 0 to infinity. This dependence of Tε on ε allows us to
systematically examine the effect of the “smoothness” of the threshold function, which has been unknowingly buried in arbitrary uses of ad hoc threshold functions in previous studies (Liu et al., 2006a).
3 Model and case descriptions
ATHAM is a non-hydrostatic, fully compressible atmo-spheric model. In this study, the 3-D version is adopted. The horizontal domain is 6.4×6.4 km2with a uniform hor-izontal spacing of 100 m. The vertical spacing is 30 m within the boundary layer (below 2 km). The time step is 2 s, and model results have been archived every 5 (model) min. The entire simulation period is 30 h, but we mainly examined the model results in the daytime from 06:00 to 18:00 LT (local time) when the AIE is significant. A double-moment cloud microphysical parameterization is employed; cloud droplet number concentration is predicted following Lohmann et al. (1999). Both the shortwave and longwave radiative heat-ing/cooling rates are computed interactively. The model is initialized and driven by the re-analysis data from European Centre for Medium-Range Weather Forecasts (ECMWF).
We investigated two contrasting clean and polluted cases observed during the Second Aerosol Characterization Ex-periment (ACE-2) over Portugal, the Azores, and the Ca-nary Islands. The clean case (denoted as “CLEAN”) oc-curred on 26 June 1997, when the ACE-2 area was under
the control of a cyclone that brought in pristine maritime air. The polluted case (denoted as “POLL”) occurred on 9 July 1997, when the ACE-2 area was under the influence of the Azores High that brought in anthropogenic pollution from Europe (Verver et al., 2000). For the “CLEAN” and “POLL” cases, the total aerosol number concentrations were 218 cm−3and 636 cm−3, respectively (Snider and Brenguier, 2000); and the non sea-salt (nss) sulfate mass concentrations were 0.30 µg m−3 and 2.8 µg m−3, respectively (Guibert et al., 2003). Note that the detailed model set-up and case de-scriptions are fully described in Guo et al. (2007a, b).
In addition to the contrasting aerosol and meteorological conditions, significant proportions of these clouds were in their transitional stages where precipitation depended criti-cally on the threshold representation, providing a good op-portunity to explore the effects of different threshold repre-sentations on model results.
4 Sensitivity studies
4.1 Sensitivity to the relative dispersion (ε)
To explore all the existing threshold functions, we performed simulations with ε=0, 0.1, 0.2, 0.4, 0.6, 0.8, 1.0, 10.0, and 300 in Eq. (2). Note: ε=0, 0.4, and 300 approximately repre-sent the Kessler-type, the Sundqvist-type, and the Berry-type threshold functions, respectively. The results are shown in Fig. 1, where the runs for ε=0 are used as the base cases (black), and the results of sensitivity tests for ε=0.4 and 300 are shown as percentage differences relative to the base cases. For the “CLEAN” case, both CF and LWP reach their maxima in the local early morning and their minima in the local afternoon (Fig. 1a and c). But for the “POLL” case, neither CF nor LWP exhibits a significant diurnal cycle due to a strong large-scale subsidence associated with the Azores High (Fig. 1b and d). The magnitude of the AIE is the largest near local noon for both the “CLEAN” and “POLL” cases due to the peak insolation (Fig. 1e and f). The “CLEAN” case has a larger AIE than the “POLL” case because the “CLEAN” clouds are deeper and moister (Pawlowska and Brenguier, 2003). Note that CF here is defined as the frac-tion of cloudy columns, and a cloudy column is a column containing one or more cloudy cells with liquid water mixing ratio >0.01 g/kg. The AIE (shortwave plus longwave) at the top-of-the-atmosphere is estimated by swapping the aerosol and meteorological conditions between the “CLEAN” and “POLL” cases and then calculating the radiative flux differ-ence between the clean and polluted aerosol conditions under the same meteorological background (Guo et al., 2007b).
The relative differences in the instantaneous CF, LWP, and AIE between the base cases (ε=0) and the sensitivity tests (ε=300) vary significantly, and can reach up to ∼20%, ∼40%, and ∼60%, respectively (Fig. 1). The maximum of the AIE difference can reach 100% although this only occurs
Fig. 1. Time series of cloud fraction (CF, a, b), in-cloud liquid wa-ter path (LWP, c, d), and aerosol indirect effect (AIE, e, f) at the top-of-the-atmosphere for the base cases (ε=0, black); and the cor-responding relative differences (Rel. Diff.) between the base cases and the sensitivity tests (ε=0.4, green; ε=300, red). The left and right panels are for the “CLEAN” (a, c, e) and “POLL” (b, d, f) cases, respectively. The observed values and their uncertainties are indicated with “x” and vertical bars, respectively, if available.
when the AIE is small. As expected, the difference between ε=0 and 300 is generally larger than that between ε=0 and 0.4. The effect of ε is stronger for the “POLL” case than that for the “CLEAN” case.
To further explore the underlying physics, Fig. 2 shows the relationship of the relative differences in CF, LWP, and AIE (for ε=0 and 300) as a function of xc. It is clear that larger
differences in these three quantities are generally associated with larger values of xc, suggesting that an exact
represen-tation of the threshold behavior becomes more important as the autoconversion becomes less efficient. This is expected because all threshold functions gradually approach 1 as xc
decreases to 0. The value of xcis an increasing function of
cloud droplet number concentration (Nd) but a decreasing
function of liquid water content (LWC) (xc∼Nd3/2LWC −2,
Eq. (12) of Liu et al., 2005). In the “POLL” case, xcis larger
because the Nd is larger and the LWC is smaller.
Further-Fig. 2. The relative differences (Rel. Diff.) between the base cases (ε=0) and the sensitivity tests (ε=300) vs. the critical-to-mean mass ratio of cloud water (xc) averaged over all cloudy cells at the same
model time for the “CLEAN” and “POLL” cases. The circle, plus, and diamond denote the instantaneous cloud fraction (CF), liquid water path (LWP), and aerosol indirect effect (AIE), respectively.
more, the association of a larger difference with a larger xc
explains why the effect of ε is stronger for the “POLL” case than for the “CLEAN” case as shown in Fig. 1.
For the “CLEAN” case, as daytime heating progresses, the cloud water is depleted so quickly (Fig. 1a and c) that the magnitude of xc jumps from ≪1 to ∼1. Consequently,
the “CLEAN” clouds transform quickly from one stage (with efficient drizzle production) to another stage (between driz-zling and non-drizdriz-zling). But for the “POLL” case, due to their continental origin and the strong large-scale subsidence (Guo et al., 2007b), these “POLL” clouds tend to precipitate less efficiently. Moreover, as shown in Fig. 2, the “CLEAN” and “POLL” cases span a wide range of xc from 0.1 to 40,
covering conditions of efficient (xc≪1), inefficient (xc≫1),
and intermediate (xc∼1) precipitation production via the
au-toconversion process. Thus, these two cases include clouds with different precipitation efficiencies.
Compared to the significant differences in the instanta-neous CF, LWP, and AIE, the differences in the correspond-ing daily averages are less noticeable. For various values of ε from 0 to 300, the daily averaged CF and LWP differ by <3%, while the daily averaged AIE differs by up to 15%. The larger difference in the AIE is due to the magnification of the differences in CF and LWP by the stronger insolation in the afternoon.
These differences in the instantaneous and averaged val-ues imply that the influence of the “smoothness” of thresh-old representations (determined by ε) is scale-dependent: it is more significant for the instantaneous values than for the daily averages. Furthermore, the effect of ε strongly depends on xc or the percentage of clouds in the transitional stage
(with weak drizzle or between drizzling and non-drizzling); and the same is expected to hold true for global averages.
It is noteworthy that ε also influences the rate function P0 in Eq. (1) (note: P0=κ(1+3ε 2)(1+4ε2)(1+5ε2) (1+ε2)(1+2ε2) N −1 d LWC 3,
1228 H. Guo et al.: Threshold of autoconversion
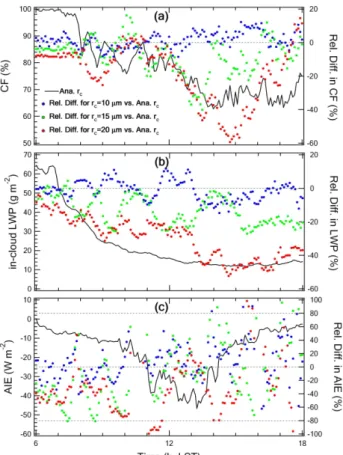
Fig. 3. Similar to Fig. 1, but for the relative differences (Rel. Diff.) between the base case with the analytical critical radius rc (Ana. rc) and the sensitivity tests with the prescribed rcof 10 µm (blue),
15 µm (green), 20 µm (red) for the “CLEAN” case.
Eq. (8) of Liu et al., 2006b). However, in order to isolate the dispersion effect on the threshold function, in this study the values of ε are set to be 0.1 and 0.2 for the calculations of P0
in the “CLEAN” and “POLL” cases, respectively (according to the observational study by Pawlowska et al., 2006). 4.2 Sensitivity to the critical radius (rc)
As discussed in Sect. 2, in addition to ε, the theoretical threshold function also depends on the critical-to-mean mass ratio of cloud water, xc. Since xc is a function of critical
ra-dius (rc) and rcis a parameter widely used in existing
auto-conversion parameterizations, the sensitivity to xcis replaced
here by the sensitivity to rc.
The critical radius rc has often been prescribed and/or
“tuned” to achieve satisfactory agreement with observations of cloud water, albeit without a sound physical basis (Rot-stayn, 1998, 2000). Recently Liu et al. (2004) derived an an-alytical expression for rcbased on the kinetic potential theory
(McGraw and Liu, 2003, 2004): rc=2.8522 × N1/6
.
L1/3 (3)
where rc is in µm, N is the cloud droplet number
con-centration in cm−3, and L is the liquid water content in
g cm−3. Rotstayn and Liu (2005) found that replacing
the prescribed rc with the analytical rc reduced the second
AIE by ∼27% using the CSIRO (Commonwealth Scientific and Industrial Research Organisation) GCM. A recent GCM inter-comparison study implied that the variations in the re-sponse of LWP to changes in aerosol concentrations may partly be caused by the assumed threshold values (Penner et al., 2006).
To better understand the effect of rcand compare it to the
effect of ε, we have performed sensitivity tests on rc by
ap-plying the analytical rcand by prescribing rcto be 10, 15, 20,
and 25 µm. Figure 3 shows the results for the “CLEAN” case with ε=0 (i.e. the Kessler-type threshold function). The re-sults with the analytical rcare shown as the base case (black),
and the results with rc=10, 15, 20 µm are shown in
percent-age differences relative to this base case. Evidently, a larger prescribed rcis associated with smaller CF and LWP. At first
glance, this association seems contradictory to the hypothesis that decreased precipitation leads to larger CF and LWP (Al-brecht, 1989). Deeper analysis reveals that the smaller CF and LWP are due to the stabilization of the boundary layer by precipitation formation. Smaller precipitation with in-creasing rcresults in higher entrainment drying and thereby
a more efficient depletion of cloud water (Ackerman et al., 2004; Bretherton et al., 2007; Guo et al., 2007b). In the afternoon, the instantaneous CF and LWP (with rc=20 µm)
are reduced as much as 60% and 50%, respectively. Con-sequently, clouds exhibit a more significant diurnal change. This is due to a positive feedback between the cloud geomet-ric radius and entrainment. A smaller cloud radius allows cloudy air to have a larger surface area to mix with drier am-bient air, and thus enhances entrainment drying (Blyth et al., 1988).
The relative difference in the instantaneous AIE is even more striking and varies by up to ∼80% in the daytime (Fig. 3c). The magnitude of the AIE tends to decrease with a larger rc, corresponding to the decreased CF and LWP. The
variation in the AIE tends to be larger than that in CF and in LWP.
The difference between the base case and the sensitivity test with rc=10 µm is minimal, because the averaged
analyt-ical rcis close to 10 µm. A critical radius of 10 µm is
sug-gested by Pawlowska and Brenguier for the ACE-2 (2003). This good agreement provides observational support for us-ing the analytical rc.
Relative to the base case using the analytical rc, the daily
averaged CF, LWP, and AIE are reduced by 20%, 20%, and 40%, respectively, when the prescribed rc=20 µm is used,
and they are reduced by 6%, 6%, and 20%, respectively, when the prescribed rc=15 µm is used as is suggested for
heavily drizzling clouds (Gerber, 1996). These results high-light the high sensitivities of the simulated cloud properties and the estimated aerosol forcing to rcfor drizzling clouds.
5 Discussion and concluding remarks
The sensitivities of the cloud fraction (CF), liquid water path (LWP), and aerosol indirect effect (AIE) to different thresh-old representations associated with the autoconversion pro-cess were systematically examined by applying a theoretical threshold function to a 3-D cloud-resolving model.
The major results can be summarized as follows. First, the sensitivity to threshold representations is larger for the instantaneous CF, LWP, and AIE than for the corresponding daily averages. For example, for values of the droplet rela-tive dispersion (ε) of 0 and 300, the relarela-tive differences in the instantaneous CF, LWP, and AIE are as large as 20%, 40%, and 100%, respectively; while the differences in the daily averages are generally less than 15%; Second, the sensitiv-ity depends critically on the critical-to-mean mass ratio of cloud water (xc), or the percentage of transitional clouds with
weak drizzle or between drizzling and non-drizzling; Third, the sensitivity to critical radius (rc) is more significant than
the sensitivity to the “smoothness” of threshold representa-tions as embodied in ε for drizzling clouds; Fourth, both CF and LWP tend to vary most significantly during the local af-ternoon when different values of ε and rcare used. The
mag-nification of the variations in CF and LWP by the stronger insolation near local noon leads to a larger variation in the AIE. Therefore, the relative differences in the AIE are larger than those in CF and LWP.
Two points are of note in passing. First, although the the-oretical threshold function as given by Eq. (2) is desirable in general modelling studies (Lohmann et al., 2007), fur-ther development is needed to combine it with the rate func-tion P0and the assumed sub-grid moisture distributions (e.g.
symmetric triangular distribution of total water mixing ra-tio, Gaussian distribution of mixing ratio of suspended water (i.e. vapor and cloud water)) (personal communications with L. D. Rotstayn and A. Chen, 2007). Moreover, it might be more complex than is warranted in current GCMs since sim-plified representations of cloud fraction are often used. In or-der to explore the potential for studying the effect of different threshold representations in GCMs, we have also conducted similar sensitivity tests using an approximate alternative, the generalized Sundqvist threshold function (Liu et al., 2006b), and we have obtained similar results (not shown here). Sec-ond, this study covers all existing types of ad hoc threshold functions, but the effect of ε here should not be considered to be the total effect of ε on clouds and/or aerosol radiative forcing, because the current expression for rc (and thus xc)
does not account for ε explicitly (Liu et al., 2004), and the effect of ε on the rate function P0 has not been applied in
this study.
Acknowledgements. H. Guo and Y. Liu are supported by the
Atmospheric Radiation Measurements (ARM) Program and Atmospheric Sciences Program (ASP) of the U.S. Department of Energy under Contract No. DE-AC02-98CH1-886. J. E. Penner
acknowledges support by the ARM Program under grant DOE-DE-FG02-97-ER62370.
Edited by: U. Lohmann
References
Ackerman, A. S., Kirkpatrick, M. P., Stevens, D. E., and Toon, O. B.: The impact of humidity above stratiform clouds on indirect aerosol climate forcing, Nature, 432, 1014–1017, 2004. Albrecht, B. A.: Aerosols, cloud microphysics, and fractional
cloudiness, Science, 243, 1227–1230, 1989.
Beheng, K. D.: A parameterization of warm cloud microphysical conversion processes, Atmos. Res., 33, 193–206, 1994. Berry, E. X.: Modification of the warm rain process. Preprints, First
National Conf. on Weather Modification, Am. Meteor. Soc., Al-bany, NY, 81–88, 1968.
Blyth, A. M., Cooper, W. A., and Jensen, J. B.: A study of the source of entrained air in Montana cumuli, J. Atmos. Sci., 45, 3944–3964, 1988.
Boucher, O., LeTreut, H., and Baker, M. B.: Precipitation and radi-ation modelling in a GCM: Introduction of cloud microphysical processes, J. Geophys. Res., 100, 16 395–16 414, 1995. Bretherton, C. S., Blossey, P. N., and Uchida J.: Cloud
droplet sedimentation, entrainment efficiency, and subtropi-cal stratocumulus albedo, Geophys. Res. Lett., 34, L03813, doi:10.1029/2006GL027648, 2007.
Del Genio, A. D., Yao, M., Kovari, W., and Lo, K. K.: A prognostic cloud water parameterization for climate models, J. Climate, 9, 270–304, 1996.
Gerber, H.: Microphysics of marine stratocumulus clouds with two drizzle modes, J. Atmos. Sci., 53, 1649–1662, 1996.
Guibert, S., Snider J. R., and Brenguier, J.-L.: Aerosol acti-vation in marine stratocumulus clouds 1. Measurement val-idation for a closure study, J. Geophys. Res., 108, 8628, doi:10.1029/2002JD002678, 2003.
Guo, H., Penner, J. E., Herzog, M., and Xie, S.: Investigation of the first and second aerosol indirect effects using data from the May 2003 Intensive Operational Period at the Southern Great Plains, J. Geophys. Res., 112, D15206, doi:10.1029/2006JD007173, 2007a.
Guo, H., Penner, J. E., Herzog, M., and Pawlowska, H.: Examina-tion of the aerosol indirect effect under contrasting environments during the ACE-2 experiment, Atmos. Chem. Phys., 7, 535–548, 2007b.
Herzog, M., Graf, H., Textor, C., and Oberhuber, J. M.: The ef-fect of phase changes of water on the development of volcanic plumes, J. Volcanol. Geoth. Res., 87, 55–74, 1998.
Herzog, M., Oberhuber, J. M., and Graf, H. F.: A prognostic tur-bulence scheme for the non-hydrostatic plume model, J. Atmos. Sci., 60, 2783–2796, 2003.
Iacobellis, S. F. and Somerville, R. C.: Evaluating param-eterizations of the autoconversion process using a single-column model and Atmospheric Radiation Measurement Program measurements, J. Geophys. Res., 111, D02203, doi:10.1029/2005JD006296, 2006.
Kessler, E.: On the distribution and continuity of water substance in atmospheric circulation, Meteor. Monogr., 10, 84 pp., 1969.
1230 H. Guo et al.: Threshold of autoconversion
Liu, Y., Daum, P. H., and McGraw, R.: An analytical ex-pression for predicting the critical radius in the autocon-version parameterization, Geophys. Res. Lett., 31, L06121, doi:10.1029/2003GL019117, 2004.
Liu, Y., Daum, P. H., and McGraw, R.: Size truncation ef-fect, threshold behavior, and a new type of autoconver-sion parameterization, Geophys. Res. Lett., 32, L11811, doi:10.1029/2005GL022636, 2005.
Liu, Y., Daum, P. H., McGraw, R., and Miller, M.: Generalized threshold function accounting for effect of relative dispersion on threshold behavior of autoconversion process, Geophys. Res. Lett., 32, L11804, doi:10.1029/2005GL025500, 2006a. Liu, Y., Daum, P. H., McGraw, R., and Miller, M.:
Parameteri-zation of the autoconversion process. PART II: generaliParameteri-zation of Sundqvist-type parameterizations, J. Atmos. Sci., 63, 1103– 1109, 2006b.
Lohmann, U., Feichter, J., Chuang, C. C., and Penner, J. E.: Pre-diction of the number of cloud droplets in the ECHAM GCM, J. Geophys. Res., 104, 9169–9198, 1999.
Lohmann, U., Quaas, J., Kinne, S., and Feichter, J.: Different ap-proaches for constraining global climate models of the anthro-pogenic indirect aerosol effect, B. Am. Meteor. Soc., 88, 243– 249, 2007.
Manton, M. J. and Cotton, W. R.: Formulation of approximate equa-tions for modeling moist deep convection on the meso-scale, At-mos. Sci. Pap., 266, Dept. of AtAt-mos. Sci., Colo. State Univ., Fort Collins, CO, 1977.
McGraw, R. and Liu, Y.: Kinetic potential and barrier crossing: a model for warm cloud drizzle formation, Phys. Rev. Lett., 90, 1, doi:10.1103/PhysRevLett.90.018501, 2003.
McGraw, R. and Liu, Y.: Analytical formulation and parameteriza-tion of the kinetic potential theory for drizzle formaparameteriza-tion, Phys. Rev., E70, 031606-1-031606-13, 2004.
Pawlowska, H. and Brenguier, J.-L.: An Observational study of drizzle formation in stratocumulus clouds for general circulation model (GCM) parameterizations, J. Geophys. Res., 108, 8630, doi:10.1029/2002JD002679, 2003.
Pawlowska, H., Grabowski, W. W., and Brenguier, J.-L.: Obser-vations of the width of cloud droplet spectra in stratocumulus, Geophys. Res. Lett., 33, L19810, doi:10.1029/2006GL026841, 2006.
Penner, J. E., Quaas, J., Storelvmo, T., Takemura, T., Boucher, O., Guo, H., Kirkev˚ag, A., Kristj´ansson, J. E., and Seland, Ø.: Model intercomparison of indirect aerosol effects, Atmos. Chem. Phys., 6, 3391–3405, 2006,
http://www.atmos-chem-phys.net/6/3391/2006/.
Pincus, R. and Baker, M. B.: Effect of precipitation on the albedo susceptibility of clouds in the marine boundary layer, Nature, 372, 250–252, 1994.
Rotstayn, L. D.: A physically based scheme for the treatment of stratiform clouds and precipitation in large-scale models, II, Comparison of modelled and observed climatological fields, Q. J. Roy. Meteorol. Soc., 124, 389–415, 1998.
Rotstayn, L. D.: On the “tuning” of autoconversion parameteriza-tions in climate models, J. Geophys. Res., 105, 15 495–15 507, 2000.
Rotstayn, L. D. and Liu, Y.: A smaller global estimate of the sec-ond indirect aerosol effect, Geophys. Res. Lett., 32, L05708, doi:10.1029/2004GL021922, 2005.
Snider, J. R., Guibert, S., Brenguier, J.-L., and Putaud, J.-P.: Aerosol activation in marine stratocumulus clouds: 2. Kohler and parcel theory closure studies, J. Geophys. Res., 108, 8629, doi:10.1029/2002JD002692, 2003.
Sundqvist, H.: A parameterization scheme for non-convective con-densation including prediction of cloud water content, Q. J. Roy. Meteorol. Soc., 104, 677–690, 1978.
Verver, G., Raes, F., Vogelezang, D., and Johnson, D.: The 2nd aerosol characterization experiment (ACE-2) meteorological and chemical context, Tellus, 52B, 126–140, 2000.