HAL Id: hal-02989151
https://hal.univ-lorraine.fr/hal-02989151
Submitted on 16 Nov 2020HAL is a multi-disciplinary open access archive for the deposit and dissemination of sci-entific research documents, whether they are pub-lished or not. The documents may come from teaching and research institutions in France or abroad, or from public or private research centers.
L’archive ouverte pluridisciplinaire HAL, est destinée au dépôt et à la diffusion de documents scientifiques de niveau recherche, publiés ou non, émanant des établissements d’enseignement et de recherche français ou étrangers, des laboratoires publics ou privés.
Distributed under a Creative Commons Attribution - NonCommercial - NoDerivatives| 4.0 International License
Addressing the electrostatic component of protons
binding to aquatic nanoparticles beyond the Non-Ideal
Competitive Adsorption (NICA)-Donnan level: Theory
and application to analysis of proton titration data for
humic matter
José Paulo Pinheiro, Elise Rotureau, Jérôme F.L. Duval
To cite this version:
José Paulo Pinheiro, Elise Rotureau, Jérôme F.L. Duval. Addressing the electrostatic component of protons binding to aquatic nanoparticles beyond the Non-Ideal Competitive Adsorption (NICA)-Donnan level: Theory and application to analysis of proton titration data for humic matter. Journal of Colloid and Interface Science, Elsevier, 2021, 583, pp.642-651. �10.1016/j.jcis.2020.09.059�. �hal-02989151�
1
Graphical Abstract
1 2 3 4 5 6 7 8 9 10 11 12 13 14 15 16 172
Addressing the electrostatic component of protons binding to aquatic
18nanoparticles beyond the Non-Ideal Competitive Adsorption
(NICA)-19Donnan level: theory and application to analysis of proton titration data for
20humic matter.
21José Paulo Pinheiro,
1Elise Rotureau,
1Jérôme F. L. Duval
1,∗ 2223 24
1
Université de Lorraine, CNRS, Laboratoire Interdisciplinaire des Environnements
25Continentaux (LIEC), UMR 7360, Vandoeuvre-lès-Nancy, F-54000, France.
2627
∗
Corresponding author: jerome.duval@univ-lorraine.fr
28Tel: 00 33 3 72 74 47 20
29 30 31 32 33 34 35 36 37 38 39 40 41 42 43 44 45 46 47 48 493 Abstract
50
Hypothesis.
51
Charge descriptors of aquatic nanoparticles (NPs) are evaluated from proton titration curves measured at 52
different salt concentrations and routinely analysed by the Non-Ideal Competitive Adsorption-Donnan 53
(NICAD) model. This model, however, suffers from approximations regarding particle electrostatics, 54
which may bias particle charge estimation. Implementation of Poisson-Boltzmann (PB) theory within 55
consistent treatment of NPs protolytic data is expected to address NICAD shortcomings. 56
Experiments.
57
An alternative to NICAD is elaborated on the basis of nonlinearized PB equation for soft particle 58
electrostatics to properly unravel the electrostatic and chemical components of proton binding to NPs. A 59
numerical package is developed for automated analysis of proton titration curves and proton affinity 60
spectra at different salt concentrations. The performance of the method is illustrated for humic matter 61
nanoparticles with different charge and size, and compared to that of NICAD. 62
Findings.
63
Unlike NICAD, PB-based treatment successfully reproduces particle charge dependence on pH for 64
practical salt concentrations from the thin to thick electric double layer limit. Donnan representation in 65
NICAD leads to moderate to dramatic misestimations of proton affinity and binding heterogeneity 66
depending on particle size to Debye layer thickness ratio. Interpretation of NPs protolytic properties with 67
PB theory further avoids adjustment of the ‘particle Donnan volume’ empirically introduced in NICAD. 68
69 70
Keywords. Poisson-Boltzmann theory, NICA-Donnan model, Particle electrostatics, Proton titration 71
curves, Nanoparticles, Humic matter. 72 73 74 75 76 77 78 79 80 81 82 83 84
4
1. INTRODUCTION
85
Natural organic matter (NOM), the most important source of organic carbon on earth, is ubiquitous 86
in soils and in aquatic ecosystems [1]. NOM refers to a broad spectrum of heterogeneous mixtures of 87
macromolecules, nanoparticles and/or colloidal aggregates that differ in terms of physical and chemical 88
properties including size, molecular weight, composition and charge [2]. The humic substances (HS), 89
which represent the major NOM fraction, may be differentiated according to their solubility: the insoluble 90
fraction, the humin, exists only in soils, whereas soluble fulvic and humic acids (hereafter denoted as FA 91
and HA, respectively) are found in soils and natural waters [3]. Solubility of FA and HA further differs 92
with respect to pH, with FA being fully soluble even under extreme acid conditions, and HA being soluble 93
solely in weekly acidic and alkaline solutions [4]. Both FA and HA colloids are defined by nanometric 94
dimensions with radius of ca. 1 nm and 2 to 10 nm [5], respectively. Accordingly, they are now generically 95
termed as humic nanoparticles (HNPs in short) in literature. 96
The charge carried by HNPs strongly affects the mobility and the speciation of trace metal ions (M) 97
in aquatic media. Indeed, it dramatically impacts on (i) the stability of HNPs-M complexes [6],[7]. (ii) the 98
kinetics of the processes driving the formation and the dissociation of these complexes in solution [8],[9], 99
and (iii) their lability, i.e. the extent to which complexes dissociate on the time scale of their diffusion 100
toward M-consuming microorganisms [10],[11],[12]. The resulting connection between HNPs charge and 101
metal bioavailability in aqueous environment motivates the need to address the electrostatic properties of 102
HNPs at the proper quantitative level. The magnitude of the charge carried by HNPs inherently depends 103
on solution pH and on background electrolyte concentration, both affecting the dissociation degree of the 104
carboxylic and phenolic groups distributed throughout the HNPs volume [13]. In turn, the evaluation of 105
HNPs charge properties from e.g. proton titration data analysis necessarily asks for an adequate 106
differentiation between the chemical (intrinsic) and electrostatic components of the affinity of the protons 107
for the HNPs carboxylic and phenolic sites [14]. Successful unravelling of these contributions is obviously 108
tied to the robustness of the models in integrating the relevant electric double layer properties of HNPs, 109
or, equivalently, the electrostatic potential distribution that is operational at the HNPs/solution interface. 110
So far, proton binding to HNPs has been mainly addressed from applications of the Windermere 111
Humic Aqueous Model (WHAM) and of the Non-Ideal Competitive Adsorption (NICA) model developed 112
in the 90’s [15-18]. For the sake of conciseness, we refer the reader to Koopal et al. [19],[20] and Town
113
et al. [7] for review and critical review of these modelling approaches. In their first attempt to integrate
114
electrostatics within NICA formalism, de Wit et al. [21] interpreted proton titration data measured on 115
various humic substances at different solution ionic strengths by means of the Poisson-Boltzmann (PB) 116
theory applied to hard particles, i.e. particles impermeable to ions from the background electrolyte. 117
Although such a PB-based modelling of humics electrostatic effects was reported to reproduce 118
‘reasonably well’ experimentaltitration data [21], a simpler but empirical electrostatic representation was 119
proposed where the potential is a priori considered constant within the whole particle body and in a 120
5
surrounding solution volume adjusted to match proton titration data [13]. In its initial version, this 121
‘Donnan-like’ electrostatic model took the form of an equation involving 2 parameters describing 122
empirically the dependence of a ˋDonnan volume´ on solution ionic strength [22], replaced later by an 123
equation involving a single adjustable parameter [15]. It is this last version of the ˋDonnan-like 124
representation´ that is integrated in the NICA-Donnan (NICAD) model and, except for some differences 125
detailed elsewhere [7], in the WHAM model. 126
Even though NICA-Donnan modelling is largely adopted in metal speciation and proton binding 127
studies involving HNPs [16] or other types of nanoparticles [19], there are severe inconsistencies in its 128
account of particle electrostatics, as recently detailed by e.g. Town et al. [7]. Briefly, the spatial 129
distribution of the electrostatic potential at the HNPs/solution interface adopted in NICAD violates the 130
fundamental Poisson-Boltzmann formalism, a funding element of the classical DLVO theory [23]. Indeed, 131
in the limit where particle radius well exceeds the electric Debye layer thickness in solution (a situation 132
reached at sufficiently large electrolyte concentrations), the rigorous solution of the PB equation takes the 133
form of a step-like potential profile where the potential is essentially constant inside the particle volume 134
(this is the so-called Donnan potential) and zero outside: this is the true Donnan situation [24],[25],[26]. 135
Accordingly, provided that medium salinity and particle size guarantee a correct application of the 136
Donnan representation in line with the inequality κrp >>1 with rp the particle radius and 1/κ the Debye
137
layer thickness, the Donnan volume cannot exceed the physical volume of the particles [7],[26]. This 138
requirement is not respected by the NICAD model applied to HNPs [27]. In addition, within the NICAD 139
modelling framework, the Donnan electrostatic picture is adopted regardless of the size of the particles 140
considered and of the background electrolyte concentration, i.e. irrespectively of the value taken by κrp.
141
This implies that the Donnan representation is basically considered valid over the whole spectrum of 142
electric double layer regimes, from the thick to the thin double layer extremes corresponding to κrp <<1
143
and κrp >>1, respectively. Obviously, this assumption is incorrect, recalling that a Donnan potential
144
profile is strictly operational under the only condition κrp >>1 [7]. Given a radius of say 5 nm for HA
145
particles, it is estimated that κrp∼ 1.7 to 5 in the range 10 mM to 100 mM electrolyte concentrations,
146
respectively, this salinity range being commonly considered for HA proton titration experiments [28]. 147
Therefore, under conditions where the electrostatic component is largest (i.e. at low κrp) or, equivalently,
148
when screening of particle electrostatics is least significant, the condition underlying the applicability of 149
a Donnan potential representation is not respected, which makes inappropriate the use of Donnan-based 150
modelling framework for HNPs [7]. 151
The above shortcomings of the Donnan electrostatic model applied to HNPs are not new. Already in 152
1999, Avena et al. [27] explicitly recognized that “application of a simple Donnan model will only give 153
results that are comparable to those obtained with the [PB] impermeable sphere model if the Donnan 154
volumes used are larger than the specific volumes of the hydrated humics”. In 2007, aware of the empirical 155
nature of the adjustment of the ‘particle Donnan volume’ in NICAD, Companys et al. [29] proposed a 156
6
formulation of the Donnan volume on the basis of analytical solutions of Poisson-Boltzmann equation. 157
The approach, however, excludes salinity conditions of practical interest where Donnan representation 158
for HNPs is not applicable and it does not integrate the whole PB-based spatial distribution of the 159
electrostatic potential. In 2005, Duval et al. [30] reported an electrokinetic analysis of HNPs particles 160
over a large range of pH and electrolyte concentration conditions on the basis of an electro-hydrodynamic 161
theory developed for the generic case of soft particles (i.e. permeable to ions from background electrolyte) 162
[31] whose electrostatic properties were tackled at the non-linear PB level. The authors thereby 163
demonstrated the inapplicability of the hard particles-representation for HNPs that display, instead, the 164
characteristic electrokinetic signature of soft particles whose intraparticulate potential approaches the 165
Donnan potential at sufficiently large κrp. It is emphasized that the hard sphere-representation proposed
166
earlier for HNPs [21] is not compatible with the establishment of a Donnan potential in the particle body: 167
this potential follows indeed from the compensation of the intraparticulate HNPs structural charges by 168
electrolyte ions that have been transferred from bulk solution to particle volume by conduction-diffusion 169
transport. Finally, Saito et al. [32] revealed dramatic (sometimes exceeding 100 %) discrepancies between 170
average HA particle potentials as determined by NICAD and that measured from fluorescence quenching. 171
Instead, they evidenced better agreement with average potentials estimated on the basis of ion permeable-172
sphere model and with adopting an electrostatic particle representation that integrates the extraparticulate 173
electric double layer contribution. 174
In view of the above elements, a sound physicochemical modelling of HNPs protolytic properties 175
where particle electrostatics is tackled at the proper non-linear Poisson-Boltzmann level for soft spheres 176
is still lacking in literature. In this work, we report such a formalism and we elaborate a numerical 177
procedure able to handle automatically, consistently and simultaneously, the recovery of proton titration 178
curves measured on HNPs of given size at different solution ionic strengths. These results are 179
systematically compared to those published using empirical NICAD model, thereby clearly identifying 180
the cases where application of NICAD is erroneous or approximate. The numerical package designed in 181
this work is available on demand. 182
183
2. MATERIALS
184
Polydisperse HNPs samples may form aggregates depending on pH, medium salinity and nature of 185
the cations in solution [33]. In turn, the evaluation of HNPs radius (rp) and molar mass (Mw) from proton
186
titration data modelling remains uncertain as the reliability of the obtained results necessarily depends on 187
the way particle electrostatics is pictured, recalling that rigorous PB-based potential distribution at 188
HNPs/solution interface intrinsically depends on particle size. To provide a clear comparison -free of the 189
above uncertainties- between HNPs-protons binding properties derived following our approach and those 190
obtained from NICAD, the analysis below is based on protons titration data sets collected on HNPs for 191
which particle radius is measured by independent techniques and for which NICAD-based fitting 192
parameters are explicitly provided in literature. Using such particle size estimation, we evaluated Mw of
7
the HNPs after exploiting Mw data reported for HNPs of composition similar than those considered in this
194
work. As detailed below, this procedure constrains the modelling of protolytic titration data versus pH 195
and electrolyte concentration and makes transparent the inherent electrostatic limits of NICAD model. In 196
contrast, it advocates for the recourse to more rigorous soft PB theoretical framework. In line with the 197
above elements, we selected five proton titration data sets published for HNPs with known particle radius, 198
namely: the Ribeirão Preto Humic acid (FPHA)[34], Suwanee River Fulvic Acid (SRFA)[28], Laurentian 199
Fulvic acid (LFA) [35] and the fulvic (Hf:FA) and humic acid (Hf:HA) from Sierra de Buio, Spain [36]. 200
A detailed description of these HNPs, of their size measurement and of the estimation of their molar mass 201
(Table 1) is provided in Supporting Material (SM, section A therein). 202
203
3. THEORY
204
The evaluation of HNP charge and protolytic properties is commonly carried out from the analysis of 205
protons titration experiments performed in 1:1 electrolyte whose concentration is varied in the range 1 206
mM to 100 mM. The strategy thus consists in using the proton as a probe to explore the electrostatic-207
dependent charging behaviour of HNPs. In turn, pending proper theoretical treatment, titration data 208
provide the desired relevant electrostatic descriptors and charge of HNPs as a function of pH and 209
electrolyte concentration. 210
3.1. Electrostatic and chemical descriptors of HNPs. The total charge 𝑄𝑄0 carried by a single HNP and
211
accessible from titration experiments may be expressed as the integral over the intraparticulate volume of 212
the density 𝜌𝜌0(𝑠𝑠) (in C m-3) of net charges stemming from the dissociation of the structural carboxylic and
213
phenolic groups distributed throughout the HNPs volume: 214
𝑄𝑄0(pH, 𝑐𝑐
elec∞ ) =𝐹𝐹𝑉𝑉4𝜋𝜋𝑝𝑝∫ 𝜌𝜌0𝑟𝑟𝑝𝑝 0(𝑠𝑠)(𝑟𝑟, pH, 𝑐𝑐elec∞ )𝑟𝑟2d𝑟𝑟 (1) 215
where 𝑉𝑉𝑝𝑝= 4π𝑟𝑟𝑝𝑝3/3 is the volume of an individual HNP (m3), r is the radial coordinate with the particle
216
centre positioned at r=0, 𝑟𝑟𝑝𝑝 is the particle radius, F is the Faraday and 𝑄𝑄0 is expressed as a concentration 217
of monovalent charges per unit HNPs volume (mol m-3). Eq 1 makes explicit that 𝑄𝑄0 and 𝜌𝜌
0(𝑠𝑠) both depend 218
on solution pH and on the background electrolyte concentration denoted as 𝑐𝑐elec∞ . The charge density 𝜌𝜌0(𝑠𝑠) 219
is determined by the local concentration of protons within the HNP body which itself depends on the 220
potential profile 𝜓𝜓(𝑟𝑟). For the sake of convenience, we introduce the dimensionless local electrostatic 221
potential defined by 𝑦𝑦(𝑟𝑟) = 𝑧𝑧𝐹𝐹𝜓𝜓(𝑟𝑟)/𝑅𝑅𝑅𝑅 where 𝑧𝑧 is the valence of the z:z background electrolyte (z=1 222
under commonly adopted titration experiment conditions). The radial dependence of 𝑦𝑦(𝑟𝑟) is governed by 223
the Poisson-Boltzmann (PB) equation where contributions from both (immobile) structural charges 224
carried by HNPs and (mobile) ions from the background electrolyte are accounted for. After 225
straightforward arrangements, the dimensionless PB equation applicable to soft HNPs particles reads 226
as[37]‡
227
8 𝑑𝑑2𝑦𝑦(𝑟𝑟̃) 𝑑𝑑𝑟𝑟̃2 + 2 𝑟𝑟̃ 𝑑𝑑𝑦𝑦(𝑟𝑟̃) 𝑑𝑑𝑟𝑟̃ − sinh[𝑦𝑦(𝑟𝑟̃)] = − 𝜌𝜌0(𝑠𝑠)�𝑟𝑟̃,pH,𝑐𝑐elec∞ � 2𝐹𝐹𝐹𝐹𝑐𝑐elec∞ (2) 228
where 𝑟𝑟̃ is the dimensionless radial position defined by 𝑟𝑟̃ =κ𝑟𝑟 with κ the reciprocal Debye length given 229 by 230 𝜅𝜅 = �2𝐹𝐹2𝑧𝑧2𝑐𝑐 elec∞ ⁄(𝑅𝑅𝑅𝑅𝜖𝜖0𝜖𝜖𝑟𝑟) (3) 231
with 𝜖𝜖0 the dielectric permittivity of vacuum and 𝜖𝜖𝑟𝑟 the relative dielectric permittivity of the medium. Eq 232
3 tacitly implies that the contribution of the protons and hydroxyl ions to the total solution ionic strength 233
is not significant, which is legitimate under the pH and 1:1 electrolyte concentration conditions adopted 234
in this work (and in many reports from literature [28]). Relaxing this condition is straightforward pending 235
replacement (i) of eq 3 by 𝜅𝜅 = �∑𝑁𝑁𝑗𝑗=1𝐹𝐹2𝑧𝑧𝑗𝑗2𝑐𝑐𝑗𝑗∞⁄(𝑅𝑅𝑅𝑅𝜖𝜖0𝜖𝜖𝑟𝑟) where the index j runs over all types of ions 236
with bulk concentration 𝑐𝑐𝑗𝑗∞ present in solution, including H+ and OH-, and (ii) modification of the sinh
237
term in eq 2 along the lines given elsewhere [38]. In addition, the current version of the program makes 238
it possible the analysis of measurements performed in 2:1 electrolytes based on a proper transformation 239
of eq 2 along the lines detailed in [6] (see eqs S1-S2 therein). Application of the formalism to other 240
mixtures of electrolytes is further possible pending differentiation in eq 2 between the various Boltzmann 241
terms associated with the respective contributions of the mobile ions to the overall charge of the extra- 242
and intra-particulate electric double layers. Last, the program allows, if required, the extraction of the 243
Boltzmann factor for proton accumulation (or that of any ions present in the electrolyte) within the overall 244
body of the particle. This is done by spatial integration of the relevant local Boltzmann factor, as detailed 245
in [6]. Also, if required, the Boltzmann factor pertaining to ion accumulation in the extraparticulate double 246
layer can be easily retrieved upon proper setting of the limits of the corresponding spatial integration. 247
The boundary conditions associated to eq 1 are provided by 248
y(𝑟𝑟̃ → ∞) = 0 ; 𝑑𝑑𝑦𝑦(𝑟𝑟̃)
𝑑𝑑𝑟𝑟̃ �𝑟𝑟̃=0= 0 (4a,b)
249
where eq 4a reflects electroneutrality condition in bulk electrolyte solution and eq 4b results from 250
symmetry of the potential profile at the particle centre. For the sake of demonstration, the developments 251
below are illustrated for HNPs particle but the formalism remains valid for any particle type pending 252
implementation of the relevant (Dirichlet- or Neumann-type of) electrostatic boundaries [39] and 253
consideration of the proper number of structural charges type (set to 2 for HNPs) [40]. 254
Under given pH and solution ionic strength conditions, the characteristic potential distribution 𝑦𝑦(𝑟𝑟̃) 255
derived from eqs 1-2 takes the form of a bell shape with a maximum reached at the particle center, and it 256
decreases gradually to zero value at few 1/κ distances far from the particle surface located at 𝑟𝑟 = 𝑟𝑟𝑝𝑝 [37]. 257
In the limit κrp >>1, the electrostatic Donnan situation is achieved with 𝑦𝑦�𝑟𝑟 ≤ 𝑟𝑟𝑝𝑝� = 𝑦𝑦D and 𝑦𝑦�𝑟𝑟 > 𝑟𝑟𝑝𝑝� =
258
0 where yD is the dimensionless Donnan potential [7]. It is emphasized that the local pH inside the HNPs
259
volume depends on position r and thus differs from the solution pH to an extent that depends on the 260
particle charge, or equivalently, on the magnitude of the intraparticulate potential. 261
9
The raw data 𝑄𝑄 obtained from proton titration experiments are classically expressed in equivalent 262
concentration of monovalent charges per mass of titrated HNPs (i.e. Q is in mol kg-1). 𝑄𝑄 is then related to
263
the volume charge density 𝑄𝑄0 (mol m-3) of a single HNP particle (eq 1) according to
264
𝑄𝑄 = 𝑄𝑄0𝑉𝑉
𝑝𝑝𝑁𝑁𝐴𝐴/𝑀𝑀𝑊𝑊= 𝑄𝑄0𝑣𝑣𝑝𝑝 (5) 265
where 𝑁𝑁𝐴𝐴 is the Avogadro number, 𝑀𝑀𝑊𝑊 (kgmol-1) is the molar mass of the considered HNP material, and
266
𝑣𝑣𝑝𝑝= 𝑉𝑉𝑝𝑝𝑁𝑁𝐴𝐴/𝑀𝑀𝑊𝑊 is the specific volume of HNP (in m3 kg-1). The conversion of 𝑄𝑄0 to a charge expressed 267
in standard experimental unit (mol kg-1) therefore requires knowledge of the particle radius r
p and of the
268
molecular weight 𝑀𝑀𝑊𝑊, or of the only specific volume 𝑣𝑣𝑝𝑝. This conversion is systematically required 269
because PB-based electrostatics of particles does not depend on the total amount of charges carried by the 270
particles but, instead, by their volume density of charges. 271
The structural charges carried by HNPs originate from the (de)protonation of carboxylic and phenolic 272
groups. Due to the intrinsic chemical heterogeneity of HNP material, equilibrium protonation constants 273
are classically modelled as continuous distributions [41] involving mean protonation constants denoted 274
as 𝐾𝐾�𝑎𝑎1 and 𝐾𝐾�𝑎𝑎2 for the carboxylic and phenolic groups, respectively, and the distribution width mH1 and
275
mH2. The later reflects the chemical heterogeneity of the carboxylic and phenolic binding sites throughout
276
HNPs due to differences in their molecular environments. The limits mH1=mH2=1 apply to ideal situations
277
where HNP composition is homogeneous. The local structural charge density, 𝜌𝜌0(𝑠𝑠)(𝑟𝑟, pH, 𝑐𝑐elec∞ ) involved 278
in eqs 1-2 is then provided by 279 𝜌𝜌0(𝑠𝑠)(𝑟𝑟, pH, 𝑐𝑐elec∞ ) = 𝜌𝜌maxH1 (𝑠𝑠) 1+10𝑚𝑚H1(p𝐾𝐾�𝑎𝑎1−pH)exp[−𝑚𝑚H1𝑦𝑦(𝑟𝑟̃)]+ 𝜌𝜌maxH2(𝑠𝑠) 1+10𝑚𝑚H2(p𝐾𝐾�𝑎𝑎2−pH)exp[−𝑚𝑚H2𝑦𝑦(𝑟𝑟̃)] (6) 280
where 𝜌𝜌maxH1(𝑠𝑠) and 𝜌𝜌maxH2(𝑠𝑠) are the maximum densities of structural charges (mol m-3) achieved under pH
281
conditions where all carboxylic and phenolic sites are fully deprotonated, respectively. 𝜌𝜌maxH1(𝑠𝑠) and 282
𝜌𝜌maxH2(𝑠𝑠) may be transformed in mol kg-1, by multiplication by 𝑣𝑣
𝑝𝑝, resulting in 𝑄𝑄maxH1 and 𝑄𝑄maxH2, 283
respectively. The set of eqs 1-6 fully determines the dependence of the searched charge 𝑄𝑄 on pH and ionic 284
strength. A Fortran program (named SPBT for Soft Poisson Boltzmann-based Titration) was developed 285
to compute eqs 1-6. In particular, the solution of eq 2 was derived according to the numerical strategy 286
employed elsewhere [42] using Fortran COLSYS subroutine [43] which approximates the solution 287
through spline-collocation at Gaussian nodes and selects mesh subdivision following an auto-adaptative 288
strategy. This algorithm has already been proven extremely efficient for evaluation of e.g. complex soft 289
particle electrokinetics [44] and soft macrosurface electrohydrodynamics [45]. The one-component NICA 290
equation commonly adopted for proton titration analysis is a Langmuir-Freundlich equation that involves, 291
similarly to eq 6, the protolytic parameters 𝜌𝜌maxH1(𝑠𝑠) , 𝜌𝜌maxH2(𝑠𝑠) (or 𝑄𝑄maxH1 and 𝑄𝑄maxH2), 𝐾𝐾�𝑎𝑎1, 𝐾𝐾�𝑎𝑎2, mH1 and
292
mH2 (see details of NICAD modelling in SM, section B). The electrostatic component of this NICA
293
equation is tackled via a Donnan-like representation of the potential profile inside the particle body and 294
in its aqueous surrounding, as commented in the Introduction section and further detailed in SM, section 295
B. 296
10
3.2. Fitting proton titration data to theory: strategy. The theoretical framework provided by eqs 1-6
297
involves 8 parameters that must be consistently adjusted to reproduce proton titration data collected at 298
different solution ionic strengths, namely rp, Mw, 𝜌𝜌maxH1(𝑠𝑠) , 𝜌𝜌maxH2(𝑠𝑠) (or 𝑄𝑄maxH1 and 𝑄𝑄maxH2 ), 𝐾𝐾�𝑎𝑎1, 𝐾𝐾�𝑎𝑎2,
299
mH1 and mH2, all of them being independent of the solution ionic strength provided that particles do not
300
significantly swell with varying pH or 𝑐𝑐elec∞ , which is the case for e.g. FA and HA (see related discussion 301
in the next section) [7],[46]. As the range of rp and Mw values is known (Table 1), this number basically
302
reduces to 6, which is consistent with the conclusion by Lenoir and Manceau [47] who evidenced, via 303
Principal Component Analysis (PCA) of proton titration data collected on a large series of fulvic and 304
humic samples, that only 6 independent parameters could be adjusted to reproduce experiments with least-305
square minimization. The analysis of proton titration data using the current version of NICAD requires 306
one additional parameter to be adjusted. This parameter, termed b, connects empirically the ‘particle 307
Donnan volume’ VD (erroneously allowed to exceed Vp) where the potential is considered a priori
308
constant, to the logarithm of the solution ionic strength, log I. Lenoir et al. [47] argued that using NICAD, 309
“the total covariance of the system cannot be reduced by measuring titration data at various ionic strengths 310
because log I is correlated to log VD”. This observation mirrors the failure of NICAD in establishing at
311
the correct PB level the connection between potential profiles at the HNPs/solution interface and medium 312
salinity. Janot et al. [35] compared unconstrained and constrained proton procedures for titration data 313
fitting with use of NICAD. They concluded that different sets of model parameters derived with different 314
procedures could lead to similar quality of data fit, thereby questioning again the physical relevance of 315
the obtained model parameters. Another important aspect is that the lack of obvious inflection points in 316
the proton titration curves implies that the quality of the theoretical recovery of the titration data, 317
regardless of the funding modelling approximations, may depend on the initial estimates of the adjusted 318
parameters, which in turn conditions the performance of the algorithm to converge to a solution with 319
minimisation of residuals [48]. Accordingly, to obtain more reliable information on HNPs charge and 320
electrostatic properties from confrontation between experiments and theory, the fitting procedure we 321
adopt, detailed in the next section, considers simultaneously the reconstruction of the proton titration data 322
(Q vs. pH) and that of its first derivative with respect to pH (dQ/dpH vs. pH), the so-called proton affinity 323
spectrum. 324
3.3. Procedure for proton titration data reconstruction. The parameters rp, Mw, 𝑄𝑄maxH1, 𝑄𝑄maxH2, 𝐾𝐾�𝑎𝑎1,
325
𝐾𝐾�𝑎𝑎2, mH1 and mH2 were optimized to reproduce the raw proton titration data and the associated affinity
326
spectra by coupling our home-made Fortran program SPBT with PEST, an open source software for 327
adjustment and estimation [49] of parameters by confrontation of theoretical models to experimental data. 328
The minimization procedure adopted in PEST for fitting theory to data is based on Gauss-Marquardt-329
Levenberg algorithm which minimizes the weighted sum Σ of squared differences between model-330
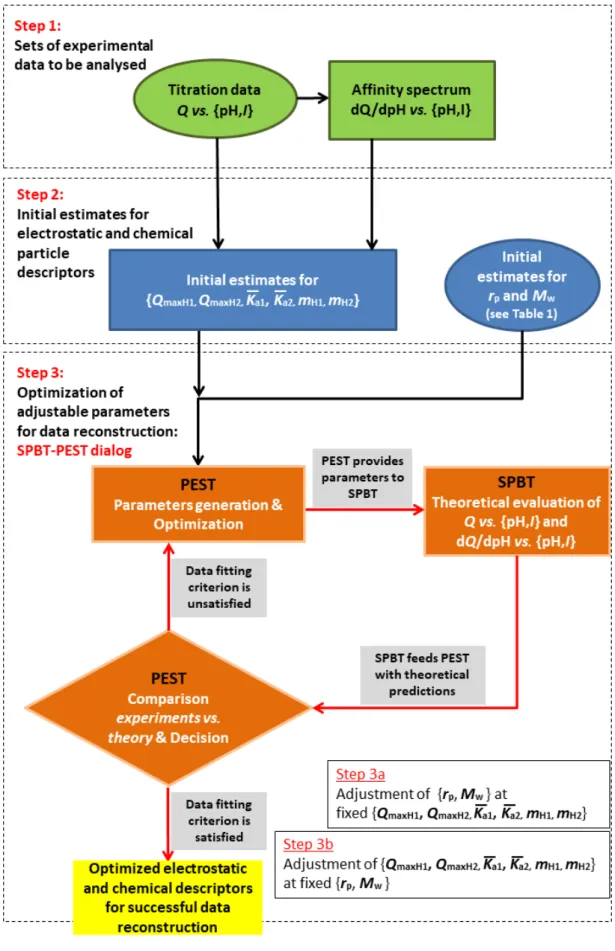
generated data (supplied here by SPBT) and corresponding experimental measurements. Figure S1 in SM 331
(section C) summarizes the key steps of the proton titration data treatment by the coupled SPBT-PEST 332
11
codes, which includes the estimations of sound initial guessed values for the chemical parameters 𝑄𝑄maxH1, 333
𝑄𝑄maxH2, mH1, mH2, 𝐾𝐾�𝑎𝑎1 and 𝐾𝐾�𝑎𝑎2 (SM, Figure S2, section D) as well as refinement of measured rp and Mw.
334
Optimization of rp and Mw at one side and 𝑄𝑄maxH1, 𝑄𝑄maxH2, mH1, mH2, 𝐾𝐾�𝑎𝑎1 and 𝐾𝐾�𝑎𝑎2 at the other is
335
performed according to a two-step process detailed in Figure S1. The reader is referred to SM (section 336
C) for exhaustive details of the procedure driving the iterative dialog between PEST (in charge of the 337
generating parameters and confronting experimental prediction to experimental data) with SPBT that 338
computes (Q vs. pH and I) and (dQ/dpH vs. pH and I) data for given set of parameters. 339
In the next section, we discuss the performance of SPBT-PEST in reproducing the Q and dQ/dpH vs. 340
pH data measured at different background electrolyte concentrations for the HNPs samples listed in Table 341
1. We further compare the corresponding sets of optimized parameters with those derived by NICAD-342
based modelling and reported in literature for FPHA [34], SRFA [28], LFA [35], Hf:FA [36] and Hf:HA 343
[36] particles. 344
345
4. RESULTS AND DISCUSSION
346
4.1. Comparison between HNPs specific volume derived from SPBT-PEST and Donnan
347
volume estimated from NICAD modelling
348
As detailed in the theoretical section, the particle radius rp and molecular weight 𝑀𝑀𝑊𝑊 can be used to
349
compute the particle specific volume 𝑣𝑣𝑝𝑝 (m3 kg-1). Table 1 collects r
p, 𝑀𝑀𝑊𝑊 and 𝑣𝑣𝑝𝑝 obtained from
SPBT-350
PEST analysis of the proton titration data measured at different solution ionic strengths for the various 351
HNPs of interest. For the sake of comparison, Table 1 further reports the NICAD-based Donnan Volume 352
VD (also expressed in m3 kg-1) estimated for the various HNPs types considered on the basis of NICAD
353
model parameters published in literature. 354
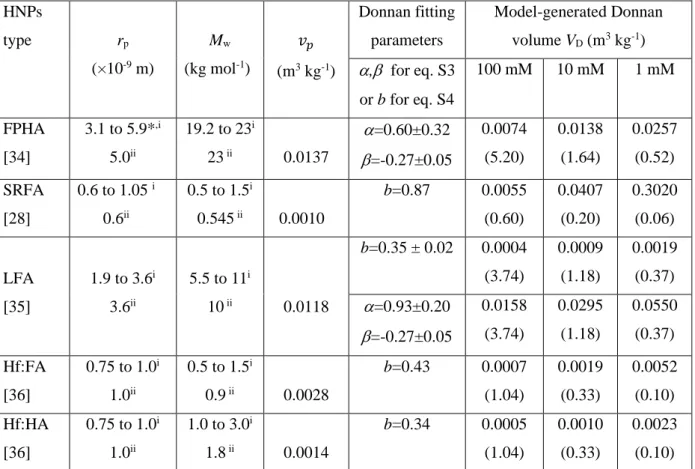
Table 1: Comparison between HNPs specific volumes 𝑣𝑣𝑝𝑝derived in this work and model-generated Donnan volume 355
VD computed from the parameters reported in literature for NICAD modelling. Eq S3 and eq S4 given in SM specify
356
the way VD was estimated, i.e. either via the two-parameter (α, β) dependent or the one-parameter (b) dependent
357
NICAD empirical equations that relates VD to the logarithm of ionic strength. Initial estimates (superscript i in the
358
Table) and refined values (superscript ii) of particle size rp and molecular weight Mw by SPBT-PEST are further
359
indicated. Numbers between brackets correspond to κrp values, recalling that Donnan potential-representation is
360
strictly applicable for κrp >>1.
361 362 HNPs type rp (×10-9 m) Mw (kg mol-1) 𝑣𝑣𝑝𝑝 (m3 kg-1) Donnan fitting parameters Model-generated Donnan volume VD (m3 kg-1) α,β for eq. S3 or b for eq. S4 100 mM 10 mM 1 mM FPHA [34] 3.1 to 5.9*,i 5.0ii 19.2 to 23i 23 ii 0.0137 α=0.60±0.32 β=-0.27±0.05 0.0074 (5.20) 0.0138 (1.64) 0.0257 (0.52) SRFA [28] 0.6 to 1.05 i 0.6ii 0.5 to 1.5i 0.545 ii 0.0010 b=0.87 0.0055 (0.60) 0.0407 (0.20) 0.3020 (0.06)
12 LFA [35] 1.9 to 3.6i 3.6ii 5.5 to 11i 10 ii 0.0118 b=0.35 ± 0.02 0.0004 (3.74) 0.0009 (1.18) 0.0019 (0.37) α=0.93±0.20 β=-0.27±0.05 0.0158 (3.74) 0.0295 (1.18) 0.0550 (0.37) Hf:FA [36] 0.75 to 1.0i 1.0ii 0.5 to 1.5i 0.9 ii 0.0028 b=0.43 0.0007 (1.04) 0.0019 (0.33) 0.0052 (0.10) Hf:HA [36] 0.75 to 1.0i 1.0ii 1.0 to 3.0i 1.8 ii 0.0014 b=0.34 0.0005 (1.04) 0.0010 (0.33) 0.0023 (0.10) *Determined in this work by Scanned Stripping Chronopotentiometry (SSCP), see details in SM (section A, therein). 363
The Donnan volume VD significantly increases with decreasing solution ionic strength I. This
364
dependence of VD on I, systematically observed with NICAD modelling regardless of sample types [19],
365
has been motivated by viscosity measurements and argued to stem from particle swelling [50]. However, 366
as discussed by Town et al.,[7] this justification is questionable because it ignores the influence of primary 367
and secondary electroviscous effects that originate from particle electric double layer interactions and 368
interparticulate electrohydrodynamic interactions. These effects, in turn, can lead to substantial variations 369
in the viscosity of particle dispersions with pH and ionic strength even under constant particle size 370
conditions [51],[52],[53]. Besides, may the particle size (and thus VD) increases significantly with
371
decreasing I, one would anticipate a strong dependence of VD with pH, similarly to that observed for e.g.
372
responsive PNIPAM particles [54], essentially because the driving electrostatic force for particle swelling 373
depends on particle charge and thus on both I and pH. In contradiction to this anticipation, VD is
374
considered constant with pH in NICAD modelling. Last, for both HA and FA of soil and aquatic origins, 375
particle size measurements performed with different techniques [7],[55],[56] show that there is no 376
significant ionic strength- nor pH- dependent swelling/contraction of the particles in aqueous dispersions 377
(the argument excludes extreme pH and I conditions where particles aggregation may take place). These 378
elements highlight the empirical ad hoc fitting/calibration of VD for every salt concentration tested. In
379
addition, for many of the situations considered in Table 1, VD exceeds 𝑣𝑣𝑝𝑝. This basically comes to position
380
particle structural charges within a volume that exceeds the physical volume of the particle, which is 381
inconsistent from an electrostatic point of view. Within the PB framework adopted in SPBT-PEST 382
analysis of proton titration data and proton affinity spectrum, the HNPs specific volume 𝑣𝑣𝑝𝑝 is independent 383
of solution pH and ionic strength and, accordingly, it does not suffer from the inconsistencies of VD
384
estimates listed above. Last, it is clear that for most of the salinity and particle size conditions examined, 385
the κrp >>1 condition required for rigorous application of a Donnan representation of the electrostatic
386
potential distribution at HNPs/solution interface is not satisfied (see Table 1), which further questions the 387
physical meaning of the NICAD framework applied under such conditions. 388
389
4.2. Performance of SPBT-PEST in recovering proton titration and affinity spectrum data.
13
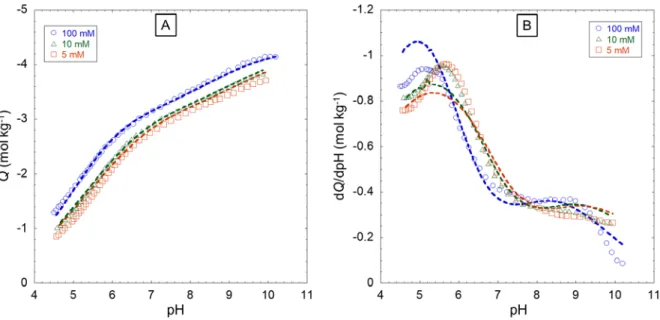
Figures 1 and 2 report the SPBT-PEST theoretical analyses of the proton titration and affinity 391
spectrum data measured for FPHA and SRFA at different NaNO3 electrolyte concentrations, respectively,
392
and the corresponding adopted model parameter values are listed in Table 2 together with their statistical 393
dispersion evaluated by PEST. For the sake of conciseness, reconstruction of data pertaining to LFA, 394
Hf:FA and Hf:HA are given in SM (section E, Figures S3-S5) and corresponding model parameters are 395
provided in Table 2. 396
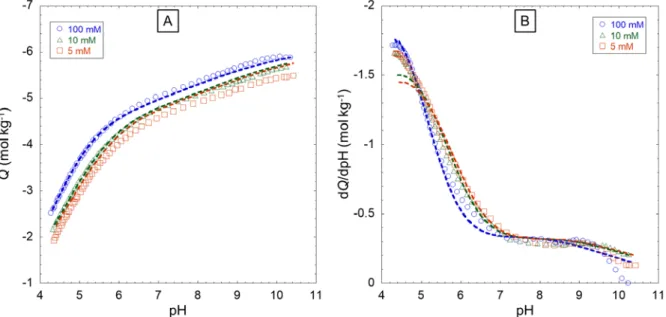
Figure 1A shows a good agreement between titration experiments and SPBT-based theory for FPHA 397
particles. In particular, the analysis reproduces with accuracy the electrostatic component of the proton 398
binding to the particles, which is materialized by the correct positioning of the theoretical curves with 399
varying background electrolyte concentration. This successful match between theory and experiments 400
does not suffer from ad hoc adjustment of particle size and it intrinsically integrates the way 401
intraparticulate and extraparticulate electrostatic potential distributions are modified with varying particle 402
size and electrolyte concentration, features that are not shared by the empirical NICAD modelling 403
framework. It is further emphasized that data treatment on the basis of SPB-PEST is significantly more 404
constrained than that performed with using NICAD as the former, unlike the latter, considers simultaneous 405
analysis of proton titration and affinity spectrum. 406
407
Figure 1: Proton titration curves for FPHA (A) and corresponding proton affinity spectra (B) collected at three
408
NaNO3 electrolyte concentrations: 10 mM (∆), 30 mM (◊) and 100 mM (
ο
). Symbols: measurements. Dotted lines:409
SPBT-PEST modelling results. Model parameters are listed in Tables 1-2. The charge is expressed in moles of 410
equivalent charges per kg of FPHA material. 411
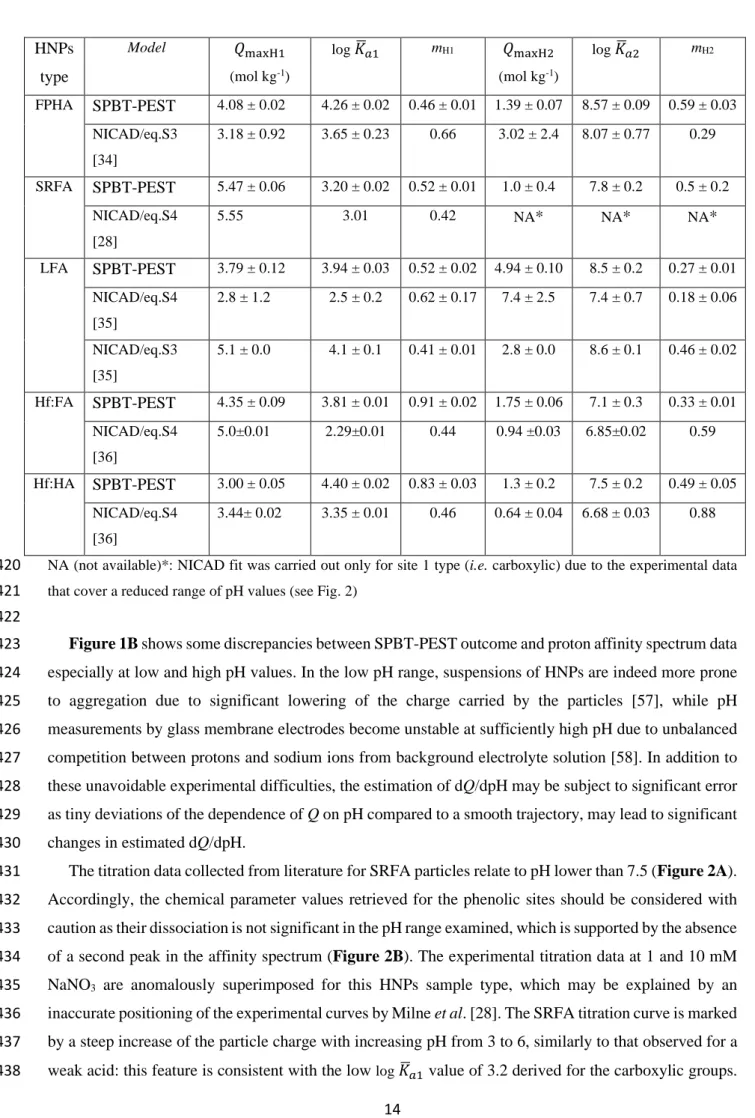
Table 2: SPBT-PEST optimized values of the chemical parameters involved in the Langmuir-Freundlich equation 412
(eq 6) for the various HNPs types considered in this work. Indicated dispersions of the parameters correspond to the 413
95% confidence interval provided by PEST. The parameters are retrieved from SPBT-PEST and NICAD modelling 414
of the proton titration curves measured at different salt reconstructions and reported in Figures S6-S10 for the five 415
HNPs samples of interest. SPBT-PEST and NICAD theoretical reconstructions of these proton titration data versus 416
pH and salt concentration are also provided in Figures S6-S10. 417
418 419
14 HNPs type Model 𝑄𝑄maxH1 (mol kg-1) log 𝐾𝐾�𝑎𝑎1 mH1 𝑄𝑄maxH2 (mol kg-1) log 𝐾𝐾�𝑎𝑎2 mH2 FPHA SPBT-PEST 4.08 ± 0.02 4.26 ± 0.02 0.46 ± 0.01 1.39 ± 0.07 8.57 ± 0.09 0.59 ± 0.03 NICAD/eq.S3 [34] 3.18 ± 0.92 3.65 ± 0.23 0.66 3.02 ± 2.4 8.07 ± 0.77 0.29 SRFA SPBT-PEST 5.47 ± 0.06 3.20 ± 0.02 0.52 ± 0.01 1.0 ± 0.4 7.8 ± 0.2 0.5 ± 0.2 NICAD/eq.S4 [28] 5.55 3.01 0.42 NA* NA* NA* LFA SPBT-PEST 3.79 ± 0.12 3.94 ± 0.03 0.52 ± 0.02 4.94 ± 0.10 8.5 ± 0.2 0.27 ± 0.01 NICAD/eq.S4 [35] 2.8 ± 1.2 2.5 ± 0.2 0.62 ± 0.17 7.4 ± 2.5 7.4 ± 0.7 0.18 ± 0.06 NICAD/eq.S3 [35] 5.1 ± 0.0 4.1 ± 0.1 0.41 ± 0.01 2.8 ± 0.0 8.6 ± 0.1 0.46 ± 0.02 Hf:FA SPBT-PEST 4.35 ± 0.09 3.81 ± 0.01 0.91 ± 0.02 1.75 ± 0.06 7.1 ± 0.3 0.33 ± 0.01 NICAD/eq.S4 [36] 5.0±0.01 2.29±0.01 0.44 0.94 ±0.03 6.85±0.02 0.59 Hf:HA SPBT-PEST 3.00 ± 0.05 4.40 ± 0.02 0.83 ± 0.03 1.3 ± 0.2 7.5 ± 0.2 0.49 ± 0.05 NICAD/eq.S4 [36] 3.44± 0.02 3.35 ± 0.01 0.46 0.64 ± 0.04 6.68 ± 0.03 0.88
NA (not available)*: NICAD fit was carried out only for site 1 type (i.e. carboxylic) due to the experimental data 420
that cover a reduced range of pH values (see Fig. 2) 421
422
Figure 1B shows some discrepancies between SPBT-PEST outcome and proton affinity spectrum data 423
especially at low and high pH values. In the low pH range, suspensions of HNPs are indeed more prone 424
to aggregation due to significant lowering of the charge carried by the particles [57], while pH 425
measurements by glass membrane electrodes become unstable at sufficiently high pH due to unbalanced 426
competition between protons and sodium ions from background electrolyte solution [58]. In addition to 427
these unavoidable experimental difficulties, the estimation of dQ/dpH may be subject to significant error 428
as tiny deviations of the dependence of Q on pH compared to a smooth trajectory, may lead to significant 429
changes in estimated dQ/dpH. 430
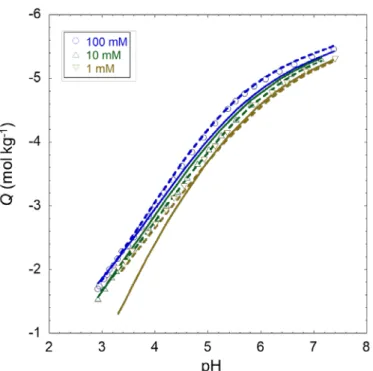
The titration data collected from literature for SRFA particles relate to pH lower than 7.5 (Figure 2A). 431
Accordingly, the chemical parameter values retrieved for the phenolic sites should be considered with 432
caution as their dissociation is not significant in the pH range examined, which is supported by the absence 433
of a second peak in the affinity spectrum (Figure 2B). The experimental titration data at 1 and 10 mM 434
NaNO3 are anomalously superimposed for this HNPs sample type, which may be explained by an
435
inaccurate positioning of the experimental curves by Milne et al. [28]. The SRFA titration curve is marked 436
by a steep increase of the particle charge with increasing pH from 3 to 6, similarly to that observed for a 437
weak acid: this feature is consistent with the low log 𝐾𝐾�𝑎𝑎1 value of 3.2 derived for the carboxylic groups. 438
15
The lack of data at higher pH values is reflected by the large errors made in the estimation of the optimised 439
parameters pertaining to the phenolic sites, particularly for 𝑄𝑄maxH2 and mH2 (Table 2). The variations of
440
the proton affinity spectrum at low pH are better defined for the sub-nanometric SRFA particles than 441
those measured for the larger FPHA particles (Figure 1B), which supports that particles aggregation -442
facilitated with increasing particle size [57]- likely affects data quality in this pH range. 443
444
Figure 2: Proton titration curves for SRFA (A) and corresponding proton affinity spectra (B) collected at three
445
NaNO3 electrolyte concentrations (indicated). Symbols: measurements. Dotted lines: SPBT-PEST modelling results.
446
Model parameters are given in Tables 1-2. The charge is expressed in moles of equivalent charges per kg of SRFA 447
material. 448
449
The experimental results collected for LFA particles are of good quality up to pH 8 (SM, Figure S3) 450
but some suspicious changes in the measurements can be observed at larger pH, especially at 30 mM ionic 451
strength, which is particularly evidenced by inspection of the proton affinity spectra. The SPBT-PEST 452
reconstruction of the LFA proton titration data is satisfactory for all electrolyte concentrations conditions 453
examined, which contrasts with the theoretical quality of the corresponding proton affinity spectra. As 454
mentioned above, this is so because the computation of the derivative dQ/dpH is very sensitive to changes 455
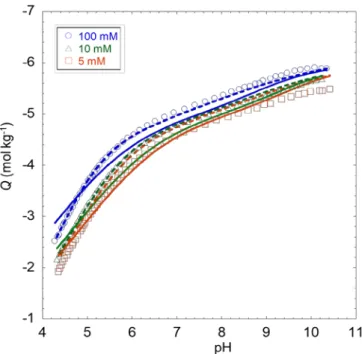
of Q with pH, even very small. The results derived for Hf:FA (SM, Figure S4) and Hf:HA (SM, Figure 456
S5) are quite similar, with the noticeable result that chemical heterogeneity viewed by the prism of mH1 is
457
modest for both samples (Table 2). A difference is that carboxylic sites fraction is more significant in 458
Hf:FA and associated log 𝐾𝐾�𝑎𝑎1 is significantly lower than that for Hf:HA. Inspection of Figures S4-S5 459
reveals that SPBT-based theory slightly overestimates experiments at low electrolyte concentrations (10 460
mM and 5 mM). Whereas it is difficult to provide firm explanations of such differences for Hf:FA and 461
Hf:HA samples, possible origins of the mismatch between experiments and theory (mismatch that is more 462
pronounced with NICAD-based modelling, see SM, section F) can be advanced: the effectiveness of the 463
protocol for separating the sub-nanometric fulvic and humic fractions in these samples, an approximate 464
16
positioning of the experimental titration data at 5 and 10 mM, or the occurrence of physico-chemical 465
reactions affecting the structure of the particles at sufficiently low medium salinity. 466
467
4.3. Comparison between protolytic chemical parameters of HNPs retrieved by
SPBT-468
PEST and NICAD
469
As discussed above, the Donnan-like representation considered within NICAD modelling does not 470
provide a consistent picture of the soft HNPs electrostatic properties. It is then of importance to address 471
how the inconsistency of this unconstrained, empirical modelling approach is reflected in the NICAD-472
derived protolytic chemical parameters. For that purpose, Table 2 collect 𝑄𝑄maxH1, 𝑄𝑄maxH2, mH1, mH2,
473
𝐾𝐾�𝑎𝑎1 and 𝐾𝐾�𝑎𝑎2 derived by NICAD and provided in the literature for the samples of interest, to be compared 474
with the values obtained by SPBT-PEST. In addition, for the sake of completeness we report in Figures 475
S6-S10 (SM, section F) the NICAD-based fitting of the proton titration curves for all HNPs listed in 476
Table 1 together with those obtained by SPBT-PEST. Briefly, data reconstruction quality by NICAD for 477
the largest FPHA and LFA HNPs considered in this work is quite comparable for all examined ionic 478
strengths to that achieved by SPBT-PEST, whereas it is significantly worse for all other HNPs defined by 479
lower rp. This conforms qualitatively with the fact that the NICAD assumption of a constant
480
intraparticulate potential is best verified for large particles, more prone to satisfy the criterion κrp >>1
481
under given medium salinity conditions. Surprisingly, NICAD manages to provide a reasonable estimates 482
of proton titration data for FPHA and LFA at low ionic strengths where Donnan criterion is not satisfied 483
(see Table 1): it does so, however, at the cost of unrealistic adjustment of VD already invoked by Town et
484
al. [7] and Lenoir et al. [48] Further comparison between 𝐾𝐾�𝑎𝑎1,2 derived by NICAD and SPBT-PEST 485
(Table 2) shows important differences, especially for carboxylic groups for which this difference may 486
amount to more than an order magnitude. This difference is most important for Hf:FA and Hf:HA samples 487
for which NICAD modelling is inappropriate (SM, Figures S9-S10), and it remains marginal for SRFA 488
and LFA despite of the corresponding poor NICAD-based titration data reconstruction (SM, Figure S7) 489
and/or the inapplicability of the Donnan criterion over the whole range of solution ionic strength 490
considered (Table 1). For Hf:FA, the log𝐾𝐾�𝑎𝑎1 (2.29±0.01) obtained by NICAD is further anomalously low 491
for carboxylic acid and it compares to the first proton dissociation constant of a stronger acid like 492
phosphoric acid (pKa=2.12) [59]. As a matter of fact, this suspicious log𝐾𝐾�𝑎𝑎1 value just mirrors the attempt
493
of NICAD to balance its physically erroneous description of particle electrostatics via artificial adjustment 494
of VD. The reader is referred to Table 1 and Table 2 to appreciate the over- or under-estimation of the
495
quantities 𝑄𝑄maxH1, 𝑄𝑄maxH2, mH1 and mH2 by NICAD as compared to those derived by SPBT-PEST. It is
496
worth mentioning that huge differences of these quantities (some approaching or exceeding 100%, see 497
Table 2 for LFA data) are obtained by NICAD depending on the nature of the VD-log I relationship
498
adopted (either one or two-parameters dependent relation, see eqs S3 and S4 in SM, respectively). This 499
observation, further supported by the large differences in VD (see Table 1 for LFA) simply reflects, again,
17
the phenomenological nature of the NICAD fitting exercise that is based on an electrostatic representation 501
unsupported by the particle size-dependent intra- and extra-particulate spatial distributions governed by 502
PB formalism for soft particles. Even with application of NICAD model under conditions where its 503
founding electrostatic approximation is not verified, proton titration data reconstruction can be more or 504
less ‘satisfactory’: this underpins the empirical nature of NICAD-based fitting of such data. 505
Unsurprisingly, adopting eq S3 provides better reconstruction of proton titration data than with using eq 506
S4 simply because the degree of parameters adjustment offered to the user is larger with the former 507 equation. 508 509
5. CONCLUSIONS
510Since the 90’s when the first versions of the Non-Ideal Competitive Adsorption-Donnan model 511
(NICAD) were developed [15-18], the community of environmental physical chemists has largely 512
employed the NICAD model to estimate the chemical charge carried by aquatic nanoparticles from proton 513
titration data measured at different salt concentrations [15-18,21,22,28,34-36,40,48,60-62]. Accurate 514
knowledge of the charge of these particles is fundamental as e.g. it largely contributes to define the fate, 515
speciation and bioavailability of charged contaminants like metals in the aqueous compartments of 516
ecosystems. In particular, there is a large amount of literature data reporting analysis by NICA-Donnan 517
or related models, of the protolytic properties of humic matter nanoparticles (HNPs) commonly viewed 518
as model surrogates for organic matter particles in aquatic environments or soils [18,19,21,22,28,34-519
36,47,48,50,60-62]. For the sake of illustration, ecotoxicologists often employ HNPs as model systems to 520
analyse the speciation of hazardous metals in dispersions of charged colloids and the implications thereof 521
in terms of identification of the toxic metal forms towards living organisms (e.g. plants, bacteria, or algae) 522
[63]. 523
Despite of its popularity, NICA-Donnan suffers from severe approximations on the way particle 524
electrostatics is implemented, recalling that estimation of the charge carried by any colloidal particles 525
necessarily requires a proper formulation of the electrostatic component of the binding of the charge-526
determining ions (protons) to the ionogenic sites distributed at the particle surface and/or in the particle 527
body volume. Namely, NICAD assumes the applicability of Donnan electrostatic representation for 528
charged (nano)particles regardless of the ratio between particle size and thickness of the operational 529
electric Debye layer thickness [7]. This approximation necessarily fails for HNPs with radius 1 nm to 10 530
nm and practical salt concentrations in the range 1 mM to 100 mM. A consequence is that NICAD 531
requires, for proton titration data fitting, the adjustment of a ‘particle Donnan volume’ that (i) exceeds the 532
physical size of the particles and (ii) systematically increases with decreasing salt concentration, even in 533
the absence of significant particle swelling [7,28,34-36]. Items (i) and (ii) are inconsistent from an 534
electrostatic point of view and simply reflect the inapplicable electrostatic description given in NICAD 535
for particles whose size does not significantly exceed the Debye layer thickness [7]. In line with these 536
18
observations, force is to recognize that a sound alternative to NICAD modelling for NPs charge evaluation 537
is urgently needed. 538
Accordingly, in this work we elaborate a new approach for the analysis of NPs proton titration data 539
where Poisson-Boltzmann theory for soft particle electrostatics is consistently implemented. The particle 540
charge is evaluated from proper spatial integration of the local particle charge density defined by an 541
isotherm reflecting the chemical binding of charge determining protons to ionogenic sites located at the 542
particle surface and within the particle body volume, and corrected by local electrostatics retrieved from 543
numerical solution to the nonlinear Poisson-Boltzmann equation valid for weakly to highly charged 544
particles. Unlike NICAD, this framework is used to generate proton titration curves with a consistent 545
account of particle size-dependent potential profile over the whole spectrum of Debye layer extension, 546
i.e. from the thin to the thick double layer regime. A complete numerical package (that we make available
547
for the community) combining a home-made FORTRAN program (named SPBT) for PB-based 548
computations of particle electrostatics and charge, and a free module (called PEST) for optimized 549
adjustment of the relevant chemical and electrostatic model parameters, is developed. The combined 550
SPBT-PEST programs allow for (i) the automated and constrained reconstruction of measured proton 551
titration curves and associated proton affinity spectra collected at different salt concentrations, and (ii) 552
the evaluation of the relevant particle electrostatic and protolytic features. 553
The whole methodology is successfully tested for a range of HNPs particles whose titration data and 554
size measurements are available in literature, and the performance of SPBT-PEST duo is further explicitly 555
compared with that of NICAD. In detail, unlike NICAD [36], SPBT-PEST successfully reproduces the 556
dependence of measured particle charge on pH and salt concentration for all HNPs tested, including those 557
for which Donnan representation is not applicable. For HNPs whose size legitimates the applicability of 558
Donnan potential profile, NICAD succeeds in reproducing the experimental data albeit at the cost of a 559
‘particle Donnan volume’ that is adjusted to values that exceed the physical volume of the particles, which 560
is physically impossible [7,28,34,35]. In addition, SPBT-PEST properly recovers proton titration data for 561
HNPs with maintaining a constant particle radius for all salt concentrations tested, which contrasts with 562
the empirical adjustment of the NICAD ‘particle Donnan volume’ found to systemically increase with 563
decreasing salt concentration [28,34-36]. We find that the chemical parameters pertaining to proton 564
binding and proton affinity distribution, as retrieved from data modelling by SPBT-PEST and NICAD, 565
may largely differ, especially so for the smallest HNPs where Donnan representation is not appropriate. 566
This finding simply highlights the empirical electrostatic foundation of NICAD model and implications 567
thereof in terms of particle charge estimation. NICAD may succeed to reproduce, quantitatively, 568
experimental proton titration data even for particles whose size forbids a priori its application. It does so 569
thanks to the adjustment of the ‘particle Donnan volume’, which artificially counterbalances the 570
electrostatic deficiency of the NICAD model to achieve data fitting. As a support of this element, it is 571
found that both the Donnan volume and the key chemical parameters involved in the model can vary by 572
100% depending on the reported form of the empirical NICAD equation that defines the dependence of 573
19
‘particle Donnan volume’ on medium salt concentration. In contrast, SPBT-PEST does not require the 574
adjustment of a ‘particle Donnan volume’ for fitting proton titration curves, recalling that this volume, 575
when relevant, necessarily identifies with the physical volume of the particle and the electrostatic potential 576
therein (the Donnan potential) is independent of position. The Donnan electrostatic potential 577
representation at the particle/solution interface is nothing else than the solution of the PB equation in the 578
limit of thin double layers. As such, SPBT-PEST bypasses the necessity by NICAD to recourse to a 579
questionable over-parameterisation of particle electrostatics to reproduce experimental data. Unlike 580
NICAD [22,28,25], the PB-based alternative we propose integrates consistently the intimate connection 581
between particle double layer potential, particle size and background electrolyte concentration. 582
We believe that the here-highlighted shortcomings of NICAD in its phenomenological representation 583
of particle electrostatics should be of concern for the community as NICAD, together with WHAM that 584
suffers from similar electrostatic approximations, constitutes a widely employed basis for computing e.g. 585
metal-to-humic thermodynamic complexation or addressing metal bioavailability in relation to toxicity 586
effects assessment. Unlike NICAD and WHAM, the PB theoretical framework developed in this study 587
can be extended to account explicitly for the presence of multivalent ions in solution [6], an option that is 588
particularly interesting for analysing particle charging behaviour in natural waters rich in divalent cations. 589
In addition, depending on the nature of particles considered, inhomogeneous particle structure 590
composition and gradients in dielectric permittivity between particle body and extraparticulate medium 591
can be easily implemented within the PB equation along the lines described elsewhere [39],[64]. Such 592
particle structure and electrostatic refinements may be valuable provided that independent measurements 593
targeting these aspects (e.g. diffusion neutron scattering and dielectric spectroscopy) are available to avoid 594
the adjustment of an ill-defined set of parameters when reconstructing particle proton titration curves. 595
596
Supporting material.
A. Detailed description of the HNPs considered in this work, of their size 597measurement and of the estimation of their molar mass. B. Details of the NICA-Donnan modelling 598
framework. C. Details of here-developed SPBT-PEST treatment of proton titration data and associated 599
proton affinity spectra. D. Evaluation of the initial estimates of the chemical parameters involved in eq 6. 600
E. Performance of SPBT-PEST in recovering HNPs proton titration and affinity spectra data. F. 601
Comparison between SPBT-PEST and NICAD reconstructions of proton titration data. Additional details 602
on the procedure outlined in E with step-by-step treated examples are provided in the form of a SPBT-603
PEST user manual that is available on request together with the SPBT executable file. 604
605
This research did not receive any specific grant from funding agencies in the public, commercial, or not-606 for-profit sectors. 607 608
References
609[1] K.H. Tan, Humic Matter in Soil and the Environment: Principles and Controversies, 2nd Edition, 610
Crc Press-Taylor & Francis Group, Boca Raton, 2014. https://doi.org/10.1201/b17037. 611
[2] J. Buffle, Complexation Reactions in Aquatic Systems: An Analytical Approach, Prentice Hall, 612
1988. 613
[3] G.R. Aiken, D.M. McKnight, P. MacCarthy, R.L. Wershaw, Humic Substances in Soil, Sediment, and 614
Water: Geochemistry, Isolation, and Characterization, Wiley, 1985. 615
20
[4] E.M. Thurman, R.L. Malcolm, Preparative isolation of aquatic humic substances, Environ. Sci. 616
Technol. 15 (1981) 463–466. https://doi.org/10.1021/es00086a012. 617
[5] E.M. Thurman, R.L. Wershaw, R.L. Malcolm, D.J. Pinckney, Molecular size of aquatic humic 618
substances, Organic Geochemistry. 4 (1982) 27–35. https://doi.org/10.1016/0146-619
6380(82)90005-5. 620
[6] R.M. Town, J.F.L. Duval, H.P. van Leeuwen, The Intrinsic Stability of Metal Ion Complexes with 621
Nanoparticulate Fulvic Acids, Environ. Sci. Technol. 52 (2018) 11682-11690. 622
https://doi.org/10.1021/acs.est.8b02896. 623
[7] R.M. Town, H.P. van Leeuwen, J.F.L. Duval, Rigorous Physicochemical Framework for Metal Ion 624
Binding by Aqueous Nanoparticulate Humic Substances: Implications for Speciation Modeling by 625
the NICA-Donnan and WHAM Codes, Environ. Sci. Technol. 53 (2019) 8516-8532. 626
https://doi.org/10.1021/acs.est.9b00624. 627
[8] H.P. van Leeuwen, J. Buffle, Chemodynamics of Aquatic Metal Complexes: From Small Ligands to 628
Colloids, Environ. Sci. Technol. 43 (2009) 7175–7183. https://doi.org/10.1021/es900894h. 629
[9] J.F.L. Duval, Chemodynamics of metal ion complexation by charged nanoparticles: a 630
dimensionless rationale for soft, core–shell and hard particle types, Phys. Chem. Chem. Phys. 19 631
(2017) 11802–11815. https://doi.org/10.1039/C7CP01750B. 632
[10] J.F.L. Duval, R.M. Town, H.P. van Leeuwen, Applicability of the Reaction Layer Principle to 633
Nanoparticulate Metal Complexes at a Macroscopic Reactive (Bio)Interface: a Theoretical Study, 634
J. Phys. Chem. C. 121 (2017) 19147-19161. https://doi.org/10.1021/acs.jpcc.7b04031. 635
[11] J.F.L. Duval, R.M. Town, H.P. van Leeuwen, Lability of Nanoparticulate Metal Complexes at a 636
Macroscopic Metal Responsive (Bio)interface: Expression and Asymptotic Scaling Laws, J. Phys. 637
Chem. C. 122 (2018) 6052-6065. https://doi.org/10.1021/acs.jpcc.7b11982. 638
[12] H.P. van Leeuwen, J.F.L. Duval, J.P. Pinheiro, R. Blust, R.M. Town, Chemodynamics and 639
bioavailability of metal ion complexes with nanoparticles in aqueous media, Environ. Sci.: Nano. 640
4 (2017) 2108–2133. https://doi.org/10.1039/C7EN00625J. 641
[13] J. Marinsky, J. Ephraim, A Unified Physicochemical Description of the Protonation and Metal-Ion 642
Complexation Equilibria of Natural Organic-Acids (humic and Fulvic-Acids) .1. Analysis of the 643
Influence of Polyelectrolyte Properties on Protonation Equilibria in Ionic Media - Fundamental-644
Concepts, Environ. Sci. Technol. 20 (1986) 349–354. https://doi.org/10.1021/es00146a006. 645
[14] J. Ephraim, S. Alegret, A. Mathuthu, M. Bicking, R. Malcolm, J. Marinsky, A United 646
Physicochemical Description of the Protonation and Metal-Ion Complexation Equilibria of Natural 647
Organic-Acids (humic and Fulvic-Acids) .2. Influence of Polyelectrolyte Properties and Functional-648
Group Heterogeneity on the Protonation Equilibria of Fulvic-Acid, Environ. Sci. Technol. 20 (1986) 649
354–366. https://doi.org/10.1021/es00146a007. 650
[15] D.G. Kinniburgh, C.J. Milne, M.F. Benedetti, J.P. Pinheiro, J. Filius, L.K. Koopal, W.H. Van 651
Riemsdijk, Metal Ion Binding by Humic Acid: Application of the NICA-Donnan Model, Environ. Sci. 652
Technol. 30 (1996) 1687–1698. https://doi.org/10.1021/es950695h. 653
[16] C.J. Milne, D.G. Kinniburgh, W.H. van Riemsdijk, E. Tipping, Generic NICA−Donnan Model 654
Parameters for Metal-Ion Binding by Humic Substances, Environ. Sci. Technol. 37 (2003) 958– 655
971. https://doi.org/10.1021/es0258879. 656
[17] E. Tipping, WHAMC—A chemical equilibrium model and computer code for waters, sediments, 657
and soils incorporating a discrete site/electrostatic model of ion-binding by humic substances, 658
Computers & Geosciences. 20 (1994) 973–1023. https://doi.org/10.1016/0098-3004(94)90038-8. 659
[18] E. Tipping, Humic Ion-Binding Model VI: An Improved Description of the Interactions of Protons 660
and Metal Ions with Humic Substances, Aquatic Geochemistry. 4 (1998) 3–47. 661
https://doi.org/10.1023/A:1009627214459. 662
[19] L.K. Koopal, T. Saito, J.P. Pinheiro, W.H. Van Riemsdijk, Ion binding to natural organic matter: 663
General considerations and the NICA–Donnan model, Colloids Surf. A: Physicochem. Eng. Asp. 664
265 (2005) 40–54. https://doi.org/10.1016/j.colsurfa.2004.11.050. 665