HAL Id: hal-02178762
https://hal.sorbonne-universite.fr/hal-02178762
Submitted on 10 Jul 2019HAL is a multi-disciplinary open access
archive for the deposit and dissemination of sci-entific research documents, whether they are pub-lished or not. The documents may come from teaching and research institutions in France or abroad, or from public or private research centers.
L’archive ouverte pluridisciplinaire HAL, est destinée au dépôt et à la diffusion de documents scientifiques de niveau recherche, publiés ou non, émanant des établissements d’enseignement et de recherche français ou étrangers, des laboratoires publics ou privés.
Resistance to ocean acidification in coral reef taxa is not
gained by acclimatization
S. Comeau, C. Cornwall, T. Decarlo, S. Doo, C. Carpenter, T. Mcculloch
To cite this version:
S. Comeau, C. Cornwall, T. Decarlo, S. Doo, C. Carpenter, et al.. Resistance to ocean acidification in coral reef taxa is not gained by acclimatization. Nature Climate Change, Nature Publishing Group, 2019, 9 (6), pp.477-483. �10.1038/s41558-019-0486-9�. �hal-02178762�
Resistance to ocean acidification in coral reef taxa is not gained by
1
acclimatization
2 3
Comeau S.1,2,3, Cornwall C. E.1,2,4, DeCarlo T. M.1,2,5, Doo S. S.6, Carpenter R.
4
C.6, McCulloch M. T.1,2
5 6
1The University of Western Australia, Oceans Graduate School, 35 Stirling Highway, 7
Crawley 6009, Western Australia, Australia 8
2ARC Centre of Excellence for Coral Reef Studies, 35 Stirling Highway, Crawley 9
6009, Western Australia, Australia 10
3Sorbonne Université, CNRS-INSU, Laboratoire d’Océanographie de Villefranche, 11
181 chemin du Lazaret, F–06230 Villefranche-sur-mer, France 12
4School of Biological Sciences, Victoria University of Wellington, Wellington, New-13
Zealand. 14
5Red Sea Research Center, Division of Biological and Environmental Science and 15
Engineering, King Abdullah University of Science and Technology (KAUST), 16
Thuwal, Saudi Arabia 17
6Department of Biology, California State University, 18111 Nordhoff Street, 18
Northridge, CA 91330-8303, USA 19
Abstract
21 22
Ocean acidification (OA) is a major threat to coral reefs, which are built by calcareous 23
species. However, long-term assessments of the impacts of OA are scarce, limiting 24
the understanding of the capacity of corals and coralline algae to acclimatize to high 25
pCO2 levels. Species-specific sensitivities to OA are influenced by its impacts on 26
chemistry within the calcifying fluid (CF). Here, we investigate the capacity of 27
multiple coral and calcifying macroalgal species to acclimatize to elevated pCO2 by 28
determining their chemistry in the CF during a year-long experiment. We found no 29
evidence of acclimatization to elevated pCO2 across any of the tested taxa. The effects 30
of increasing seawater pCO2 on the CF chemistry were rapid and persisted until the 31
end of the experiment. Our results show that acclimatization of the CF chemistry does 32
not occur within one year, which confirms the threat of OA for future reef accretion 33
and ecological function. 34
Changes in seawater carbonate chemistry caused by OA generally lead to decreasing 35
calcification of marine organisms1 as well as increased dissolution of existing calcium 36
carbonate structures2. The magnitude of responses to OA are species-specific and can 37
even be intra-specific in reef taxa, although some species exhibit significant resistance 38
to OA3–5. The physiological mechanisms responsible for declines in calcification in 39
corals and calcifying algae due to OA are, however, still unclear. Short-term 40
experiments on small numbers of species have limited potential to assess whether 41
calcifying organisms can acclimatize to changes in seawater carbonate chemistry, or 42
alternatively, whether species-specific differences in calcification physiology dictates 43
the overall magnitude of responses. 44
Insights into changes in calcification mechanisms can be gained by 45
investigating the response of carbonate chemistry in the calcifying fluid (CF) from 46
which the calcium carbonate is precipitated6. Corals exert a strong control on their CF 47
chemistry, with pH in the CF (pHcf) maintained above seawater pH7–9. Similarly, the 48
dissolved inorganic carbon (DIC) is concentrated in the CF by ~1.5–2-fold above 49
seawater DIC10–13. As a result, the saturation state within the CF is ~3–4 times greater 50
than the surrounding seawater, which, in association with the production of organic 51
matrices, favours the precipitation of calcium carbonate in the CF. While less data on 52
the calcification physiology of tropical calcifying algae are available14, the few studies 53
on coralline algae also show that the response of their CF chemistry to seawater 54
carbonate chemistry is similar to that of corals10,15,16. 55
Reduced seawater pH can decrease pHcf, though pHcf always remains above 56
seawater pH7. However, the magnitude of the effect of seawater pH on pHcf is 57
species-specific7,17. In contrast, DICcf increases with temperature and declining 58
seawater pH17,18. Again, the effects on DICcf are also species-specific17. The use of 59
laboratory studies to estimate the response of organisms to climate change in situ has 60
been challenged, and this is particularly true for assessments of how climate change 61
could modify carbonate chemistry in the CF11. Massive Porites exhibit, for example, 62
strong seasonal variation in CF chemistry in situ, where pHcf varies by 0.2 units, and 63
DICcf by 20–25% in one year11,19. It was proposed that such effects of seasonal 64
variability in CF chemistry could be masked during laboratory experiments if constant 65
temperature and daily doses of light are employed11. 66
Long-term OA experiments (several months to years) are rare20, but they are 67
necessary to rule out short-term responses to treatments, and to determine whether 68
acclimatization to such conditions is possible. Outside of laboratory experiments, field 69
observations at naturally acidified sites such as CO2 seeps have been used to provide 70
valuable information on the capacity of organisms to acclimate or adapt (if locally 71
self-recruiting) to OA21,22. The survival and high abundance of massive Porites sp. 72
corals near CO2 seeps has been associated with their capacity to maintain elevated 73
pHcf23. However, it is difficult to draw conclusions from studies made at CO2 vents 74
alone because those sites experience huge sporadic variations in pH (up to 1 unit) that 75
are not representative of the future conditions expected on most reefs15,24. 76
The present study was designed to test the year-long effects of OA, in outdoor 77
flumes25, on the CF chemistry in the four corals Pocillopora verrucosa, Psammocora 78
profundacella, Acropora pulchra and massive Porites spp. (called Pocillopora,
79
Psammocora, Acropora, and Porites thereafter) and two calcifying algae
80
Lithophyllum kotschyanum and Halimeda minima (Lithophyllum and Halimeda
81
thereafter). We assessed the calcification and CF responses of these organisms 82
exposed to four different pCO2 conditions over one year (2 months for Halimeda). We 83
were able to maintain realistic flow conditions, natural irradiance, and stable pCO2 by 84
using outdoor flumes26. Two non-exclusive hypotheses were tested: 1) if 85
acclimatization occurs, corals and calcifying algae would have the capacity to attain 86
conditions of carbonate chemistry in the CF comparable to the control after one year 87
of exposure. This would be the case if carbonate chemistry in the CF is initially 88
affected by OA, but then returns to the level of the control during the one-year 89
experimental period. 2) Seasonal variations in light and temperature would affect the 90
response of the CF chemistry to OA. This would occur if carbonate chemistry in the 91
CF varies seasonally as a function of light and temperature in a similar manner in all 92 treatments. 93 94 Experimental conditions 95
Over the year-long incubation, pCO2 treatments remained relatively stable. 96
Overall, the average monthly mean pCO2 values of the treatments were 356 ± 27 97
µatm, 561 ± 22 µatm, 714 ± 34 µatm, and 1053 ± 43 µatm for the four treatments 98
(mean ± SE, n = 12 for all). The range of mean seawater temperatures across all four 99
communities was 25.55– 29.37 °C, which reflected the seasonal mean at the backreef 100
of Moorea. Mean seawater temperature integrated over the year of incubation did not 101
vary greatly between flumes (maximum 0.16°C between two flumes). Mean monthly 102
daytime PAR varied seasonally from a minimum in May (219 ± 8 µmol quanta m-2 s -103
1) to a maximum in November (478 ± 77 µmol quanta m-2 s-1). Monthly AT mean 104
values across the flumes did not differ (from a minimum of 2286.3 ± 11.9 to a 105
maximum of 2294.5 ± 8.6 µmol kg-1 in the 561and 714 µatm flumes, respectively) 106
and remained similar to the total alkalinity of the back reef of Moorea. 107
108
Calcification and calcifying fluid chemistry
109
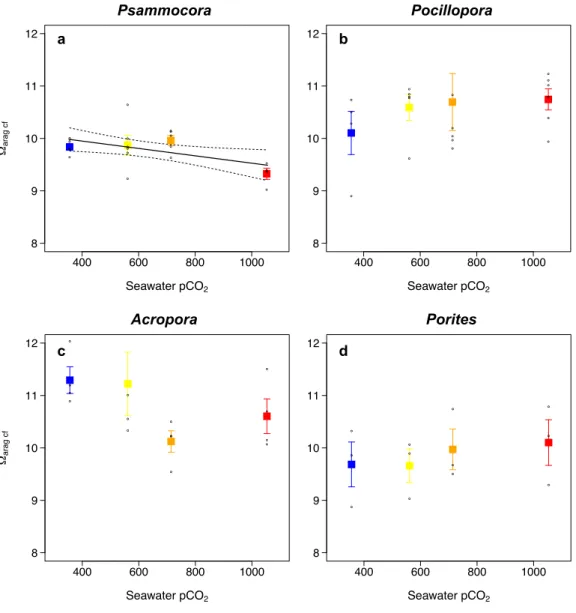
At the end of the 1-year incubation, calcification of Pocillopora and Porites 110
was not affected by the treatments (Fig. 1), while conversely the calcification of 111
Psammocora and Acropora decreased linearly with pCO2 (slope p-value = 0.022 and 112
0.039, respectively, Table S1). Calcification of Lithophyllum also decreased linearly 113
with pCO2 (slope p-value = 0.032, Table S1). 114
pHcf of the four corals exhibited contrasting responses to the treatment after 1 115
year. There was no significant linear relationship between pHcf or DICcf and pCO2 for 116
Porites, whereas in the three other corals (Psammocora, Pocillopora, and Acropora)
117
there were significant linear relationships between pHcf and the pCO2 (slope p-value < 118
0.01, Table S1, Fig. 2). DICcf responded in the opposite direction of pHcf, with higher 119
DICcf in the high pCO2 treatments in these three corals (Fig. 3) (slope p-values = 120
0.008, 0.030, and 0.007; Table S1). 121
For both algae, pHcf decreased linearly with increasing pCO2 (slope p-value = 122
0.012 and < 0.001; for Lithophyllum and Halimeda, respectively; Table S1, Fig. 2). 123
There were no consistent linear relationships between the aragonite Ωcf and 124
pCO2 in three of the four corals (Pocillopora, Acropora, and Porites, Fig. S1, Table 125
S1). However, there was a decrease of Ωcf with increasing pCO2 in Psammocora 126
(Table S1, Fig. S1). Ca2+cf/Ca2+SW was only affected by the pCO2 in Pocillopora (Fig. 127
4)(slope p-value = 0.009, Table S1) with maximum Ca2+cf/Ca2+SW measured in the 128
1053 µatm treatment. 129
130
Seasonal variation in calcifying fluid composition
131
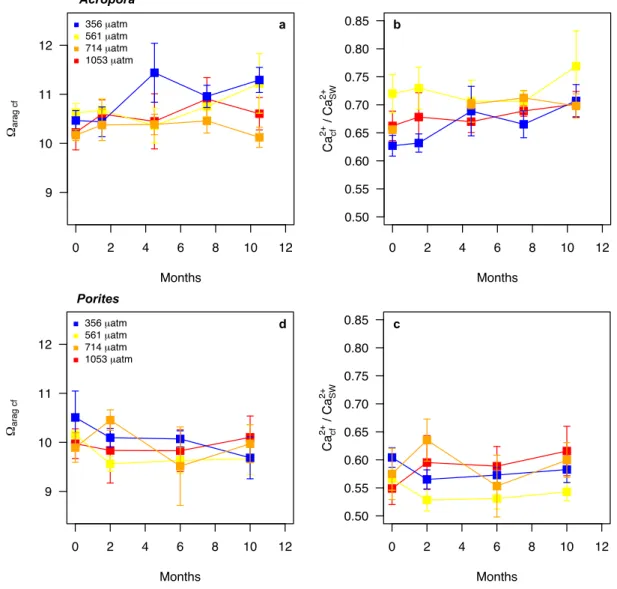
Seasonal variations in calcifying fluid composition were determined on the 132
two corals Acropora and Porites. These corals were selected because they exhibit 133
contrasting morphologies and different potential sensitivities to ocean acidification. In 134
Acropora, pHcf was consistently higher in the 356 µatm treatment (Fig. 5), with a 135
significant effect of the treatment (ANOVA, p < 0.001). There was also a significant 136
effect of treatment (ANOVA, p = 0.045) and time (p = 0.023) on Ωcf that was driven 137
by slightly higher Ωcf in the lowest pCO2 treatment, particularly at the end of the 138
incubation (Fig. S2). In contrast, DICcf (ANOVA, p = 0.096) and Ca2+cf / Ca2+SW (p = 139
0.107) were not affected by the treatment, but were affected by time (both p < 0.001) 140
(Fig. 5 and S2). Seawater temperature and the mean daily light did not affect pHcf and 141
DICcf, while the mean daily light had a positive effect on Ca2+cf / Ca2+SW and Ωcf 142
(Table S2). 143
For Porites, there was no significant effect of the treatment on pHcf (ANOVA, 144
p = 0.773), DICcf (p = 0.835), Ωcf (p = 0.711) and Ca2+cf/Ca2+SW (Fig. 5 and S2). There 145
was a seasonal trend with the lowest pHcf, and the highest DICcf, values recorded 146
during the austral winter (Fig 5). This was driven by a negative effect of temperature 147
and light on pHcf and positive effect of these parameters on DICcf (Table S3). 148
149
Discussion
150 151
During our year-long experiment we found no evidence of acclimatization to 152
elevated pCO2 across four coral and two calcifying algal species. If acclimatization 153
occurred, we would have expected carbonate chemistry in the calcifying fluid to be 154
initially affected by the treatments, then return to levels comparable to that of the 155
controls after one year. Rather, we found that the responses to pCO2 were species-156
specific, occurred rapidly, and persisted over one year. Three of the four coral species 157
and the two macroalgal species exhibited a decrease in pHcf, and an increase in DICcf 158
for the corals, when seawater pCO2 was increased. This is similar to what has been 159
found previously during shorter term experiments17,18. In contrast, the chemistry in the 160
calcifying fluid of Porites did not respond to pCO2. The two species whose 161
calcification was unaffected by OA were from different genera (Pocillopora and 162
Porites), and exhibited different morphologies (branching vs massive). These results
163
confirm the difficulty in predicting species-specific responses to ocean acidification 164
based on functional traits3,27. Additionally, the calcifying fluid chemistry of both 165
species exhibited different responses to increased seawater pCO2, with Porites 166
maintaining homeostatic conditions with changing pCO2 and Pocillopora 167
compensating a decrease in pHcf by increasing [Ca2+] cf.. It is these different 168
mechanisms of maintaining favourable CF chemistry that enable constant 169
calcification, observed here and in our previous work10 (Fig. 6). 170
Two lines of evidence demonstrate the lack of acclimatization of the chemistry 171
at the site of calcification to external changes in seawater. First, pHcf measured in the 172
corals at the end of the experiment exhibited the commonly described decreases in 173
pHcf with seawater pH in three out of four taxa7,28. The similar relationship between 174
pHcf and seawater pH found in the macroalgae also matched previous results from 175
shorter-term laboratory studies10,15,16. Second, the effects of seawater pCO2 on the CF 176
chemistry were consistent across time and varied in a similar manner in all treatments 177
for Acropora and massive Porites sampled at regular intervals (every 3 and 4 months, 178
respectively). Our results therefore suggest that seawater carbonate chemistry acts 179
relatively quickly to alter CF chemistry and that this effect is maintained after one 180
year. Hence, one year of exposure to the different treatments did not improve or 181
worsen the capacity of five of the six corals and macroalgae investigated to up-182
regulate their proton export29 to maintain pHcf at ambient levels. 183
DICcf also displayed a lack of acclimatization. The inverse relationship 184
between DICcf and seawater pH (and therefore pHcf) found at the end of the 185
experiment has been previously shown both during shorter term experiments lasting 186
only a few weeks or months10 and during in situ seasonal observations11,30,31. Similar 187
trends were also found in Goniopora sp. exposed for 6 months to variable and 188
constant pH14. Together, this identifies seawater carbonate chemistry as the main 189
driver of this inverse relationship in numerous corals. It also indicates that the ability 190
to increase DICcf as seawater pH decreases under ocean acidification could be a 191
common feature in many coral genera to limit its negative effects on the precipitation 192
of calcium carbonate. 193
Chemistry in the CF of Porites did not respond to seawater pCO2 from the 194
start to the end of the experiment. This result suggests that the capacity of some corals 195
to control pHcf and DICcf independently of external seawater conditions (i.e massive 196
Porites) is an inherent characteristic. Observations on Porites cylindrica also showed
197
that this species was able to maintain a constant pHcf when exposed to low pH during 198
a 6-month in situ free ocean CO2 enrichment experiment19. The ability of massive 199
Porites to survive under the low pH conditions at CO2 vents has also been linked with 200
its capacity to maintain elevated pHcf23. Taken together, the calcification rates and 201
pHcf of Porites spp. appear to be relatively insensitive to the impacts of OA. However, 202
the response of the Porites genus to OA may be atypical amongst corals. Furthermore, 203
this tolerance may be limited only to particular Porites species, since a pronounced 204
decrease in pHcf with seawater pH was found in P. compressa from Hawaii17 and in 205
some massive Porites sp. genotypes32. 206
pHcf homeostasis24 is not the only mechanism of resistance to OA. Here, 207
calcification of Pocillopora was unaffected by the treatments despite a decrease in 208
pHcf with seawater pH. Similarly, pHcf of Pocillopora damicornis decreased with 209
seawater pH during a two-month laboratory study but calcification remained 210
constant18. The lack of an effect of seawater pH on the calcification of Pocillopora 211
damicornis was explained by the increase in calcium concentration in the calcifying
212
fluid that enabled the corals to maintain constant precipitation of calcium carbonate 213
despite decreasing pHcf33. Here, we observed a similar increase in the calcium 214
concentration of Pocillopora verrucosa when seawater pH decreased, which favoured 215
the maintenance and even the slight (but not statistically significant) increase of Ωarag 216
cf with pCO2. This result suggests that increasing [Ca2+] in response to decreasing pH 217
is a common feature for corals of the genus Pocillopora and could explain the 218
resistance of some Pocilloporidae to OA reported previously34–36. The mechanism 219
responsible for increases in [Ca2+] still need to be confirmed. However, previous 220
evidence points toward an active transport of calcium by various intracellular 221
pathways to the site of calcification37. 222
It has been suggested that short-term laboratory experimental results can be 223
misleading because they do not consider seasonal variations in biotic and abiotic 224
factors. For example, seasonal cycles of pHcf and DICcf, have been documented on 225
massive Porites sp. from the Great Barrier Reef and Ningaloo Reef, Australia11, and 226
Acropora youngei and Pocillopora damicornis from Rottnest Island, Western
227
Australia30. Here, the seasonal cycles in Porites pHcf and DICcf was conserved across 228
pH treatments, suggesting that such cycles are not driven by seawater pH (which were 229
constant across seasons) but rather by other abiotic (light, temperature, nutrient) or 230
biotic parameters (photosynthetic rates, tissue thickness, reproduction cycles, growth 231
rates). Ross et al.30 attributed the seasonal variations in pHcf and DICcf to temperature. 232
We found similar effects of temperature on pHcf and DICcf of Porites. Contrary to 233
conclusions of previous studies11, the presence (Porites) and absence (Acropora) of 234
these seasonal trends in pHcf and DICcf are related to species-specific effects, rather 235
than being artefacts arising from a lack of exposure to natural fluctuations of light and 236
temperature that could ultimately alter interpretations of how seawater pH controls 237
pHcf. This is supported by the fact that decreases in pHcf in response to seawater pH 238
have also occurred in the presence of natural daily pH and oxygen variability in recent 239
prior work15. 240
In conclusion, our study demonstrates that despite the strong capacity of corals 241
and coralline algae to modulate the chemistry at their site of calcification10,15,17, the 242
effects of ocean acidification were manifested after one year under realistic 243
experimental conditions in three corals and in the algae. The magnitude of these 244
effects is species-specific, and species’ resistance to OA over one year can be linked 245
to two main mechanisms studied here. Corals whose calcification was unaffected by 246
OA either (1) maintained pHcf homeostasis (Porites), or (2) increased Ca2+cf 247
(Pocillopora) (Fig. 6). Increasing DICcf under OA is also a compensatory mechanism 248
for decreasing pHcf, but it was not sufficient here to provide resistance to OA. Our 249
results thus suggest that these mechanisms are likely inherent characteristics, and that 250
some corals and calcifying algae do not have the capacity to acclimate to OA, even 251
over 1-year of experimental treatment. While acclimatization over one year did not 252
occur in our study, further work assessing effects over multiple generations will be 253
necessary to investigate the capacity to acclimate across generations. Finally, the 254
results described here confirm that existing species-specific differences in sensitivities 255
to OA will likely shape the composition of future reefs. 256
257 258
Correspondence and requests for materials should be addressed to Steeve Comeau; 259 [email protected] 260 Acknowledgments 261
We thank A.-M. Comeau-Nisumaa, J. D’Olivo, P. Edmunds for support for 262
this study. Funding support was as follows: MTM by an ARC Laureate Fellowship 263
(LF120100049) and ARC Centre of Excellence for Coral Reef Studies 264
(CE140100020), SC by an ARC DECRA (DE160100668), CEC by ARC Centre of 265
Excellence for Coral Reef Studies (CE140100020), and a Rutherford Discovery 266
Fellowship (Royal Society of New Zealand; RDF-VUW1701), RC by a National 267
Science Foundation grant OCE 14- 15268, the Moorea Coral Reef LTER program 268
(NSF OCE 12-36905) and from the Gordon and Betty Moore Foundation. The 269
University of Western Australia’s Centre for Microscopy, Characterisation & 270
Analysis (CMCA). Research was completed under permits issued by the Haut-271
commissariat de la République en Polynésie Francaise (DRRT) (Protocole d’Accueil 272
2015–2016). This is contribution number 286 of the CSUN Marine Biology Program. 273
274
Author contributions
275
SC wrote the paper, prepared the experiment, run the geochemical analyses and 276
analysed the data. CC wrote the paper and conducted geochemical analyses. TMD 277
performed geochemical analyses. SD performed the flume experiment. RC and MTM 278
provided vital laboratory facilities. All authors edited the manuscript, contributed 279
intellectual expertise and approved of its submission. 280
281
Data availability
282
All data are available on the public data repositories BCO-DMO (https://www.bco-283 dmo.org/dataset/756211). 284 285 References 286 287 1. Kroeker, K. J. et al. Impacts of ocean acidification on marine organisms: 288 quantifying sensitivities and interaction with warming. Glob. Change Biol. 19, 289 1884–1896 (2013). 290
2. Eyre, B. D. et al. Coral reefs will transition to net dissolving before end of 291 century. Science 359, 908–911 (2018). 292 3. Comeau, S., Edmunds, P. J., Spindel, N. B. & Carpenter, R. C. Fast coral reef 293 calcifiers are more sensitive to ocean acidification in short-term laboratory 294 incubations. Limnol. Oceanogr. 59, 1081–1091 (2014). 295 4. Okazaki, R. R. et al. Species-specific responses to climate change and 296 community composition determine future calcification rates of Florida Keys 297 reefs. Glob. Change Biol. 23, 1023–1035 (2017). 298 5. Cole, C., Finch, A. A., Hintz, C., Hintz, K. & Allison, N. Effects of seawater pCO2 299 and temperature on calcification and productivity in the coral genus Porites 300 spp.: an exploration of potential interaction mechanisms. Coral Reefs 37, 301 471–481 (2018). 302 6. Tambutté, S. et al. Coral biomineralization: From the gene to the 303 environment. J. Exp. Mar. Biol. Ecol. 408, 58–78 (2011). 304 7. McCulloch, M., Falter, J., Trotter, J. & Montagna, P. Coral resilience to ocean 305 acidification and global warming through pH up-regulation. Nat. Clim. Change 306 2, 623–627 (2012). 307 8. Venn, A. A. et al. Impact of seawater acidification on pH at the tissue–skeleton 308 interface and calcification in reef corals. Proc. Natl. Acad. Sci. 110, 1634–1639 309 (2013). 310 9. Venn, A., Tambutté, E., Holcomb, M., Allemand, D. & Tambutté, S. Live Tissue 311 Imaging Shows Reef Corals Elevate pH under Their Calcifying Tissue Relative 312 to Seawater. PLOS ONE 6, e20013 (2011). 313
10. Comeau, S., Cornwall, C. E., DeCarlo, T. M., Krieger, E. & McCulloch, M. T. 314 Similar controls on calcification under ocean acidification across unrelated 315 coral reef taxa. Glob. Change Biol. 24, 4857–4868 316 11. McCulloch, M. T., D’Olivo, J. P., Falter, J., Holcomb, M. & Trotter, J. A. Coral 317 calcification in a changing World and the interactive dynamics of pH and DIC 318 upregulation. Nat. Commun. 8, 15686 (2017). 319 12. Sevilgen, D. S. et al. Full in vivo characterization of carbonate chemistry at the 320 site of calcification in corals. Sci. Adv. 5, eaau7447 (2019). 321 13. Allison, N. et al. Corals concentrate dissolved inorganic carbon to facilitate 322 calcification. Nat. Commun. 5, 5741 (2014). 323 14. Hofmann, L. C., Koch, M. & Beer, D. de. Biotic Control of Surface pH and 324
Evidence of Light-Induced H+ Pumping and Ca2+-H+ Exchange in a Tropical 325 Crustose Coralline Alga. PLOS ONE 11, e0159057 (2016). 326 15. Cornwall, C. E. et al. Resistance of corals and coralline algae to ocean 327 acidification: physiological control of calcification under natural pH 328 variability. Proc R Soc B 285, 20181168 (2018). 329 16. Cornwall, C. E., Comeau, S. & McCulloch, M. T. Coralline algae elevate pH at the 330 site of calcification under ocean acidification. Glob. Change Biol. 23, 4245– 331 4256 (2017). 332 17. Schoepf, V., Jury, C. P., Toonen, R. J. & McCulloch, M. T. Coral calcification 333 mechanisms facilitate adaptive responses to ocean acidification. Proc R Soc B 334 284, 20172117 (2017). 335 18. Comeau, S., Cornwall, C. E. & McCulloch, M. T. Decoupling between the 336 response of coral calcifying fluid pH and calcification to ocean acidification. 337 Sci. Rep. 7, 7573 (2017). 338
19. D’Olivo, J. P. & McCulloch, M. T. Response of coral calcification and calcifying 339 fluid composition to thermally induced bleaching stress. Sci. Rep. 7, 2207 340 (2017). 341 20. Tambutté, E. et al. Morphological plasticity of the coral skeleton under CO2-342 driven seawater acidification. Nat. Commun. 6, 7368 (2015). 343 21. Barkley, H. C. et al. Changes in coral reef communities across a natural 344 gradient in seawater pH. Sci. Adv. 1, e1500328 (2015). 345 22. Fabricius, K. E. et al. Losers and winners in coral reefs acclimatized to 346 elevated carbon dioxide concentrations. Nat. Clim. Change 1, 165–169 347 (2011). 348 23. Wall, M. et al. Internal pH regulation facilitates in situ long-term acclimation 349 of massive corals to end-of-century carbon dioxide conditions. Sci. Rep. 6, 350 30688 (2016). 351 24. Georgiou, L. et al. pH homeostasis during coral calcification in a free ocean 352 CO2 enrichment (FOCE) experiment, Heron Island reef flat, Great Barrier 353 Reef. Proc. Natl. Acad. Sci. 112, 13219–13224 (2015). 354 25. Carpenter, R. C., Lantz, C. A., Shaw, E. & Edmunds, P. J. Responses of coral reef 355 community metabolism in flumes to ocean acidification. Mar. Biol. 165, 66 356 (2018). 357 26. Comeau, S., Carpenter, R. C., Lantz, C. A. & Edmunds, P. J. Ocean acidification 358 accelerates dissolution of experimental coral reef communities. 359 Biogeosciences 12, 365–372 (2015). 360 27. Barner, A. K. et al. Generality in multispecies responses to ocean acidification 361 revealed through multiple hypothesis testing. Glob. Change Biol. 0, 362
28. Holcomb, M. et al. Coral calcifying fluid pH dictates response to ocean 363 acidification. Sci. Rep. 4, 5207 (2014). 364 29. Ries, J. B. Skeletal mineralogy in a high-CO2 world. J. Exp. Mar. Biol. Ecol. 403, 365 54–64 (2011). 366 30. Ross, C. L., Falter, J. L. & McCulloch, M. T. Active modulation of the calcifying 367 fluid carbonate chemistry (δ11B, B/Ca) and seasonally invariant coral 368 calcification at sub-tropical limits. Sci. Rep. 7, 13830 (2017). 369 31. Ross, C. L., Schoepf, V., DeCarlo, T. M. & McCulloch, M. T. Mechanisms and 370 seasonal drivers of calcification in the temperate coral Turbinaria reniformis 371 at its latitudinal limits. Proc R Soc B 285, 20180215 (2018). 372 32. Allison, N. et al. The effect of ocean acidification on tropical coral 373 calcification: Insights from calcification fluid DIC chemistry. Chem. Geol. 497, 374 162–169 (2018). 375 33. DeCarlo, T. M., Comeau, S., Cornwall, C. E. & McCulloch, M. T. Coral resistance 376 to ocean acidification linked to increased calcium at the site of calcification. 377 Proc R Soc B 285, 20180564 (2018). 378 34. Comeau, S. et al. Pacific-wide contrast highlights resistance of reef calcifiers 379 to ocean acidification. Proc. R. Soc. Lond. B Biol. Sci. 281, 20141339 (2014). 380 35. Putnam, H. M., Mayfield, A. B., Fan, T. Y., Chen, C. S. & Gates, R. D. The 381 physiological and molecular responses of larvae from the reef-building coral 382 Pocillopora damicornis exposed to near-future increases in temperature and 383 pCO2. Mar. Biol. 160, 2157–2173 (2013). 384 36. Kornder, N. A., Riegl, B. M. & Figueiredo, J. Thresholds and drivers of coral 385 calcification responses to climate change. Glob. Change Biol. (2018). 386 doi:10.1111/gcb.14431 387
37. Marshall, A. T., Clode, P. L., Russell, R., Prince, K. & Stern, R. Electron and ion 388 microprobe analysis of calcium distribution and transport in coral tissues. J. 389 Exp. Biol. 210, 2453–2463 (2007). 390 391
Methods
392
Sample collection and preparation
393
This study was carried out in Moorea, French Polynesia, at the Richard B. Gump 394
Research station between November 2015 and November 2016. For this experiment 395
four taxa of coral were used, Psammocora profundacella (Psammocora), Acropora 396
pulchra (Acropora), Pocillopora verrucosa (Pocillopora), and massive Porites spp.
397
(Porites), and two taxa of calcifying macroalgae, the coralline alga Lithophyllum 398
kotschyanum (Lithophyllum) and the green Halimeda minima (Halimeda). Porites,
399
Lithophyllum and Halimeda were part of the back reef communities recreated in the
400
flumes25. To increase the number of taxa tested, Psammocora, Acropora, and 401
Pocillopora were maintained in the upstream side of the flumes on separated racks
402
next to the tested communities. These taxa were selected because these taxa are 403
dominant members of the benthic community in the back reef of Moorea38. Twenty-404
four Acropora and Pocillopora were sampled from a common garden at 3 m depth on 405
the North Shore of Moorea (See 39 for details). The 5-cm long branches were selected 406
from 6 different colonies for each species. One coral of each colony was used for each 407
pCO2 condition. Twenty-four ~ 5-cm in diameter Psammocora were from the back 408
reef where they commonly are found growing on calcareous rubble. Halimeda were 409
hand-picked from the back reef. Porites (~ 10-cm diameter, n = 5 per treatment) and 410
Lithophyllum (~ 8 cm in diameter, n = 4 per treatment) were chiselled off the back
411
reef of the North Shore of Moorea25. Psammocora and Porites were cleaned in the 412
laboratory and the dead skeletons on which they were growing were sawed off, and 413
the exposed skeletons were covered with epoxy-glue. Corals and Lithophyllum were 414
glued to plastic bases with Z-spar epoxy to facilitate handling and labelling of the 415
organisms. Halimeda were placed in black mesh cages positioned at the end of the 416 flumes. 417 418 Experimental set-up 419
The experimental settings used in this experiment were the same as in a 420
parallel experiment that tested the effects of four pCO2 regimes on back reef 421
communities assembled in 5 m flumes 25,38. Complete details of the experimental set-422
up are provided in Carpenter et al.25. 423
Briefly, the organisms were maintained in four 5 x 0.3 x 0.3 m outdoor 424
flumes26 for 1 year. After an acclimation period of one week, seawater pCO2 was 425
maintained at ambient value in one flume (360 µatm) and was ramped up to the other 426
three levels (~360, 560, 760, and 1060 µatm) over 24 hours. pCO2 was maintained 427
with a negative feedback pH controller that regulated the bubbling of pure CO2 to 428
maintain seawater pH at the target pH. pH varied daily by ~ 0.1 pH unit to simulate 429
current levels of diurnal variability in the back reef of Moorea25. This four pCO2 level 430
design was chosen to detect linear effects of pCO2 on organisms3. Using this type of 431
design can circumvent some of the issues around low replication of experimental 432
tanks40. Discrete measurements of pHT and total alkalinity were made to check the 433
carbonate chemistry in the flumes. pHT was measured directly in the flume using a 434
handheld pH meter that was mounted with a DG 115-SC electrode (Mettler Toledo, 435
Columbus, OH, USA) calibrated with a TRIS buffer. Total alkalinity was measured 436
using an open-cell titrator (T50, Mettler Toledo) and accuracy was checked using 437
certified seawater. 438
Seawater was circulated in the flumes at 0.1 m s-1 to match the average yearly 439
seawater velocity in the back reef of Moorea41. Freshly pumped sand filtered seawater 440
(corresponding to a mesh size of 500 µm) was continuously delivered to the flumes at 441
~ 5 L min-1 to maintain constant AT and dissolved oxygen levels within the flumes. 442
The corals were not fed but small particles (i.e. < 500 µm) were not filtered and 443
served as potential food source. Light levels were adjusted with shade cloths to match 444
maximum intensities typically ranging between 1000 and 2000 µmol quanta m-2 s-1 in 445
the back reef of Moorea. Because the flumes were exposed to natural sunlight, light 446
varied strongly seasonally and daily. Temperature was controlled to approximate the 447
mean monthly seawater temperature in the back reef of Moorea, which ranged from 448 29.3°C in April to 25.8°C in September38. 449 450 Calcification 451
Calcification was investigated to determine its link with the calcifying fluid 452
chemistry. Net calcification of the organisms was determined using the buoyant 453
weight technique42. The difference in buoyant weight between the beginning and end 454
of the one year-long incubation was converted to dry weight of aragonite for the 455
corals and calcite for the Lithophyllum to calculate net calcification. Calcification 456
rates were normalized to surface area (mg cm-2) determined using the aluminium foil 457
or the wax dipping method at the end of the incubation. Organisms that exhibited 458
clear signs of damage (e.g. broken branches) that could have affected their weight 459
were excluded from the calcification analysis (4 Psammocora, 2 Pocillopora, and 1 460 Acropora). 461 462 pHcf and DICcf 463
Skeletons were stained by placing the organisms for 48 hours in seawater 464
enriched with the fluorescent dye calcein at 50 mg L-1 with a pH adjusted to ~8.1 by 465
the addition of NaOH prior to the start of the experiment. The stain line was used to 466
identify the part of the skeleton that grew during the experiment (Fig. S3). The δ11B 467
proxy method was used to estimate pH in the calcifying fluid of all taxa (pHcf)7 and 468
the δ11B and B/Ca method was used to estimate the dissolved inorganic carbon 469
concentration in the calcifying fluid (DICcf) in the aragonitic taxa 11,43. Measurements 470
of geochemistry were conducted on the dead skeleton after the experimental period. 471
Skeleton was sampled from the tip of the branches or the top 1–2 mm of the skeleton 472
for the 6 Pocillopora and Psammocora individuals, and 3 Lithophyllum per treatment. 473
This portion of the skeleton was selected to sample material deposited during the last 474
months of the experiment to detect any potential acclimatization to the experimental 475
conditions. Because Halimeda degraded in the flumes, they were replaced several 476
times during the experiment. The sampling for geochemistry was conducted on 3 477
Halimeda per treatment that were in the flumes for ~ 2 months. Only the top segments
478
were used to ensure that they developed under the experimental conditions. Because 479
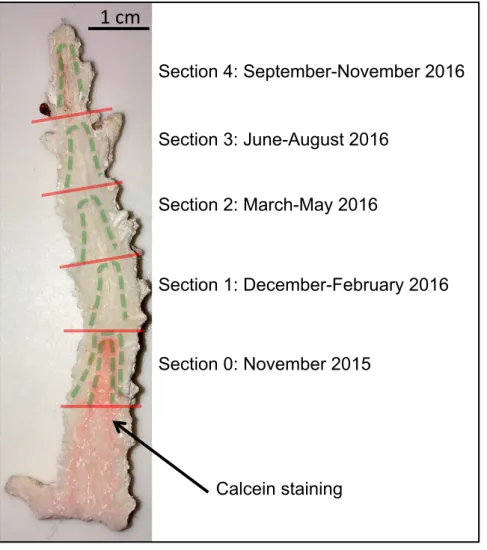
the branches of Acropora extend linearly and quickly (i.e., 5-10 cm y-1) it was 480
possible to sample from four individuals per treatment skeleton parts that 481
corresponded to different time points of the year of incubation (Fig. S3). The first 482
section corresponded to the start of the experiment (i.e. the stain line). The rest of the 483
12 months linear extension was divided in four and was assumed to represent the 484
growth after 0-3, 3-6, 6-9, and 9-12 months in the different treatments. Likewise, for 485
three Porites individuals per treatment, four portions of the skeleton were sampled. 486
One sample of the skeleton was taken below the stain line to represent the conditions 487
prior to the experiment and the skeleton grown above the stain line was divided in 488
three equal parts that were assumed to roughly represent the growth during the period 489
0–4, 4–8, and 8–12 months. Seasonal changes in temperature were confirmed using 490
the inverse relationship between Sr/Ca and temperature for Porites. The sections 491
prior to the start of the experiment and the one just below the tissue (section month 8-492
12) had the highest Sr/Ca corresponding to the coldest temperature recorded during 493
the austral winter to early spring (July to October). The lowest Sr/Ca were recorded 494
for the period 0-4 and 4-8 months confirming that in these sections of the skeleton 495
corresponded to the months November to February and March to June, respectively, 496
when temperature where the highest in the flumes (see Table S1 in38). The Sr/Ca 497
proxy temperature reconstructions were not successful with Acropora, probably 498
because of its perforate skeleton. 499
The entire selected portions of the skeleton were crushed to powder in a 500
mortar and pestle. Therefore, all measurements represent an integration of the average 501
conditions in the calcifying fluid (over two months) when the selected portions of the 502
skeleton were formed. The measurements integrate the diel effects of light and pH 503
that varied similarly across treatments. All powders were processed subsequently 504
in the clean laboratory of the Advanced Geochemical Facility for Indian Ocean 505
Research (AGFIOR, University of Western Australia (UWA) for dissolution and 506
dilution to 10-ppm Ca solutions. Ten mg of each sample was placed in 6.25 % NaClO 507
for 15 mins, rinsed in Milli-Q water then dried for 24 h. Samples were then dissolved 508
in 0.51 N HNO3, and the δ11B was quantitatively separated on ion exchange columns. 509
δ11B was measured on a multicollector inductively coupled plasma mass spectrometry 510
(NU II). Measurements of the international carbonate standard JCP-1 yielded a mean 511
value of 24.42 ± 0.05 ‰ (mean ± SE, n = 12), which is similar to the 24.33 ± 0.11 ‰ 512
reported previously44. Calculations of pHcf based on δ11B were made in R using the 513 calculations of 45: 514 pH!"= pK!− log (! !!! !"! !!!!!"#$) !!"!!"!!!!!"#$!!!!!!"!!""" !!"!!"!! (1) 515
where pKB is the dissociation constant dependent on temperature and salinity, 516
δ11Bsw = 39.61, and αB3-B4 is the boron isotopic fractionation factor for the pH 517
dependent equilibrium of the borate (B(OH)4-) relative to the boric acid (B(OH)3) 518
species in the calcifying fluid, with a value of 1.027246. Temperature and salinity 519
were representative of the average conditions in the flumes at which the selected 520
portions of the skeleton were grown. 521
B/Ca ratios, measured on the same material, and δ11B, were utilized to 522
determine [CO32-] and [DIC] at the site of calcification [DIC]cf following11 for corals. 523
B/Ca ratios were determined on the same aliquot of the solution used for pHcf 524
estimates, and DICcf was calculated from estimates of carbonate ion concentrations 525
using the following equations described in McCulloch et al.11: 526
CO!!!
!"= K! B OH !! !" B Ca !"!"
! (2)
527
Where KD = KD.0 exp(-kKD[H+]T) with = 2.97 ± 0.17×10⁻³ ( ± 95% CI),
528
= 0.0202 ± 0.042. The concentration of DICcf was then calculated from estimates of 529
pHcf and [CO32-]cf. It was not possible to determine correct DICcf values for Halimeda 530
likely because of dissolution and precipitation of calcium carbonate between the day 531
and the night. DICcf was not determined on Lithophyllum because their skeleton is 532
made of high Mg Calcite for which no inorganic precipitation experiment linking 533
B/Ca and [CO32-]cf have been made. 534
535
Raman spectroscopy
536
Confocal Raman spectroscopy was used to determine for the corals estimates 537
of calcifying fluid aragonite saturation state Ωarag cf47. Measurements were conducted 538
on a WITec Alpha300RA+ using a 785 nm infrared laser, a 20x objective with 0.5 539
numerical aperture, and a 1200 mm-1 grating to achieve a spectral resolution of 540
approximately 1.3 cm-1. Skeleton powders were placed on glass slides and topography 541
maps were made with the TrueSurface module. The automated stage followed the 542
topography while conducting Raman measurements so that the optics were always in 543
focus on the sample surfaces. 100 spectra were collected per sample in a 300 µm by 544
300 µm grid using 1 s integrations. Spectra with poor signal (< 50 intensity units) or 545
contaminated by cosmic rays were excluded. 546
The widths of the v1 peaks were used as proxy measures of Ωarag cf47. CaCO3 547
minerals precipitating from more supersaturated solutions incorporate more impurities 548
and are more disordered, which causes Raman peak broadening due to greater 549
distributions of C-O bond lengths 47. We used the abiogenic aragonite calibration 550
equation of 47 to calculate Ωarag cf for the coral species from the v1 full width at half 551
maximum intensity (FWHM). The mean and median of the standard errors for each 552
individual Ωarag cf (n = 193) were 0.19 and 0.16 units, respectively, where these 553
uncertainties are based on the 100 replicate spectra collected for each individual. 554
Repeated measurement of JCp-1 were used for instrument drift correction based on its 555
Ωarag cf of 12.3 (DeCarlo et al., 2017). The largest of these Ωarag cf corrections, which 556
were applied systematically to all samples measured in different analytical sessions, 557
was 2 units. Analyses of Porites, Psammocora, and Pocillopora were all conducted 558
within single analytical sessions, and therefore comparisons among treatments are not 559 D,0 K D K k
sensitive to JCp-1 drift corrections. Acropora samples were analysed in two sessions, 560
however, the Ωarag cf means of the corrected Acropora data were indistinguishable 561
between the two (10.65 ± 0.14 and 10.59 ± 0.08, standard errors), making it unlikely 562
that the JCp-1 corrections led to any artificial differences. 563
564
[Ca2+]cf determination
565
[Ca2+]cf of corals was calculated as: 566 Ca!! !"= Ω!"∗ !!" CO ! !! !" (1) 567
where [CO!!!]cf and Ω
arag cf are derived from boron systematics and Raman
568
spectroscopy, respectively47. Ca!"!! Ca !"
!! ratios were calculated by normalizing to
569
[Ca2+]sw, which was estimated from seawater salinity (average = 35.5). Estimates of 570
[Ca2+]sw were made based on the assumptions that metabolic activity (calcification) 571
did not change the relationship seawater salinity [Ca2+]sw. This assumption was 572
supported by the fact that seawater was pumped from Cook’s Bay where there is no 573
reef and only very few corals. 574
575
Statistical analyses
576
The assumptions of normality and equality of variance were evaluated through 577
graphical analyses of residuals using the R software. Because the experiment was 578
designed to detect linear effects of pCO2 on the tested organisms, linear relationships 579
between the dependant variables at the end of the experiment (calcification, pHcf, 580
DICcf, Ωarag cf, and Ca2+cf) and the explanatory variable (pCO2) were investigated. To 581
test for the effects of time on pHcf, DICcf, Ωarag cf, and Ca2+cf of Acropora and Porites, 582
repeated measured ANOVAs were used with individual coral as a random factor and 583
the treatment and time as fixed effects. The effects of light, temperature and pCO2 on 584
pHcf, DICcf, Ωarag cf, and Ca2+cf of Acropora and Porites were tested using multiple 585
linear regressions. All statistical analyses were done with R and the package nlme was 586
used for the repeated measured ANOVAs. 587
References (Methods section) 589 590 38. Edmunds, P. J., Doo, S. S. & Carpenter, R. C. Changes in coral reef community 591 structure in response to year-long incubations under contrasting pCO2 592 regimes. (In review). 593 39. Shaw, E. C., Carpenter, R. C., Lantz, C. A. & Edmunds, P. J. Intraspecific 594 variability in the response to ocean warming and acidification in the 595 scleractinian coral Acropora pulchra. Mar. Biol. 163, 210 (2016). 596 40. Cornwall, C. E. & Hurd, C. L. Experimental design in ocean acidification 597 research: problems and solutions. ICES J. Mar. Sci. 73, 572–581 (2016). 598 41. Hench. Episodic circulation and exchange in a wave-driven coral reef and 599 lagoon system. Limnol. Oceanogr. 53, 2681–2694 (2008). 600 42. Davies, P. S. Short-term growth measurements of corals using an accurate 601 buoyant weighing technique. Mar. Biol. 101, 389–395 (1989). 602 43. Holcomb, M., DeCarlo, T. M., Gaetani, G. A. & McCulloch, M. Factors affecting 603 B/Ca ratios in synthetic aragonite. Chem. Geol. 437, 67–76 (2016). 604 44. Foster, G. L. et al. Interlaboratory comparison of boron isotope analyses of 605 boric acid, seawater and marine CaCO3 by MC-ICPMS and NTIMS. Chem. Geol. 606 358, 1–14 (2013). 607 45. Trotter, J. et al. Quantifying the pH ‘vital effect’ in the temperate 608 zooxanthellate coral Cladocora caespitosa: Validation of the boron seawater 609 pH proxy. Earth Planet. Sci. Lett. 303, 163–173 (2011). 610 46. Klochko, K., Kaufman, A. J., Yao, W., Byrne, R. H. & Tossell, J. A. Experimental 611 measurement of boron isotope fractionation in seawater. Earth Planet. Sci. 612 Lett. 248, 276–285 (2006). 613
47. DeCarlo, T. M. et al. Coral calcifying fluid aragonite saturation states derived 614
from Raman spectroscopy. Biogeosciences 14, 5253–5269 (2017). 615
Legends
617 618
Fig. 1. Effects of four pCO2 treatments (~360, 550, 700 and 1050 µatm) on the 619
surface area-normalized net calcification rates. Calcification over the 1-year long 620
experiment was measured on the corals Psammocora profundacella (A), Pocillopora 621
verrucosa (B), Acropora pulchra (C), massive Porites sp. (D), and the coralline alga
622
Lithophyllum kotschyanum (E). Individual rates are shown as dots and the squares
623
represent the mean ± SE (n = 5 for Psammocora; n =6 or 5 for Pocillopora and 624
Acropora; n = 5 for Porites and n = 4 for Lithophyllum). Linear regressions and the
625
95% confidence intervals are shown when the regressions had a statistically 626
significant slope (p < 0.05). 627
628
Fig. 2. Estimates of pH in the calcifying fluid (pHcf) at the end of the 1-year 629
experiment. The geochemical proxy δ11B was used to estimate pHcf of the corals 630
Psammocora profundacella (A), Pocillopora verrucosa (B), Acropora pulchra (C),
631
and massive Porites sp. (D) and the algae Lithophyllum kotschyanum (E) and 632
Halimeda minima (F). Individual rates are shown as dots and the squares represent the
633
mean ± SE (n = 6 or 5 for Psammocora and Pocillopora; n = 4 for Acropora; n = 3 634
for Porites and Halimeda, and n = 4 for Lithophyllum). Linear regressions and the 635
95% confidence intervals are shown when the regressions had a statistically 636
significant slope (p < 0.05). 637
638
Fig. 3. Estimates of dissolved inorganic carbon in the calcifying fluid (DICcf) at the 639
end of the 1-year incubation period. The geochemical proxy δ11B and B/Ca were used 640
to estimate DICcf of the corals Psammocora profundacella (A), Pocillopora verrucosa 641
(B), Acropora pulchra (C), and massive Porites sp.(D). Individual rates are shown as 642
dots and the squares represent the mean ± SE (n = 6 or 5 for Psammocora and 643
Pocillopora; n = 4 for Acropora; n = 3 for Porites). Linear regressions and the 95%
644
confidence intervals are shown when the regressions had a statistically significant 645
slope (p < 0.05). 646
647
Fig 4. Ratio between the calcium in the calcifying fluid (Ca2+cf) and the calcium in 648
seawater (Ca2+SW) in the four studied corals. Ca2+cf was calculated from estimates of 649
aragonite saturation state and DICcf. Individual rates are shown as dots and the 650
squares represent the mean ± SE (n = 6 or 5 for Psammocora and Pocillopora; n = 4 651
for Acropora; n = 3 for Porites). Linear regressions and the 95% confidence intervals 652
are shown when the regressions had a statistically significant slope (p < 0.05). 653
654
Fig. 5. Temporal variations of A. pulchra and massive Porites sp. calcifying fluid pH
655
and DIC. The skeleton of A. pulchra was sampled to select sections grown at the start 656
of the experiment, and after ~ 0-3, 3-6, 6-9 and 9-12 months of experiment (panels A 657
and B), while the skeleton of massive Porites sp. was sampled to select sections 658
corresponding to the start of the experiment, and after ~ 0-4, 4-8, 8-12 months of 659
experiment (panels C and D). Month 0 corresponds to November 2015. Error bars 660
show SE. 661
662
Fig. 6. Schematic summary of the responses to ocean acidification measured in the
663
corals Acropora pulchra, Psammocora profundacella, massive Porites sp., and 664
Pocillopora verruca. The calcifying fluid chemistry of the two corals whose
665
calcification was affected by OA exhibited a decrease in pHcf and an increase in 666
DICcf, while Ca2+cf was constant. In contrast, in the corals with calcification 667
unaffected by OA two different responses were found in Porites and Pocillopora. 668
Pocillopora Acropora Psammocora Lithophyllum Porites a b c d e 400 600 800 1000 0.0 0.2 0.4 0.6 0.8 Psammocora Seawater pCO2 Calcification m g C a C O3 c m − 2 d − 1 ● ● ● ● ● ● ● ● ● ● ● ● ● ● ● ● ● ● ● ● 400 600 800 1000 0.0 0.2 0.4 0.6 0.8 Pocillopora Seawater pCO2 Calcification m g C a C O3 c m − 2 d − 1 ● ● ● ● ● ● ● ● ● ● ● ● ● ● ● ● ● ● ● ● ● ● 400 600 800 1000 0.0 0.2 0.4 0.6 0.8 Acropora Seawater pCO2 Calcification m g C a C O3 c m − 2 d − 1 ● ● ● ● ● ● ● ● ● ● ● ● ● ● ● ● ● ● ● ● ● ● ● 400 600 800 1000 0.0 0.2 0.4 0.6 0.8 Porites Seawater pCO2 Calcification m g C a C O3 c m − 2 d − 1 ● ● ● ● ● ● ● ● ● ● ● ● ● ● ● ● ● ● ● ● 400 600 800 1000 0.00 0.05 0.10 0.15 0.20 Lithophyllum Seawater pCO2 Calcification m g C a C O3 c m − 2 d − 1 ● ● ● ● ● ● ● ● ● ● ● ● ● ● ● ●
Pocillopora Acropora Psammocora Halimeda Lithophyllum Porites a b c d e f 400 600 800 1000 8.2 8.3 8.4 8.5 8.6 8.7 Psammocora Seawater pCO2 p HCF ● ● ● ● ● ● ● ● ● ● ● ● ● ● ● ● ● ● ● ● ● ● 400 600 800 1000 8.2 8.3 8.4 8.5 8.6 8.7 Pocillopora Seawater pCO2 p HCF ● ● ● ● ● ● ● ● ● ● ● ● ● ● ● ● ● ● ● ● ● ● ● ● 400 600 800 1000 8.2 8.3 8.4 8.5 8.6 8.7 Acropora Seawater pCO2 p HCF ● ● ● ● ● ● ● ● ● ● ● ● ● ● ● ● 400 600 800 1000 8.2 8.3 8.4 8.5 8.6 8.7 Porites Seawater pCO2 p HCF ● ● ● ● ● ● ● ● ● ● ● ● 400 600 800 1000 8.4 8.5 8.6 8.7 8.8 Lithophyllum Seawater pCO2 p HCF ● ● ● ● ● ● ● ● ● ● ● ● ● ● 400 600 800 1000 8.2 8.3 8.4 8.5 8.6 Halimeda Seawater pCO2 p HCF ● ● ● ● ● ● ● ● ●
Pocillopora Psammocora Porites Acropora a b c d 400 600 800 1000 2600 2800 3000 3200 3400 3600 Psammocora Seawater pCO2 D IC CF ( µ m o l k g − 1 ) ● ● ● ● ● ● ● ● ● ● ● ● ● ● ● ● ● ● ● ● 400 600 800 1000 2600 2800 3000 3200 3400 3600 Pocillopora Seawater pCO2 D IC CF ( µ m o l k g − 1 ) ● ● ● ● ● ● ● ● ● ● ● ● ● ● ● ● ● ● ● ● ● ● ● 400 600 800 1000 3200 3400 3600 3800 4000 4200 4400 4600 Acropora Seawater pCO2 D IC CF ( µ m o l kg − 1 ) ● ● ● ● ● ● ● ● ● ● ● ● ● ● ● ● 400 600 800 1000 3200 3400 3600 3800 4000 4200 4400 4600 Porites Seawater pCO2 D IC CF ( µ m o l k g − 1 ) ● ● ● ● ● ● ● ● ● ● ● ●
Pocillopora Psammocora Porites Acropora a b c d 400 600 800 1000 0.5 0.6 0.7 0.8 0.9 1.0 1.1 Psammocora Seawater pCO2 C acf 2+ C asw 2+ ● ● ● ● ● ● ● ● ● ● ● ● ● ● ● ● ● ● ● ● 400 600 800 1000 0.5 0.6 0.7 0.8 0.9 1.0 1.1 Pocillopora Seawater pCO2 C acf 2+ C asw 2+ ● ● ● ● ● ● ● ● ● ● ● ● ● ● ● ● ● ● ● ● 400 600 800 1000 0.5 0.6 0.7 0.8 0.9 1.0 1.1 Acropora Seawater pCO2 C acf 2+ C asw 2+ ● ● ● ● ● ● ● ● ● ● ● ● ● ● ● ● 400 600 800 1000 0.5 0.6 0.7 0.8 0.9 1.0 1.1 Porites Seawater pCO2 C acf 2+ C asw 2+ ● ● ● ● ● ● ● ● ● ● ● ●
Acropora Porites a b c d 0 2 4 6 8 10 12 8.35 8.40 8.45 8.50 8.55 8.60 Months p Hcf 356 µatm 561 µatm 714 µatm 1053 µatm 0 2 4 6 8 10 12 3600 3800 4000 4200 4400 4600 4800 Months D IC cf ( µ m o l k g − 1 ) 0 2 4 6 8 10 12 9 10 11 12 Months Ωar ag cf 356 µatm 561 µatm 714 µatm 1053 µatm 0 2 4 6 8 10 12 0.50 0.55 0.60 0.65 0.70 0.75 0.80 0.85 Months C acf 2+ / C aSW 2+ 0 2 4 6 8 10 12 8.35 8.40 8.45 8.50 8.55 8.60 Massive Porites Months p Hcf 356 µatm 561 µatm 714 µatm 1053 µatm 250 300 350 400 450 8.35 8.40 8.45 8.50 8.55 8.60 Massive Porites Light p Hcf 356 µatm 561 µatm 714 µatm 1053 µatm 26.0 26.5 27.0 27.5 28.0 28.5 29.0 8.35 8.40 8.45 8.50 8.55 8.60 Massive Porites Light p Hcf 356 µatm 561 µatm 714 µatm 1053 µatm 0 2 4 6 8 10 12 3600 3800 4000 4200 4400 4600 4800 Months D ICcf ( µ m o l k g − 1 ) 0 2 4 6 8 10 12 8.35 8.40 8.45 8.50 8.55 8.60 Massive Porites Months p Hcf 356 µatm 561 µatm 714 µatm 1053 µatm 250 300 350 400 450 8.35 8.40 8.45 8.50 8.55 8.60 Massive Porites Light p Hcf 356 µatm 561 µatm 714 µatm 1053 µatm 26.0 26.5 27.0 27.5 28.0 28.5 29.0 8.35 8.40 8.45 8.50 8.55 8.60 Massive Porites Light p Hcf 356 µatm 561 µatm 714 µatm 1053 µatm 0 2 4 6 8 10 12 3600 3800 4000 4200 4400 4600 4800 Months D IC cf ( µ m o l k g − 1 )
Species-specific response
of calcification to OA
Affected
Not affected
pH
DIC Ca
2+Homeostasis
pH
DIC Ca
2+Ca
2+ cfincrease
Psammocora Acropora M P F B P S B P F B P F B I S B I S B I S M P F N-B CW S N-B CW S B CW F B CW S N-B CW S B CW F In S In S M P F B P S B P F B P F B I S B I S B I S M P F N-B CW S N-B CW S B CW F B CW S N-B CW S B CW F In S In S Porites PocilloporaCalcifying fluid Calcifying fluid
pH
DIC Ca
2+Fig. S1. Estimates of the aragonite saturation state in the calcifying fluid (Ωarag cf) of corals at the end of the 1-year incubation. Confocal Raman spectroscopy was used to estimate Ωarag cf of the corals Psammocora profundacella (A), Pocillopora verrucosa (B), Acropora pulchra (C), and massive Porites sp. (D). Individual rates are shown as dots and the squares represent the mean ± SE (n = 6 or 5 for Psammocora and
Pocillopora; n = 4 for Acropora; n = 3 for Porites). Linear regressions and the 95%
confidence intervals are shown when the regressions had a statistically significant slope (p < 0.05). Pocillopora Psammocora Porites Acropora a b c d 400 600 800 1000 8 9 10 11 12 Psammocora Seawater pCO2 Ωar ag cf ● ● ● ● ● ● ● ● ● ● ● ● ● ● ● ● ● ● ● ● ● 400 600 800 1000 8 9 10 11 12 Pocillopora Seawater pCO2 Ωar ag cf ● ● ● ● ● ● ● ● ● ● ● ● ● ● ● ● ● ● ● ● 400 600 800 1000 8 9 10 11 12 Acropora Seawater pCO2 Ωar ag cf ● ● ● ● ● ● ● ● ● ● ● ● ● ● ● 400 600 800 1000 8 9 10 11 12 Porites Seawater pCO2 Ωar ag cf ● ● ● ● ● ● ● ● ● ● ● ●
Fig S2. Temporal variations of A. pulchra and massive Porites sp. calcifying fluid Ω
and Ca2+cf/ Ca2+SW. The skeleton of A. pulchra was sampled to select sections grown at the start of the experiment, and after ~ 0-3, 3-6, 6-9 and 9-12 months of experiment (panels A and B), while the skeleton of massive Porites sp. was sampled to select sections corresponding to the start of the experiment, and after ~ 0-4, 4-8, 8-12 months of experiment (panels C and D). Month 0 corresponds to November 2015. Error bars show SE.
Acropora Porites a b d c 0 2 4 6 8 10 12 8.35 8.40 8.45 8.50 8.55 8.60 Months p Hcf 356 µatm 561 µatm 714 µatm 1053 µatm 0 2 4 6 8 10 12 3600 3800 4000 4200 4400 4600 4800 Months D IC cf ( µ m o l k g − 1 ) 0 2 4 6 8 10 12 9 10 11 12 Months Ωar ag cf 356 µatm 561 µatm 714 µatm 1053 µatm 0 2 4 6 8 10 12 0.50 0.55 0.60 0.65 0.70 0.75 0.80 0.85 Months C acf 2+ / C aSW 2+ 0 2 4 6 8 10 12 9 10 11 12 Months Ωar ag cf 356 µatm 561 µatm 714 µatm 1053 µatm 0 2 4 6 8 10 12 0.50 0.55 0.60 0.65 0.70 0.75 0.80 0.85 Months C acf 2+ / C aSW 2+
Fig. S3. Schematic showing the portions of the skeleton of Acropora pulchra that
were selected to represent the conditions in the calcifying fluid at the start of the experiment (section 0), and after ~ 0-3 (section 1), 3-6 (section2), 6-9 (section 3), and 9-12 (section 4) months of experiment. The green lines represent the portions of the skeleton that were selected for each growth period.
Section 4: September-November 2016 Section 3: June-August 2016 Section 2: March-May 2016 Section 1: December-February 2016 Section 0: November 2015 Calcein staining
1 cm
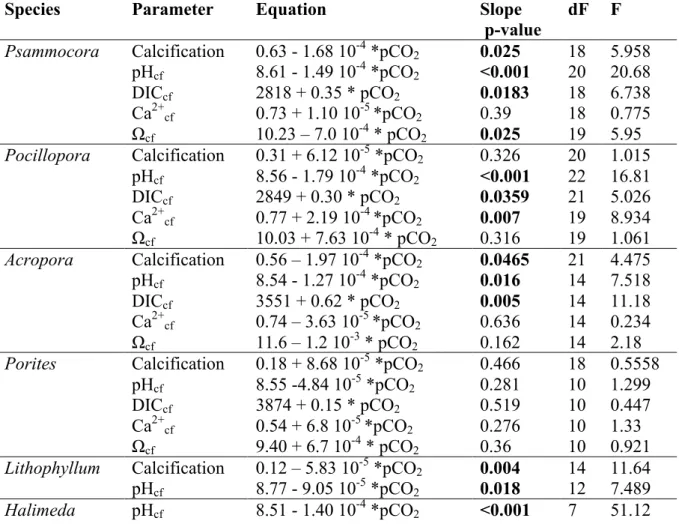
Table S1: Parameters of the linear estimates of the relationship between calcification,
pHcf, DICcf, Ca2+cf, and Ωcf, and seawater pCO2 (µatm).
Species Parameter Equation Slope
p-value
dF F
Psammocora Calcification 0.63 - 1.68 10-4 *pCO2 0.025 18 5.958
pHcf 8.61 - 1.49 10-4 *pCO2 <0.001 20 20.68 DICcf 2818 + 0.35 * pCO2 0.0183 18 6.738 Ca2+cf 0.73 + 1.10 10-5 *pCO2 0.39 18 0.775 Ωcf 10.23 – 7.0 10-4 * pCO2 0.025 19 5.95
Pocillopora Calcification 0.31 + 6.12 10-5 *pCO2 0.326 20 1.015
pHcf 8.56 - 1.79 10-4 *pCO2 <0.001 22 16.81 DICcf 2849 + 0.30 * pCO2 0.0359 21 5.026 Ca2+cf 0.77 + 2.19 10-4 *pCO2 0.007 19 8.934 Ωcf 10.03 + 7.63 10-4 * pCO2 0.316 19 1.061
Acropora Calcification 0.56 – 1.97 10-4 *pCO2 0.0465 21 4.475
pHcf 8.54 - 1.27 10-4 *pCO2 0.016 14 7.518 DICcf 3551 + 0.62 * pCO2 0.005 14 11.18 Ca2+cf 0.74 – 3.63 10-5 *pCO2 0.636 14 0.234 Ωcf 11.6 – 1.2 10-3 * pCO2 0.162 14 2.18
Porites Calcification 0.18 + 8.68 10-5 *pCO2 0.466 18 0.5558
pHcf 8.55 -4.84 10-5 *pCO2 0.281 10 1.299 DICcf 3874 + 0.15 * pCO2 0.519 10 0.447 Ca2+cf 0.54 + 6.8 10-5 *pCO2 0.276 10 1.33 Ωcf 9.40 + 6.7 10-4 * pCO2 0.36 10 0.921
Lithophyllum Calcification 0.12 – 5.83 10-5 *pCO2 0.004 14 11.64
pHcf 8.77 - 9.05 10-5 *pCO2 0.018 12 7.489
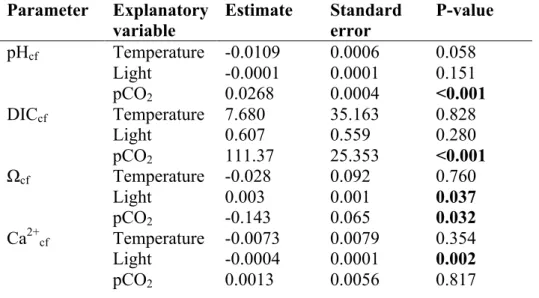
Table S2: Parameters of the multiple linear estimates of the relationship between,
pHcf, DICcf, Ca2+cf, and Ωcf, and seawater mean temperature, mean daily light, and pCO2 treatment in Acropora.
Parameter Explanatory variable Estimate Standard error P-value pHcf Temperature -0.0109 0.0006 0.058 Light -0.0001 0.0001 0.151 pCO2 0.0268 0.0004 <0.001 DICcf Temperature 7.680 35.163 0.828 Light 0.607 0.559 0.280 pCO2 111.37 25.353 <0.001 Ωcf Temperature -0.028 0.092 0.760 Light 0.003 0.001 0.037 pCO2 -0.143 0.065 0.032 Ca2+cf Temperature -0.0073 0.0079 0.354 Light -0.0004 0.0001 0.002 pCO2 0.0013 0.0056 0.817
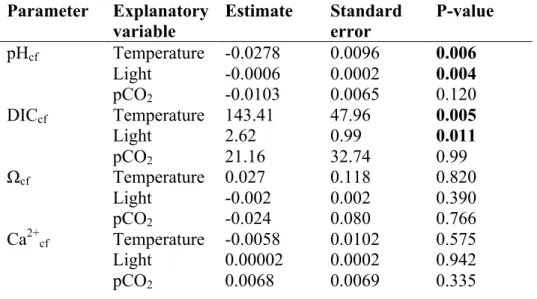
Table S3: Parameters of the multiple linear estimates of the relationship between,
pHcf, DICcf, Ca2+cf, and Ωcf, and seawater mean temperature, mean daily light, and pCO2 treatment in Porites.
Parameter Explanatory variable Estimate Standard error P-value pHcf Temperature -0.0278 0.0096 0.006 Light -0.0006 0.0002 0.004 pCO2 -0.0103 0.0065 0.120 DICcf Temperature 143.41 47.96 0.005 Light 2.62 0.99 0.011 pCO2 21.16 32.74 0.99 Ωcf Temperature 0.027 0.118 0.820 Light -0.002 0.002 0.390 pCO2 -0.024 0.080 0.766 Ca2+cf Temperature -0.0058 0.0102 0.575 Light 0.00002 0.0002 0.942 pCO2 0.0068 0.0069 0.335