HAL Id: hal-00295805
https://hal.archives-ouvertes.fr/hal-00295805
Submitted on 15 Dec 2005
HAL is a multi-disciplinary open access
archive for the deposit and dissemination of
sci-entific research documents, whether they are
pub-lished or not. The documents may come from
teaching and research institutions in France or
abroad, or from public or private research centers.
L’archive ouverte pluridisciplinaire HAL, est
destinée au dépôt et à la diffusion de documents
scientifiques de niveau recherche, publiés ou non,
émanant des établissements d’enseignement et de
recherche français ou étrangers, des laboratoires
publics ou privés.
European coastal environments
C. Peters, S. Pechtl, J. Stutz, K. Hebestreit, G. Hönninger, K. G. Heumann,
A. Schwarz, J. Winterlik, U. Platt
To cite this version:
C. Peters, S. Pechtl, J. Stutz, K. Hebestreit, G. Hönninger, et al.. Reactive and organic halogen species
in three different European coastal environments. Atmospheric Chemistry and Physics, European
Geosciences Union, 2005, 5 (12), pp.3357-3375. �hal-00295805�
www.atmos-chem-phys.org/acp/5/3357/ SRef-ID: 1680-7324/acp/2005-5-3357 European Geosciences Union
Chemistry
and Physics
Reactive and organic halogen species in three different European
coastal environments
C. Peters1, S. Pechtl1, J. Stutz3, K. Hebestreit1, G. H¨onninger1, K. G. Heumann2, A. Schwarz2, J. Winterlik2, and
U. Platt1
1Institute for Environmental Physics, University of Heidelberg, Im Neuenheimer Feld 229, 69120 Heidelberg, Germany
2Institute for Inorganic and Analytical Chemistry, University of Mainz, D¨usbergweg 10–14, 55099 Mainz, Germany
3Dept. of Atmospheric and Oceanic Sciences, UCLA, 7127 Math Sciences Los Angeles, CA 90095–1565, USA
Received: 7 June 2005 – Published in Atmos. Chem. Phys. Discuss.: 17 August 2005 Revised: 17 November 2005 – Accepted: 18 November 2005 – Published: 15 December 2005
Abstract. We present results of three field campaigns
us-ing active longpath DOAS (Differential Optical Absorp-tion Spectroscopy) for the study of reactive halogen species
(RHS) BrO, IO, OIO and I2. Two recent field campaigns
took place in Spring 2002 in Dageb¨ull at the German North Sea Coast and in Spring 2003 in Lilia at the French
At-lantic Coast of Brittany. In addition, data from a
cam-paign in Mace Head, Ireland in 1998 was partly re-evaluated. During the recent field campaigns volatile halogenated or-ganic compounds (VHOCs) were determined by a capillary gas chromatograph coupled with an electron capture detec-tor and an inductively coupled plasma mass spectrometer (GC/ECD-ICPMS) in air and water. Due to the inhomoge-neous distribution of macroalgae at the German North Sea Coast we found a clear connection between elevated lev-els of VHOCs and the appearance of macroalgae. Extraor-dinarily high concentrations of several VHOCs, especially
CH3I and CH3Br of up to 1830 pptv and 875 pptv,
respec-tively, were observed at the coast of Brittany, demonstrating
the outstanding level of bioactivity there. We found CH2I2
at levels of up to 20 pptv, and a clear anti-correlation with the appearance of IO. The IO mixing ratio reached up to 7.7±0.5 ppt (pmol/mol) during the day, in reasonable agree-ment with model studies designed to represent the meteo-rological and chemical conditions in Brittany. For the two recent campaigns the DOAS spectra were evaluated for BrO, OIO and I2, but none of these species could be clearly
iden-tified (average detection limits around 2 ppt, 3 ppt, 20 ppt, resp., significantly higher in individual cases). Only in the Mace Head spectra evidence was found for the presence of OIO. Since macroalgae under oxidative stress are suggested
to be a further source for I2 in the marine boundary layer,
we re-analyzed spectra in the 500–600 nm range taken dur-ing the 1998 PARFORCE campaign in Mace Head, Ireland,
Correspondence to: C. Peters
which had not previously been analyzed for I2. We identified
molecular iodine above the detection limit (∼20 ppt), with
peak mixing ratios of 61±12 ppt. Since I2was undetectable
during the Brittany campaign, we suggest that iodine may not be released into the atmosphere by macroalgae in general, but only by a special type of the laminaria species under oxida-tive stress. Only during periods of extraordinarily low water (spring-tide), the plant is exposed to ambient air and may re-lease gaseous iodine in some way to the atmosphere. The results of our re-analysis of spectra from the PARFORCE campaign in 1998 support this theory. Hence, we feel that
we can provide an explanation for the different I2levels in
Brittany and Mace Head.
1 Introduction
It is well established that RHS significantly influence a va-riety of atmospheric processes. This is impressively demon-strated during polar spring, when boundary layer ozone is de-pleted within days or even hours by catalytic cycles involving bromine, the so-called “bromine explosion” events (e.g. Platt and Lehrer, 1996). The presence of halogen oxides outside polar regions could influence the ozone budget as well as the oxidation capacity of the troposphere by catalytic destruction
via X+O3 and by affecting the NO/NO2 and OH/HO2
par-titioning (e.g. Platt and H¨onninger, 2003). On local scales the presence of BrO in mid-latitudinal regions has been ob-served thus far in a variety of different environments, e.g. salt lakes (Hebestreit et al., 1999; Stutz et al., 2002; H¨onninger et al., 2004b; Zingler and Platt, 2005) and volcanic plumes (Bobrowski et al., 2003) as well as in the marine boundary layer (Leser et al., 2003; Saiz-Lopez et al., 2004a). Sig-nificant appearance of reactive iodine species (IO, OIO, I2)
has thus far been reported primarily from coastal sites. An overview of the hitherto detected mixing ratios of RHS in the lower troposphere is given in Table 1. IO could contribute to
Table 1. Observation of RHS in the troposphere by the active and passive DOAS technique.
Spec. Location, year Max. Conc. [ppt] Error ±(2σ ) [ppt] Reference
IO Mace Head, Ireland (1997) 6.7 0.5 Alicke et al. (1999)
IO Mace Head (1998) 7.2 0.3 Hebestreit (2001)
IO Mace Head (2002) 7 0.5 Saiz-Lopez and Plane (2004)
IO Tasmania (1999) 2.2 0.4 Allan et al. (2000)
IO Tenerife, Can. Islands (1997) 3.5 0.4 Allan et al. (2000)
IO Kerguelen, Ind. Ocean (2002) ≤D.L. (1.4) 1.4 Sebasti´an (2004)
IO North Sea, Germany (2002) 2.1 0.5 this work
IO Atlantic Coast, France (2003) 7.7 0.5 this work
IO Crete, Greece (2003) ≤D.L. (0.8) 0.8 H¨onninger (2002)
IO Dead Sea, Israel (2000) 10 2.4 Zingler and Platt (2005)
IO Antarctic and Arctic 10 – Frieß et al. (2001), Wittrock et al. (2000)
IO Alert, Arctic (2000) 0.73 0.23 H¨onninger (2002)
OIO Cape Grim, Tasmania (1999) 3.0a 0.5 Allan et al. (2001)
OIO Mace Head, Ireland (1998) 9.2b 3.3 this work
OIO Mace Head, Ireland (2002) 3.0a 0.5 Saiz-Lopez and Plane (2004)
I2 Mace Head, Ireland (2002) 93 3 Saiz-Lopez and Plane (2004)
I2 Mace Head, Ireland (1998) 61.3 12 this work
I2 Atlantic Coast, France (2003) ≤D.L. (10.15) 10.15 this work
BrO Mid.Lat. MBL 6.0 – Leser et al. (2003), Saiz-Lopez et al. (2004a)
BrO Salt lakes (Dead Sea, ≤176 – Hebestreit et al. (1999), Matveev et al. (2001),
Salt Lake City, Caspian Sea, Wagner et al. (2001), Stutz et al. (2002),
Salar de Uyuni) H¨onninger et al. (2004a)
BrO Antarctic, Arctic 30 – Hausmann and Platt (1994), Tuckermann et al. (1997),
Hegels et al. (1998), Martinez et al. (1999), H¨onninger et al. (2004b), Frieß (2001)
BrO Volcanoes ∼1000 – Bobrowski et al. (2003)
aσ
OIO(548.6 nm)=6.8×10⁻¹⁷cm2(Cox et al., 1999) bσ
OIO(548.6 nm)=1.1×10⁻¹⁷cm2(Bloss et al., 2001)
63Ni source ECD-vent GC oven Carrier gas ECD ECD Gas outlet during plasma ignition Steel capillaries Carrier gas He to electrical transformer Capillary Make-up gas N2 Torch ICPMS ICPMS Plasma Auxiliarygas Plasma gas Spherical ground joint 2 cm Thermodesorption system Thermodesorption system AIR Adsorption Offline
Offline PreconcentrationPreconcentration
SEAWATER
Purge & Trap on Adsorbens
AIR
Adsorption
Offline
Offline PreconcentrationPreconcentration
SEAWATER
Purge & Trap on Adsorbens
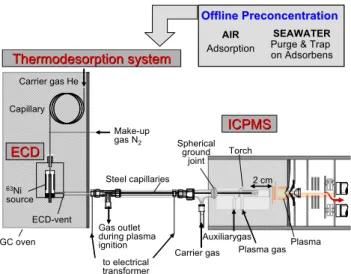
Fig. 1. Schematic overview of the GC/ECD-ICPMS, which is a highly sensitive detection method for halogenated hydrocarbons.
ozone destruction in a manner comparable to BrO, even in low mixing ratios. Additionally, recent field and laboratory studies indicate that reactive iodine plays an important role in new particle formation processes (Hoffmann et al., 2001; O’Dowd et al., 2002; Jimenez et al., 2003; Burkholder et al., 2004). Instances of particle formation, with concentrations of up to 106particles/cm3, have been observed in marine en-vironments (e.g. O’Dowd et al., 1998; M¨akel¨a et al., 2002). As particles in the marine atmosphere affect the microphysi-cal properties of stratocumulus clouds, they potentially have an impact on climate. Therefore the investigation of sources, appearance, and distribution of reactive iodine species on a global scale is of high interest in present research activities.
The current understanding of the particle formation pro-cess is quite limited. O’Dowd et al. (2002) proposed that particle formation in coastal environments is dominated by polymerization of the OIO radical. However, field observa-tions of OIO in the marine environment are rare (Allan et al., 2000), even though great effort was made for its detection. These measurements, as well as observations presented in
5002 m 9472 m 9173 m 5673 m Mace Head Dagebüll Lilia 2630 m 7270 m Bertraghboy Bay Ard Bay
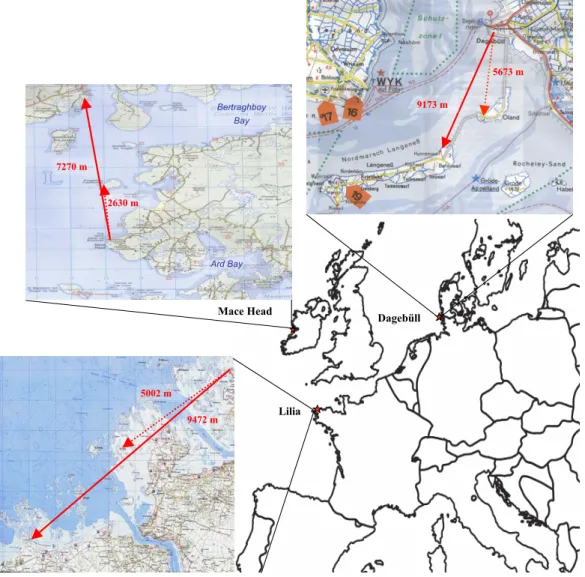
Fig. 2. The three campaign sites Mace Head, Lilia and Dageb¨ull. The lightpaths are indicated by red arrows. The shorter lightpath (dotted line) was used if the atmospheric conditions didn’t allow measurements on the longer one. The shaded areas always indicate the intertidal zones, where the water was removed during low tide. In Dageb¨ull, as well as, in Lilia the lightpath crossed primarily through the intertidal zone, whereas in Mace Head the lightbeam mainly passed over sea. In the latter location the tidally influenced area with fields of algae is located in easterly direction, e.g. Ard Bay and Bertraghboy Bay.
this paper, seem to indicate that OIO is present in coastal regions, but in average mixing ratios clearly below 10 ppt. These mixing ratios are insufficient to explain particle for-mation processes, according to Burkholder et al. (2004), and they therefore suggested an inhomogeneous source distribu-tion in so-called “hot spots” to explain this apparent discrep-ancy. However, inhomogeneous distribution of RHS along the lightpath cannot be resolved by longpath DOAS measure-ments.
The most likely source of reactive iodine is the emission of organohalogens by macroalgae, which would fit well into the picture of inhomogeneous release due to the patchy dis-tribution of algae in coastal regions. Diiodomethane is bio-genically emitted by a variety of macroalgae, as reported by
Schall and Heumann (1993); Carpenter et al. (1999). Due to the short photolytic lifetime of CH2I2, iodine atoms are
released within minutes into the atmosphere, where they quickly react with ozone to form IO.
The detection of molecular iodine at Mace Head was re-cently reported by Saiz-Lopez and Plane (2004), who found
highly elevated levels of I2closely correlated to minima in
tidal height, again indicating macroalgae to be the source.
However, it is unclear if the appearance of I2 is a common
phenomenon in the marine boundary layer, since the results have not been confirmed at other coastal sites thus far.
In this study we present field data from three different mar-itime locations. The first part of this work, the experimental section, addresses the DOAS technique, and the method for
the determination of the VHOCs with the GC/ECD-ICPMS is briefly explained. In the following section a detailed de-scription of the three different measurement locations (Ger-man North Sea Coast, the French Atlantic Coast and Mace Head, Ireland) is given, followed by a description of the DOAS data analysis for the evaluated species BrO, IO, OIO
and I2. In the last section we discuss a comparison of the
results with model studies.
2 Experimental setup
2.1 The DOAS system
The well established method of DOAS (Platt and Perner, 1983; Platt, 1994) identifies and quantifies trace gases by their individual narrow band absorption structures. We used this technique to perform measurements of the RHS IO,
BrO, OIO, I2 and further species such as NO2, O3, H2O,
O4and HCHO, with an active longpath DOAS instrument.
For the campaigns in 2002 and 2003 the telescope was op-erated with an artificial light source (active), a high pres-sure Xe-arc lamp of the type PLI HSA-X5002 (Professional Lamp Inc., USA). The lightbeam was sent through the atmo-sphere, reflected by an array consisting of 180 quartz prism retro-reflectors at a distance of 9472 m (Brittany, 2003) and 9173 m (North Sea, 2002), resulting in a total absorption path length of twice the distance to the reflectors (i.e., 18.9 km and 18.3 km, respectively). The returning light was analyzed by an Acton 500pro spectrometer (f=6.9, 600 gr/mm
grat-ing, thermostated to 25±0.5◦C) equipped with a 1024 pixel
photodiode array detector (type Hamamatsu S3904-1024), resulting in a spectral resolution of about 0.5 nm FWHM. Three different wavelength ranges were routinely covered to measure the species of interest: BrO in 335±40 nm, IO in
420±40 nm, OIO as well as I2in 550±40 nm. Within these
spectral ranges related absorbers such as NO2, O3, HCHO,
H2O and O4were accounted for as well. The mixing ratios
of the respective absorbers were derived by a non-linear least squares fit (Stutz and Platt, 1996), by simultaneously adjust-ing all relevant absorbers, together with a polynomial and a spectrum for the correction of lamp features to the atmo-spheric spectrum. An experimental setup with similar char-acteristics and the same measurements strategy was used at the earlier study at Mace Head (Hebestreit, 2001; H¨onninger, 1999). The total light path length in this case was 14.4 km.
2.2 The GC/ECD-ICPMS
The measurements of VHOCs for the two recent campaigns were performed by an GC/ECD-ICPMS. Since the detection system is not mobile, air and water samples were taken at the campaign site and analyzed later in the laboratory in Mainz. The air sampling was carried out by adsorption on carbosieve SIII or carboxen in the field, and subsequent thermal desorp-tion of the analytes into a cold trap in the laboratory.
Af-ter the cryo-focusing procedure, the VHOCs were separated in a capillary column and determined by an electron cap-ture detector (ECD) coupled on-line to an inductively cou-pled plasma mass spectrometer (ICPMS). For the analysis of chlorinated and brominated compounds ECD is a highly sen-sitive method, but for iodinated compounds the ICPMS has the advantage of element specific detection, which is espe-cially important for the identification of unknown and coelu-ating chromatographic peaks. A schematic overview of the GC/ECD-ICPMS system is given in Fig. 1. For details the reader is referred to Schwarz and Heumann (2002).
3 Measurement sites
We present data from three measurement sites. The recent field campaigns at the North Sea in 2002 and in Brittany in 2003 were conducted within the framework of the ReHaT-rop project, which is part of the German AFO2000 (Atmo-spheric Research Program) program. During these two field campaigns VHOCs were measured by the group of Heumann et al., Uni Mainz, and RHS by the group of Platt et al., Univ. Heidelberg. Additionally, data from the 1998 PAR-FORCE campaign at Mace Head, Ireland was re-analyzed, representing a further coastal environment. An overview on these three measurement sites is given in Fig. 2.
3.1 Dageb¨ull, German North Sea Coast
Between 18 April and 17 May 2002, we conducted an in-tensive field campaign in Dageb¨ull (54.73◦N, 8.69◦E) at the German North Sea Coast. Tidal effects and the flat coastal area cause the unique character of the nature reserve Wadden Sea. In times of low tide extended areas along the coast-line are exposed to the atmosphere. We observed a maximal tidal range of 3.8 m during the campaign, sufficient to remove the water below the absorption path of the DOAS instru-ment completely (see Fig. 2). The weather conditions were, in general, stormy and rainy, with just a few sunny periods. These conditions strongly disturbed continuous DOAS mea-surements. Since spring started late in that year, macroalgae appeared isolated and rarely within the intertidal zone. The
atmosphere was moderately polluted, with 0.5–8 ppb NO2
throughout the campaign.
The DOAS instrument was positioned on the top of a dyke at few meters distance to the waterfront in times of high tide. Two different lightpaths were set up and used alternatively, according to the atmospheric visibility. In Fig. 2 both light-paths are shown for each measurement site with red arrows. The primary lightpath (solid line) crossed the intertidal zone at just 3–7 m height to the small island Langeneß at 9172 m distance (total length 18.34 km).
To determine the impact of the appearance of macroalgae on VHOCs, air samples for the GC/ECD-ICPMS analysis were taken at various locations. We sampled air primarily
Table 2. Differential absorption cross sections used for the data analysis in this work.
Species Reference
HCHO (298 K) Meller and Moortgat (2000) O4(287 K) Greenblatt et al. (1990)
O3(293 k) Voigt et al. (2001) NO2(293 K) Voigt et al. (2002)
H2O (298 K) Coheur et al. (2002) BrO (298 K) Wilmouth et al. (1999) IO (295 K) H¨onninger (1999) OIO (295 K) Bloss et al. (2001) I2(295 K) Saiz-Lopez et al. (2004b)
at a small water pool at 500 m distance to the DOAS instru-ment. This pool was only flooded during very high tide, al-lowing that some green algae (Ulva Lactuca, Enteromorpha
compressa) could grow in this protected area. Air samples
were also taken close to the DOAS instrument, within the in-tertidal zone above sandy ground, but with no macroalgae in the vicinity.
3.2 Lilia, French Atlantic Coast, Brittany
The intensive field campaign in 2003 was carried out from
6 May to 13 June in Lilia (48.62◦N, 4.55◦W), a small
vil-lage at the French Atlantic Coast of Brittany, 50 km north of Brest. In contrast to Dageb¨ull, the site was characterized by extraordinarily high biological activity. Extended fields of macroalgae were present all along the coast, with a vari-ety of different algae species ranging from green, to brown to red algae e.g. Laminaris, Fucus Vesicolosus, Ascophyllum
Nodosum. The measurement site is situated in the north-west
of Brittany, directly at the Atlantic Coast. Although clean air was typically transported by westerly flows from the open Atlantic to the site, some pollution by NOxspecies has to be
accounted for (NO2of up to 7.5 ppb). The campaign took
place in late spring close to the summer solstice, with an av-erage of 15.5 sunlight hours, defined as solar zenith angle SZA<90◦.
As in the previous campaign in 2002 at the North Sea, the DOAS telescope was set up at a few meters distance to the waterfront in times of high tide. The lightpath of 9472 m length (total absorption length 18.94 km), indicated by a solid line in Fig. 2 was primarily used. Only during periods with low atmospheric visibility was the lightpath, in-dicated in Fig. 2 by a dotted line, used.
The tide in Brittany is quite pronounced, with a maximum in tidal range of 7.5 m during the campaign. The lightpath crossed the intertidal zone at 10–14 m height above average sea level. In times of low tide the water was removed to more than 60% below the lightpath.
0.0 1.0x10⁻³ 2.0x10⁻³ 3.0x10⁻³ IO [ O D] 0.0 5.0x10⁻³ 1.0x10⁻² 1.5x10⁻² A tm osp he ric Spec trum 8.0x10⁻³ 1.0x10⁻² 1.2x10⁻² 1.4x10⁻² 1.6x10⁻² 1.8x10⁻² NO 2 [OD ] 417 420 423 426 429 432 435 438 441 -6.0x10⁻⁴ -3.0x10⁻⁴ 0.0 3.0x10⁻⁴ 6.0x10⁻⁴ Res idu al [ O D] wavelength [nm]
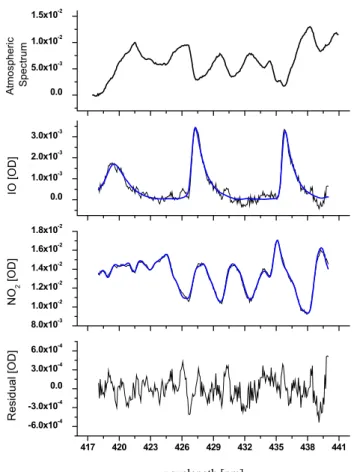
Fig. 3. Sample evaluation of IO. In the upper panel the atmospheric spectrum taken in Brittany on 5 June 2003 at 16:00 GMT is shown, after a highpass filter was applied to remove broad banded spectral features. In the second and third panel the absorption structures assigned to IO, NO2are shown. IO is clearly identified, and the
mixing ratio corresponds to 2.99±0.2 ppt, assuming a lightpath of nearly 19 km. The residual has a peak to peak noise of 1.06×10⁻³ and does not show any regular structures.
During the 2002 North Sea campaign the RHS and VHOC measurements were not co-located to demonstrate the impact of macroalgae on the appearance of VHOCs but during the 2003 Brittany campaign, the VHOCs were measured by al-ways sampling next to the DOAS instrument.
3.3 Mace Head 1998
In September/October of 1998 the group of Platt et al. con-ducted active longpath DOAS measurements during the field
campaign in Mace Head, Ireland (53.33◦N, 9.90◦W) in the
framework of the PARFORCE project. Spectra were taken for the detection of BrO, IO and OIO. The results have al-ready been published for BrO (Sander et al., 2003) as well as for IO (Carpenter et al., 2001).
As I2 was not accounted for in the original analysis, all
spectra in the 500–600 nm range were re-analyzed and the results are discussed in this work. Due to the availability
320 325 330 335 340 345 350 355 -1.0x10⁻³ 0.0 1.0x10⁻³ -1.0x10⁻³ 0.0 1.0x10⁻³ -2.0x10⁻³ 0.0 2.0x10⁻³ 4.0x10⁻³ 0.0 2.0x10⁻² 4.0x10⁻² 3.0x10⁻³ 5.0x10⁻³ 7.0x10⁻³ wavelength [nm] NO 2 [OD] O3 [OD ] O4 [OD] Br O [OD ] R es idual [O D ]
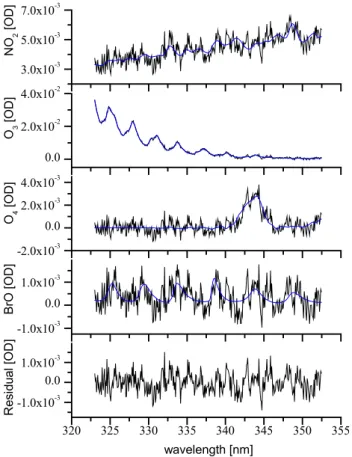
Fig. 4. Sample evaluation of the BrO fit. The absorption structures of BrO are not clearly identified above the residual, even if there is some evidence for it in this example. The corresponding BrO mixing ratio for the lightpath of 18.94 km is 1.45±0.88 ppt.
of better absorption cross section in recent years OIO was also re-analyzed in this wavelength range. Due to a variety of intensive field studies at Mace Head within recent years, a detailed description of the measurement site can be found elsewhere (e.g. Carpenter et al., 2001). The site is, in some ways, very similar to that of Brittany. The coastline is signif-icantly influenced by tidal effects, and the combination of a rocky coast and cold water results in a strong appearance of macroalgae.
The DOAS telescope was installed close to the waterfront. The lightpath was 7.27 km (total length 14.4 km) long, point-ing to the opposite side of the bay where a reflector was posi-tioned. The lightbeam mainly crossed ocean water, with only small areas close to the coast that were affected by the tides. However, east of the lightpath, extended fields of macroalgae are exposed to the atmosphere during times of low tide (Ard Bay and Bertraghboy Bay, see Fig. 2).
4 DOAS data analysis
The software WinDOAS (Fayt and van Rozendael, 2001) was used to perform a non-linear least squares fit, by
simulta-0.0304 0.0308 0.0312 0.0316 530 535 540 545 550 555 560 565 570 -3.0x10⁻³ 0.0 3.0x10⁻³ 6.0x10⁻³ -3.0x10⁻³ 0.0 3.0x10⁻³ -3.0x10⁻³ 0.0 3.0x10⁻³ -8.0x10⁻³ 0.0 8.0x10⁻³ -3.0x10⁻³ 0.0 3.0x10⁻³ wavelength [nm] Atmos pher ic S pec tr um R es idual [OD ] OIO [OD ] I2 [OD ] H2 O [O D ] NO 2 [OD ] Atm. spectrum Lamp reference
Fig. 5. Example for the spectral identification of I2. The spectrum was taken on 5 October 1998 22:07 GMT during the PARFORCE campaign in Mace Head. The corresponding mixing ratio of I2is 61.29±9.36 ppt, and for OIO 5.70±3.19 ppt.
neously adjusting the relevant atmospheric absorbers in the respective wavelength range to the atmospheric spectra. To remove spectral features caused by the DOAS lightsource, a daily recorded lamp reference spectrum, in addition to a polynomial of the 5th order, was included in the fit as well. The detection limit is estimated by multiplying a factor 2 to the statistical error (1σ ) resulting from the non linear fit pro-cedure. However, this estimation of the detection limit is only valid for a mostly unstructured residual. For individual cases, if significant residual structures remain, the statistical error has to be multiplied by a factor of up to 3 according to studies by Stutz (1996). Hence, the individual error and therefore the detection limit can be significantly higher than the 2σ range for individual cases.
We analyzed IO between 418 and 440 nm, where three of the strongest absorption bands (3-0, 4-0, 5-0) of the
electronic transition A253/2←X253/2 are found. The
strong 2-0 band was excluded to avoid conflicts with water absorption and broadened lamp structures in the
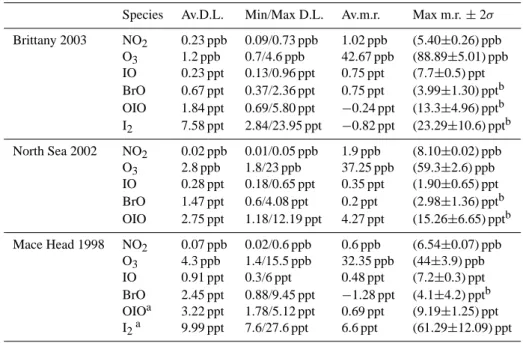
Table 3. Overview of mixing ratios and detection limits at the three described measurement sites. Results of NO2, O3, IO and BrO for Mace
Head are adapted from the original analysis by Hebestreit (2001); H¨onninger (1999). The average, minimum, and maximum value of the statistical (2σ ) detection limit (D.L.) and the mixing ratio (m.r.) for each species is given.
Species Av.D.L. Min/Max D.L. Av.m.r. Max m.r. ± 2σ
Brittany 2003 NO2 0.23 ppb 0.09/0.73 ppb 1.02 ppb (5.40±0.26) ppb O3 1.2 ppb 0.7/4.6 ppb 42.67 ppb (88.89±5.01) ppb IO 0.23 ppt 0.13/0.96 ppt 0.75 ppt (7.7±0.5) ppt BrO 0.67 ppt 0.37/2.36 ppt 0.75 ppt (3.99±1.30) pptb OIO 1.84 ppt 0.69/5.80 ppt −0.24 ppt (13.3±4.96) pptb I2 7.58 ppt 2.84/23.95 ppt −0.82 ppt (23.29±10.6) pptb North Sea 2002 NO2 0.02 ppb 0.01/0.05 ppb 1.9 ppb (8.10±0.02) ppb O3 2.8 ppb 1.8/23 ppb 37.25 ppb (59.3±2.6) ppb IO 0.28 ppt 0.18/0.65 ppt 0.35 ppt (1.90±0.65) ppt BrO 1.47 ppt 0.6/4.08 ppt 0.2 ppt (2.98±1.36) pptb OIO 2.75 ppt 1.18/12.19 ppt 4.27 ppt (15.26±6.65) pptb Mace Head 1998 NO2 0.07 ppb 0.02/0.6 ppb 0.6 ppb (6.54±0.07) ppb O3 4.3 ppb 1.4/15.5 ppb 32.35 ppb (44±3.9) ppb IO 0.91 ppt 0.3/6 ppt 0.48 ppt (7.2±0.3) ppt BrO 2.45 ppt 0.88/9.45 ppt −1.28 ppt (4.1±4.2) pptb OIOa 3.22 ppt 1.78/5.12 ppt 0.69 ppt (9.19±1.25) ppt I2a 9.99 ppt 7.6/27.6 ppt 6.6 ppt (61.29±12.09) ppt
aRe-analysis Mace Head 1998 data bNo identification in the spectrum
range of 440–450 nm. The cross section of H¨onninger
(1999), recorded with a resolution of 0.09 nm, and
σdiff(427.2 nm)=2.6×10⁻¹⁷cm2 (4-0 transition band) was
used. In addition, an absorption cross section of NO2(see
Table 2) was included in the analysis.
Throughout both recent campaigns the detection limit for IO was on average below 0.5 ppt. In Fig. 3 a sample evalu-ation of 5 June 2003 in the afternoon gives an overview of the spectral identification of IO. The presented spectrum cor-responds to a mixing ratio of 2.99±0.2 ppt, which demon-strates the clear identification of three IO absorption bands already at moderate levels.
Due to the long exposure times necessary in the near UV range (295–375 nm) on absorption paths of nearly 20 km, measurements in this wavelength range were restricted to times with very clear atmospheric conditions. Under clear conditions the acquisition of one spectrum took an average of 5–15 min. The evaluation range was set to 323–352.5 nm, including 6 vibrational transitions of the A253/2←X253/2
of BrO transitions to provide an unambiguous spectral iden-tification. Besides the lamp spectrum, a 5th order polynomial and literature absorption cross sections of O4, O3, NO2and
HCHO (see references in Table 2) were applied. A sample evaluation is given in Fig. 4. The optical density of the BrO absorption is in a similar range as that of the residual. Hence an unambiguous detection of BrO was not possible.
We evaluated I2and OIO in the range of 530–568 nm to
provide good spectral identification but to avoid greater
con-flicts with highly varying structures caused by the operated light source. We applied the O4, NO2, H2O, OIO and I2cross
sections (references in Table 2) to the fit scenario, besides a 5th order polynomial according to the extended evaluation range. A sample evaluation of 5 October 1998, 22:07 GMT
is shown in Fig. 5. Sixteen absorption bands of I2could be
clearly identified.
Water absorption structures are present over major parts of that wavelength range. Due to the incompleteness of avail-able water vapor line databases, the removal of water vapor absorptions in the spectra is partly insufficient and causes high residual structures. In addition, varying structures of the light source have to be accounted for. These structures vary strongly in time, and the remaining structures in the residual are not stable or interpretable in a simple way as an instru-mental effect.
5 Results and discussion
In the following section, the results for determined VHOCs,
IO, BrO, OIO, and I2 are presented and discussed for the
campaigns described above. Additionally, we compare the results of the 2003 Brittany campaign to model calcula-tions with the marine boundary layer model MISTRA in or-der to check for consistency of our observations with the present understanding of atmospheric chemistry. A complete overview on the results and the respective detection limits of
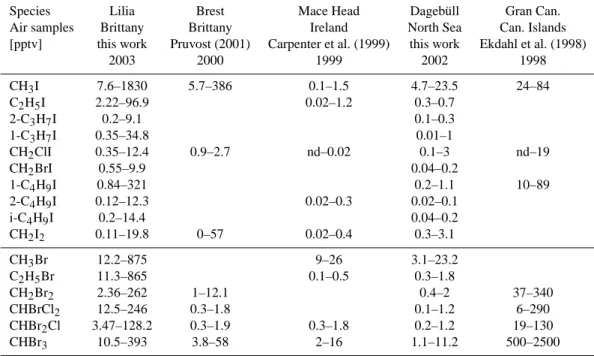
Table 4. The concentration range of all continuously detected iodinated and brominated hydrocarbons is given. If comparable data was available, the range of published data is given. “nd” means below the detection limit.
Species Lilia Brest Mace Head Dageb¨ull Gran Can.
Air samples Brittany Brittany Ireland North Sea Can. Islands
[pptv] this work Pruvost (2001) Carpenter et al. (1999) this work Ekdahl et al. (1998)
2003 2000 1999 2002 1998 CH3I 7.6–1830 5.7–386 0.1–1.5 4.7–23.5 24–84 C2H5I 2.22–96.9 0.02–1.2 0.3–0.7 2-C3H7I 0.2–9.1 0.1–0.3 1-C3H7I 0.35–34.8 0.01–1 CH2ClI 0.35–12.4 0.9–2.7 nd–0.02 0.1–3 nd–19 CH2BrI 0.55–9.9 0.04–0.2 1-C4H9I 0.84–321 0.2–1.1 10–89 2-C4H9I 0.12–12.3 0.02–0.3 0.02–0.1 i-C4H9I 0.2–14.4 0.04–0.2 CH2I2 0.11–19.8 0–57 0.02–0.4 0.3–3.1 CH3Br 12.2–875 9–26 3.1–23.2 C2H5Br 11.3–865 0.1–0.5 0.3–1.8 CH2Br2 2.36–262 1–12.1 0.4–2 37–340 CHBrCl2 12.5–246 0.3–1.8 0.1–1.2 6–290 CHBr2Cl 3.47–128.2 0.3–1.9 0.3–1.8 0.2–1.2 19–130 CHBr3 10.5–393 3.8–58 2–16 1.1–11.2 500–2500 0.01 0.1 1 10 100 1000 Concent rat ion [pptv] Brittany North Sea Ireland 1-C3H7I CH2ClI CH2BrI1-C4H9I2-C4H9I CH2I2 2-C3H7I C2H5I CH3I
Fig. 6. Diagram for different iodinated VHOCs at three different coastal sites. For each location the average and maximum detected mixing ratios is indicated. The bars are missing if no data was avail-able or the mixing ratios were to close to zero. Note the logarithmic scale.
the RHS measurements by longpath DOAS is given in Ta-ble 3, and the respective overview of results of the VHOC measurements in air is shown in Table 4.
5.1 VHOC in-situ measurements
Ten iodinated and six brominated volatile hydrocarbons in air were identified at both 2002 North Sea and 2003 Brit-tany campaign sites. The detected mixing ratios ranges for these species are summarized in Table 4. Data from two other coastal regions (i.e. Brest and Gran Canaria) are added whenever reported measurements were available.
The detected species show significantly elevated levels for the measurement site in Lilia (Brittany) which can be seen in Fig. 6, where the average and maximum detected concen-tration of iodocarbons at the three measurement sites (North Sea, Brittany and Mace Head) are compared.
In several cases (e.g. CH3I, CH3Br), the observed levels
exceed that of other coastal regions by up to two orders of magnitude, demonstrating the outstanding biological activ-ity of Brittany. The mixing ratio ranges, especially for the brominated species measured during the Dageb¨ull campaign, are in good agreement with observations at Mace Head, Ire-land (see Table 4).
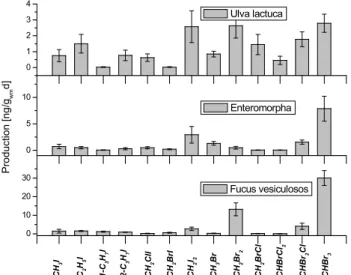
In incubation experiments performed with several
macroalgae during the 2002 North Sea campaign, charac-teristic production patterns for different algae species were found, which are in agreement with former investigations of polar macroalgae (Schall et al., 1994). However, the general production pattern seems to be unique for different algae species. It should be noted that the absolute production rate differed significantly between single incubation experiments, which may be explained by the impact of stress factors, as well as the biological state and age of the plant. In Fig. 7 the emission fingerprints of three different algae species, populating the German North Sea coast are shown.
These emission fingerprints show good agreement with VHOC measurements taken at different locations which were dominated by the respective type of macroalgae, as can be seen in Fig. 8.
0 10 20 30 CH 2 BrCl CHBr 2 Cl CH 3 Br CH 2 Br2 Fucus vesiculosos 1-C 3 H7 I CHBrCl 2 CH 2 BrI CHBr 3 CH 2 I2 CH 2 ClI 2-C 3 H7 I C2 H5 I CH 3 I 0 5 10 Product ion [ ng/ gwm d] Enteromorpha 0 1 2 3 4 Ulva lactuca
Fig. 7. Fingerprints of VHOC emissions of three different algae found at the German North Sea Coast. The data is averaged over several incubation experiments during 2001 and 2002 at the German North Sea Coast.
The sampling location without macroalgae was situated close to the DOAS telescope in the nearby intertidal zone, while the location with green algae was an enclosed water pool at a distance of 500 m. Air samples were also taken 3.5 km away from the DOAS instrument at Sch¨uttsiel, where a small population of the brown algae Fucus Vesiculosus in-habited parts of the coast line. The comparison to the finger-prints resulting from incubation experiments shows the clear influence of macroalgae on the detected levels of VHOCs, and indicates that the production pattern is characteristic for the individual algae species in their respective natural habitat. During the North Sea campaign a phytoplankton bloom
was detected, and the emission rates of the VHOCs CH3I
and C2H5I increased in a correlated manner. In Fig. 8, CH3I
and CH3Br show comparable concentrations at all of the
lo-cations, which can be easily understood by the long pho-tolytic lifetimes of both species. The existence of open ocean sources and the impact of microplankton on appearance of VHOCs were already indicated by estimations of Carpenter (2003), who found that seaweed production calculated from measured emission rates, in conjunction with biomass esti-mates, could not support the levels of CH3I and CH2ICl
mea-sured in surface coastal waters off the coast of Mace Head. That lead to her suggestion of additional marine sources for these compounds. The influence of tidal effects on the ap-pearance of VHOCs was analyzed in detail during the Brit-tany campaign in 2003. For most VHOCs, a strong increase during low tide periods was observed. This is demonstrated in Fig. 9 for the short-lived iodocarbons CH2I2and CH2IBr.
As could be expected from the short photolytic lifetime, the concentrations of these species are significantly lower during the day. A clear anticorrelation to tidal height could be ob-served for the nighttime data. However, as shown in Fig. 9,
5 10 15 20 25 30 35 CH 2 Br2 2-C 3 H7 I CHBr 3 CHBr 2 Cl2 CHBr 2 Cl CH 2 BrC l CH 3 Br CH 2 I2 CH 2 BrI CH 2 ClI 1-C 3 H7 I C2 H5 I [p pt v] no macroalgae green algae brown algae CH 3 I
Locations with appearance of
Fig. 8. Average concentrations of VHOCs in air samples taken at different locations during the North Sea campaign (Dageb¨ull) in Spring 2002. The shading of the bars indicates the type of algae found at the sampling site. Except for CH3I and CH3Br the
con-centrations are significantly lower if no macroalgae are present in the vicinity at the sampling site.
two measurements of CH2I2exceed 10 pptv during high tide,
in both cases very shortly after sunset, which we cannot ex-plain conclusively.
5.2 Results of IO analysis
During the North Sea campaign in Spring 2002, the IO rad-ical was the only identified halogen oxide. We detected a maximum of 1.9±0.65 ppt. Due to the problematic weather conditions we did not record a continuous time series, thus we did not observe daily cycles, as in Brittany or in Mace
Head. Correlations of halogen activation to the source
species (CH2I2) could not be observed either. During the
2003 Brittany campaign we detected a maximum mixing ra-tio of IO at about 7.7±0.5 ppt, which is comparable to max-ima we found in Mace Head during the 1998 PARFORCE campaign. In Fig. 10 the time series of all relevant species taken during the 2003 Brittany campaign is given. We ob-served a strong diurnal cycle for IO on every day, closely cor-related to low tide, as can be seen in Fig. 11. Small amounts of the IO radical of up to 1.0 ppt were found during daytime high tides, but since the water level in Brittany is very vari-able and the coastline very craggy, a complete coverage of the algae was never assured. Hence, a possible open ocean source for reactive iodine cannot necessarily be inferred from our results. However, the data set demonstrates clearly that macroalgae, exposed to air are the main contributors for reac-tive iodine in the lower atmosphere. The time series recorded between 24–28 May is shown in Fig. 12 (upper panel). High tide occurred around noon. The IO peaked two times a day and showed a minimum at midday. The peaks coincided with low tide, when the area of exposed algae was enhanced and the production of most VHOCs was significantly ele-vated (compare Fig. 9). From 2–5 June, low tide occurred
3.0 3.5 4.0 4.5 5.0 5.5 6.0 6.5 7.0 0 5 10 15 0 5 10 15
lin. fit all CH2I2, Y = 3.33-0.400.12*TH, R2 = 0.10
lin. fit all CH2BrI, Y = 2.22+0.12*TH, R2 = 0.04 Average (CH2I2) 1.57 pptv Average (CH2IBr) 2.78 pptv Concent rat ion [pptv] Tidal height (TH) [m] Daylight conditions (SZA<90°)
lin. fit except two outliers CH2I2, Y = 10.50-1.82*TH, R2 = -0.47
lin. fit all CH2BrI, Y = 13.89-2.22*TH, R = -0.89
Concent
rat
ion [pptv]
CH2I2 CH2IBr Nighttime data (SZA>90°)
2
Fig. 9. Concentration of the short lived iodocarbons CH2IBr and CH2I2in the absence (upper panel) and in the presence (lower panel) of sunlight during 2003 Brittany campaign. At night the observed concentration of the iodocarbons significantly decreases with increasing water level. The error bars are estimated to be in the order of 10%, see Schwarz and Heumann (2002). The outliers in the upper panel exceed 10 pptv during high tide, both cases shortly after sunset, may indicate a late accumulation of the short lived CH2I2.
at midday, and we observed a nicely pronounced IO daytime cycle on four consecutive days, with peak IO mixing ratios apparently more elevated than during the May period (see different y-axis scale in Fig. 12) This finding is in qualita-tive good agreement with respecqualita-tive model calculations (see Sect. 5.5.2).
5.3 Results of BrO analysis
The unambiguous identification of BrO absorption structures in the spectra was not possible in any of the three described campaigns. The average statistical detection limit for BrO from the North Sea data set was 1.47 ppt, slightly above the estimated limit resulting from the 2003 Brittany cam-paign with 1.35 ppt. For the Mace Head camcam-paign in 1998, H¨onninger (1999) gives a mean detection limit of 2.45 ppt. Detection limits and maximal values for BrO are listed in Ta-ble 3. These results confirm upper limits for BrO in the MBL of 1.5–2 ppt, as previously reported from several coastal sites (Sander et al., 2003, and references herein). BrO mixing ra-tios below the detection limit are also predicted by the re-spective model studies for Brittany (see Sect. 5.5.2). Our measurements in Brittany can also be understood as an up-per limit for BrO from organic sources, since we measured
CH2IBr as a possible source for reactive bromine in
excep-tionally high mixing ratios (up to 10 ppt), which have thus far not been reported. Brominated hydrocarbons have life-times on the order of days and weeks, with the exception of
CH2IBr, which has a photolytic lifetime of ∼1 h (M¨ossinger
et al., 1998). A statistical analysis of all BrO data taken dur-ing the Brittany campaign gives no indication that organic species are precursors for BrO, since there is no dependency
of the BrO signal on tidal height or the appearance of bromi-nated hydrocarbons. However, due to the insufficient sensi-tivity of the instrument, no further conclusions can be drawn. A modelling sensitivity study suggests that BrO mixing ra-tios are affected by such high CH2IBr mixing ratios, although
well below the detection limit of the DOAS method (see Sect. 5.5.2).
5.4 Results of OIO and I2analysis
We were not able to identify the absorption structures of OIO
or I2unambiguously in the spectra during the campaigns at
the North Sea and Brittany. Although the mixing ratio ex-ceeds several times the statistical 2σ detection limit (max-imum mixing ratios of 13.3 ppt in Brittany, 15.3 ppt at the North Sea, see Table 3), the optical density of the respec-tive absorption structure is in the same order as the resid-ual, so that no definite statement is possible. The analy-sis in the 500–600 nm region has some principal problems causing these high residual structures that resulted in high errors for individual cases, that well exceed the respective statistical 2σ detection limit. The observations of OIO above the detection limit during two evenings of the experiment in Mace Head 1998 confirms the report of OIO at Mace Head by Saiz-Lopez and Plane (2004), but it should be noted that the unambiguous identification of the OIO absorptions in the spectra has as well difficulties. The time series in Fig. 15 is only shown for times with stable lamp reference structures. In the remaining time (16–29 September) the interference of the temporarily varying lamp structures with the OIO absorp-tions were too strong to allow the identification of OIO. The appearance and the magnitude of OIO in the MBL is of great
23 May 30 May 6 Jun 13 Jun -20 -100 10 20 -30 0 30 0 2 4 6 0 4 8 0 2 4 20 40 60 0 400 800 2 4 6 OIO [ppt ] Date [GMT Ticks at 00:00] I2 [p pt ] NO 2 [p pb] IO [ppt ] Br O [p pt ] In-situ DOAS Ozo n e [pp b ] S olar rad. [W /m 2 ] T ida l he ig h t [m ]
Fig. 10. The time series for the RHS compounds, NO2and O3for the campaign in Lilia, Brittany during May and June, 2003. Neither I2
and OIO nor BrO could be identified unequivocally above their respective detection limits.
interest due to the possible impact on new particle forma-tion processes. In this respect we have to consider that our DOAS measurements along the absorption-paths of ∼20 km were not suitable to detect inhomogeneous sources for OIO as proposed by Burkholder et al. (2004), due to averaging over extended airmasses in time and space. In contrast to the results in Brittany, we could identify I2successfully in
the Mace Head data set of 1998, with peak mixing ratios of
more than 60 ppt. The complete I2 time series with
corre-sponding tidal height is given in Fig. 13. The highest
mix-ing ratio of I2was detected at the end of the campaign on
three consecutive nights. Within a short time frame the I2
increased rapidly from below the detection limit to peak val-ues of more than 60 ppt (see Fig. 14). The abrupt rise of the
I2 mixing ratio is closely correlated to the minima in tidal
height. With rising water level, I2disappeared as fast as it
appeared. I2was observed for the first time in Mace Head
during the 2002 NAMBLEX campaign by Saiz-Lopez and
Plane (2004). They reported I2mixing ratios of up to 93 ppt
at night (and 25 ppt during daytime) measured by active long-path DOAS technique. The peak mixing ratios appeared closely correlated to low tide, indicating macroalgae as the
1 2 3 4 5 6 7 8 -1 0 1 2 3 4 5 6 --- DaytimeIO --- Nighttime IO [IO] = 7.28 - 1.95*TH + 0.13 * TH2 R2 = 0.93 IO [p pt] Tidal height (TH) [m] [IO] = -0.05 + 0.01 * TH R2 = 0.002
Fig. 11. Correlation of IO mixing ratio with tidal height, separated for day and nighttime data, taken in Brittany 2003. For better illus-tration the IO mixing ratios are averaged over units of 0.5 m tidal height.
primary source. Although large numbers of macroalgae were present at the coast of Brittany, we could not identify I2above
the statistical detection limit. However, we could not exclude I2to be present below the detection limit, which would still
have a considerable impact for atmospheric chemistry (see Sect. 5.5.2).
Our re-analysis of the 1998 Mace Head campaign shows
up to 60 ppt I2 confirming previous observations of I2 in
Mace Head. This rises the question about the presence of I2
at other coastal regions. It should be noted, that these differ-ences cannot be explained by the analysis method, which was identical for the data sets of all campaign sites. Mace Head and the coast of Brittany are populated with similar and iden-tical macroalgae species, such as Laminaria, which is known for its high content of iodine. Laminaria is commonly found in the lower intertidal and sublittoral fringe. Consequently,
Laminaria is not exposed to ambient air frequently, except
during spring-tide, when the water reaches exceptionally low levels. Our observations of I2on 5, 6, and 7 October in Mace
Head show a fast nocturnal increase of I2, with mixing ratios
of more than 50 ppt, which is well correlated with spring-tide. During these periods the sea level is about 0.6 m lower
than at normal low tide periods. Figure 14 shows that the I2
mixing ratio exceeds the 30 ppt mark when the water level decreases below the normal low tide minimum of 0.64 m.
High I2 levels were only observed at the end of the Mace
Head campaign, when the wind came from easterly direc-tions (see Fig. 15), where extended algae fields are found, as described in the Sect. 3.3. While we observed elevated levels
of IO during the day and OIO during some evenings, I2was
not as clearly observed during spring-tide in early Septem-ber. We attribute this finding to the different wind directions during this period. During the normal low tide period in the middle of the campaign, we also did not find elevated levels of I2, despite the easterly wind direction. From the
correla-tion of I2with spring-tide during periods with easterly winds
we conclude that macroalgae inhabiting the lowest part of the intertidal zone, such as Laminaria, are the most likely
source for the observed I2at Mace Head. The high I2mixing
ratios indicate that these algae produce I2at extremely high
rates during times when they are exposed to ambient air, i.e., during spring-tide.
In Brittany we found a great variety of different algae, which were regularly exposed to the atmosphere over ex-tended areas during tidal minima, but no evidence for
ele-vated I2 emissions. Since the laminaria species preferably
inhabit areas unaffected by the normal tide, the plants are lo-cated far off the coast due to the high tidal range of up to 14 m. The laminaria species present in Brittany were there-fore maybe too far from the DOAS instrument to yield
de-tectable I2 levels. The absence of I2 in Brittany therefore
does not contradict our theory of the I2 sources in coastal
areas.
Although our results suggest that only some exclusive al-gae species are able to emit I2into the gas phase, we can not
exclude the potential impact of the biological state and age
of the plant on the I2emissions. Both campaigns in 1998 and
2002 in Mace Head where I2was detected were conducted in
late summer and autumn, whereas the campaign in Brittany took place in spring. This may imply differences in air and sea temperatures that could also affect plant stress.
5.5 Modelling
In order to compare some of the conclusions gained from the measurements with the present understanding of halogen chemistry, we present results of model calculations with the marine boundary model MISTRA.
5.5.1 Model description
The 1-D column model MISTRA includes detailed particle microphysics, as well as chemical reactions in the gas and aerosol phase, focusing on reaction cycles of halogen com-pounds. MISTRA has already been used to address different aspects of halogen chemistry in the marine boundary layer (von Glasow and Sander, 2001; von Glasow et al., 2002b,a). The model configuration employed here mostly resembles the base run described in detail in von Glasow et al. (2002b), representing conditions for a clean marine mid-latitude sum-mer atmosphere. The chemical reaction scheme (in particular with regards to iodine chemistry) has been updated accord-ing to Atkinson et al. (2004). For the self-reaction of IO, the mean branching ratios of Bloss et al. (2001) are used. The self-reaction of OIO (which is assumed to be photolytically stable), as well as reactions of OIO with OH and NO, are in-cluded in analogy to von Glasow et al. (2002b). Possible ho-mogeneous nucleation of OIO is neglected. The meteorolog-ical conditions assumed in our study represent a cloud-free
24.5 25.5 26.5 27.5 28.5 29.5 -1 0 1 2 3 4 -4 -2 0 2 4 6 8 0 5 10 15 20 0 200 400 600 800 1000 1200 IO [ppt ] Date [GMT Ticks at 00:00] Nighttime (SZA>90°) T ida l he ight [m] CH2IBr CH2I2 [ppt v] Sol ar ra di at ion [W/ m 2 ] 2.6 3.6 4.6 5.6 6.6 7.6 -2 0 2 4 6 8 10 12 -4 -2 0 2 4 6 8 0 5 10 15 20 0 200 400 600 800 1000 1200 IO [ppt ] Date [GMT Ticks at 00:00] Nighttime (SZA>90°) T ida l he ight [m] [ppt v] CH2IBr CH2I2 Sol ar ra di at ion [W/ m 2 ]
Fig. 12. Sequences of the recorded time series for IO of the 2003 Brittany campaign. The blue line indicates the tidal height and grey shaded areas indicate dark conditions (SZA≥90◦).
Upper panel: High tide occurred at midday, and the IO peaks are observed in the morning and in the evening, and are well correlated to the minima of the water level.
Lower panel: The minimum in tidal height coincides with maxima of solar flux and we observed the strongest peak of the IO mixing ratio on four consecutive days.
sun declination 22◦). Furthermore, higher NO2 mixing
ra-tios compared to von Glasow et al. (2002b) of about 1 ppb (as measured in Brittany) were used for model initialization. Vertical turbulent mixing is accounted for in the model.
After a “spin-up” period of 2 days of meteorology and chemistry assuming open-ocean conditions, different scenar-ios are performed, each for 6 model hours. During model hours 2 to 4, constant mixing ratios of organoiodines are prescribed in the lowest 15 m of the model, based on val-ues measured in Brittany as a simple representation of
en-hanced mixing ratios of alkyl iodines during low tide. We simulated four scenarios prescribing different mixing ratios of organoiodines inferred from the measurements in Brit-tany: Scenarios 1, 2, and 3 use daytime mean, midday max-imum, and daytime maximum values of alkyl iodine, re-spectively, while scenario 0 denotes a model run without any emissions of organoiodines. The exact values are pro-vided in Table 5. Each scenario was performed for morning (04:00–10:00 a.m. local time, assuming low tide from 05:00– 08:00 a.m.) and midday conditions (10:00 a.m.–04:00 p.m.,
5.9 10.9 15.9 20.9 25.9 30.9 5.10 0 20 40 60 800 2 4 6 I2 [ppt] Ti dal h e ig ht [m]
Fig. 13. I2time series of the Mace Head campaign in 1998. The dotted line indicates the mean detection limit of 20 ppt. The shaded areas
indicate I2clearly identified above the detection limit (with respect to the individual error).
5.10 6.10 7.10 8.10 9.10 -10 0 10 20 30 40 50 60 70 80 -4 -2 0 2 4 6 I2 [p pt] Date [GMT Ticks at 00:00] T ida l he ight [m] ∆THmini = 0.62m
Fig. 14. 5, 6, and 7 October 1998 PARFORCE campaign in Mace Head, where the highest mixing ratios of up to 60 ppt I2were
de-tected.
assuming low tide from 11:00 a.m.–02:00 p.m.). Additional sensitivity studies are performed, assuming constant fluxes instead of constant mixing ratios of organoiodines in order to more realistically investigate the qualitative differences be-tween the morning and midday scenarios (scenario 4). Fur-thermore, the effect of a hypothetical I2flux on atmospheric
chemistry is investigated (scenario 5).
5.5.2 Model results
Figure 16 shows the effect of prescribed organoiodine con-centrations as measured in Brittany (see Table 5) on IO, BrO and ozone for scenarios assuming low tide during midday.
Table 5. Mixing ratios of organoiodines (ppt), as prescribed in the model scenarios. Values for scenarios 1–3 rely on mean or maximum mixing ratios, as measured in Brittany during “day-time” (05:00 a.m.–07:00 p.m.) or during “midday” (09:00 a.m.– 03:00 p.m.).
Scenario CH3I C2H5I C3H7I CH2ClI CH2BrI CH2I2
0: none 0 0 0 0 0 0
1: daytime mean 249 31.9 2.3 0.9 1.5 1.8 2: midday max. 542 9.1 23.5 2.9 7.8 5.4 3: daytime max. 1830 96.9 34.8 2.9 7.8 11.4
After 3 h of low tide conditions IO mixing ratios reach about 1.5 ppt, 4.5 ppt, and 10 ppt in 15 m altitude for the differ-ent scenarios described above, which is in the range of the DOAS measurements (Fig. 16a). If exactly the same alkyl iodine concentrations are assumed for the morning hours, the modelled IO mixing ratios are about a factor of 4 lower (not shown). In all cases, the short-lived CH2I2contributes by far
the largest part to the modelled IO mixing ratios. For exam-ple, omitting the huge amount of CH3I (1830 ppt) in scenario
3 decreases IO by only 7% after 3 h at low tide. It should be noted that, compared to clean marine air with only a few ppt
NO2(as assumed by von Glasow et al., 2002b), a NO2
ing ratio of about 1 ppb (as used here) decreases the IO
mix-ing ratios produced by a given amount of CH2I2by roughly
50%, primarily due to enhanced formation of IONO2.
Recy-cling of reactive iodine by aerosol processing is responsible for roughly 10% of the modelled IO.
0 30 60 0 90 180 270 3600 300 600 0 3 6 9
4 Sep 11 Sep 18 Sep 25 Sep 2 Oct 9 Oct 0 30 60 0 2 4 0 3 6 0 5 10 Oz one [ppb] W. D ir . [° ] S ol ar ra d. [W /m 2 ] IO [ppt ] I2 [ppt] NO 2 [ppb] T idal hei ght [m ] OIO [ppt ]
Date [GMT Tciks at 00:00]
Fig. 15. The time series for the campaign during 1998 PARFORCE campaign in Mace Head. Tidal height, meteorological parameters, and NO2, I2, IO, OIO and O3are shown.
The model-predicted BrO never exceeds 1 ppt, and thus ranges generally below the DOAS detection limit, in agree-ment with the measureagree-ments (Fig. 16b). Heterogeneous
pro-cessing of BrONO2accounts for about 20% of the modelled
BrO mixing ratios. These BrO mixing ratios are lower than in the cases for the clean marine boundary layer, as discussed in von Glasow et al. (2002b), because of the high mixing
ratio of NOxused here, which shifts the BrO vs. BrONO2
steady state mixing ratios. In our simulations, BrO signifi-cantly increases with increasing emissions of VHOCs. This increase is mainly due to the release of Br from the photoly-sis of CH2BrI.
An important effect of organoiodine emissions is the de-struction of ozone via photochemically produced I radi-cals. For the high organoiodine concentrations of scenario 3, roughly 1 ppb ozone is destroyed in 5 h (Fig. 16c), which is on the order of the natural variability of ozone, and there-fore not detectable in the field, but relevant for atmospheric chemistry with typical ozone destruction rates of a few ppb per day.
The model runs depicted in Fig. 16 allow the direct com-parison with measurements. To investigate the impact of photochemistry with constant fluxes of VHOCs (instead of prescribed concentrations), we did another set of model runs (Fig. 17). A constant surface flux of 4×10⁹molec/(cm2s) of
Fig. 16. Comparison of the model scenarios for midday hours. Different colors denote different prescribed mixing ratios of organoiodines, i.e., different scenarios (see Table 5): black – sce-nario 0; red – scesce-nario 1; blue – scesce-nario 2; green – scesce-nario 3. The period of low tide is marked on the time axis. Mixing ratios are shown for the lowest model layer (5 m).
CH2I2(scenario 4) results in about 4 ppt CH2I2at about 15 m
altitude at midday, whereas CH2I2mixing ratios reach up to
15 ppt during the morning hours due to lower photolysis rates at higher zenith angles (Fig. 17a). For the same reason, I rad-ical mixing ratios, and thus IO mixing ratios, are higher for the midday than for the morning scenario (green and black lines in Fig. 17c). After 3 h of emission during low tide, the ratio between midday and morning IO is about 2.3, which is in good qualitative agreement with the field measurements shown in Fig. 12.
Apart from scenarios assuming organoiodine emissions, Fig. 17 also shows otherwise identical scenarios prescrib-ing a constant flux of molecular iodine (1010molec/(cm2s), scenario 5) instead of organoiodines (red and blue lines in Fig. 17). This leads to mixing ratios of I2in the model below
0.5 ppt (Fig. 17b), the mixing ratios in the early morning be-ing highest for the reason discussed above. Despite these low I2mixing ratios, the effect on IO is considerable (Fig. 17c):
After 3 h of emission during low tide, modelled IO mixing ratios rise to 8 ppt in the morning, and 16 ppt in the midday scenario. This is due to the short photolytic lifetime of about
Fig. 17. Comparison of two morning and two midday
scenar-ios assuming constant fluxes of organoiodines (scenario 4) or I2
(scenario 5), respectively: black – scenario 4 for morning hours; green – scenario 4 for midday hours; red – scenario 5 for morning hours; blue – scenario 5 for midday hours. Please note the different time axes for morning (04:00–10:00 a.m.) and midday (10:00 a.m.– 04:00 p.m.) scenarios. The period of low tide is marked. Mixing ratios are shown for the second model level (15 m).
10 s for I2, compared to several minutes in the case of CH2I2.
Hence, the model results confirm that even very low mixing
ratios of I2(well below the DOAS detection limit) can have
a large impact on iodine chemistry.
The agreement of the model runs that include only VHOCs with the measured IO indicate that under the conditions en-countered in Brittany, the presence of molecular iodine is not necessary to explain the observed IO mixing ratios. How-ever, as we do not account for nucleation of iodine oxides, which could be an important sink for IO, we regard our model results as an upper limit of IO. Hence, in spite of the agreement between observations and modelling without
including molecular iodine, we cannot exclude I2as a
pre-cursor for IO. This conclusion is also supported by the fact that DOAS measurements yield mean mixing ratios along the light path and thus cannot identify hot spots.
6 Conclusions and outlook
The measurements of RHS and their likely precursors at three different coastal environments, along with comparison to model studies, allows us to test whether our understanding of halogen chemistry, as represented in the model, is consis-tent with the data. The following conclusions can be drawn:
– We positively identified IO at levels of up to 7.7 ppt as
the only halogen oxide in all three studied coastal envi-ronments. The maximum level of IO consistently corre-sponded to the detected level of organoiodines found at the respective sites.
– BrO was not identified at any of the locations and we
can confirm upper limits of its appearance in the respec-tive MBL at 1.5–2 ppt, in agreement with our model calculations, even assuming contributions of observed biological sources as CH2IBr of up to 8 ppt.
– The agreement of our model calculations for the
condi-tions of Brittany with the measurements is quite satis-factory: The IO mixing ratios observed by DOAS can be explained by the photolysis of observed levels of organoiodines alone. The presence of molecular iodine is not necessary to explain the observed IO mixing ratios but from the measurements its presence at levels below 20 ppt cannot be excluded.
– The impact of the presence of macroalgae on VHOCs
was clearly demonstrated. Moreover, different types of macroalgae show individual emission patterns.
– OIO could not be identified unambiguously neither at
the North Sea nor in Brittany. However, due to high detection limits in individual cases we cannot exclude the presence of OIO of up to 15 ppt. OIO at Mace Head was only clearly observed for short periods during two nights of the 1998 experiment, during other times OIO remained below the detection limit.
– No conclusions about the “hot spot” theory were
pos-sible due to the long lightpath of ∼10 km used for the DOAS measurements. The combination of spatially re-solved OIO and IO measurements and particle bursts should be a topic of future field campaigns.
– I2was found during the re-analysis of 1998 Mace Head
data, with peak mixing ratios of up to 60 ppt at night. The high levels were found to be closely correlated to exceptionally low water levels (spring-tide conditions), indicating macroalgae inhabiting the lowest part of the intertidal zone as the source. Significantly elevated lev-els of I2were not found at the comparable coastal site of
Brittany. Further investigations and observations of the differences of these environments should be performed in order to estimate the global relevance of molecular iodine in the atmosphere.
– The biological state, e.g. the age of the macroalgae
should be investigated, for example through longterm observations
– The current measurement technique has a relatively
high detection limit for I2, and the model studies
sug-gest that even very low mixing ratios of I2under
day-light conditions could strongly affect the marine atmo-sphere.
Acknowledgements. We would like to thank the BMBF for funding
the ReHaTrop project in the framework of the AFO2000 program. For fruitful discussions on halogen chemistry we would like to thank R. von Glasow. For encouraging support during the extended field campaigns much thanks to A. Lotter, O. Sebasti´an, R. Sin-reich, S. Laukemann and very special thanks to N. Bobrowski. Edited by: A. Richter
References
Alicke, B., Hebestreit, K., Stutz, J., and Platt, U.: Iodine oxide in the marine boundary layer, Nature, 397, 572–573, 1999. Allan, B. J., McFiggans, G., and Plane, J. M. C.: Observation of
iodine monoxide in the remote marine boundary layer, J. Geo-phys. Res., 105, 14 363–14 369, 2000.
Allan, B. J., Plane, J. M. C., and McFiggans, G.: Observations of OIO in the remote marine boundary layer, Geophys. Res. Lett., 28, 1945–1948, 2001.
Atkinson, R., Baulch, D. L., Cox, R. A., Crowley, J., Hampson Jr., R. F., Hynes, R., Jenkin, M., Kerr, J. A., Rossi, M. J., and Troe, J.: Summary of Evaluated Kinetic and Photochemical Data for Atmospheric Chemistry: Web Version July 2004, http://www. iupac-kinetic.ch.cam.ac.uk, 2004.
Bloss, W. J., Rowley, D. M., Cox, R. A., and Jones, R. L.: Kinetics and Products of the IO Self-Reaction, J. Phys. Chem. A, 105, 7840–7854, 2001.
Bobrowski, N., H¨onninger, G., Galle, B., and Platt, U.: Detection of bromine monoxide in a volcanic plume, Nature, 423, 273–276, 2003.
Burkholder, J. B., Curtius, J., Ravishankara, A. R., and Lovejoy, E. R.: Laboratory studies of the homogeneous nucleation of io-dine oxides, Atmos. Chem. Phys., 4, 19–34, 2004,
SRef-ID: 1680-7324/acp/2004-4-19.
Carpenter, L., Hebestreit, K., Sturges, W., Penkett, S., Liss, P., Al-icke, B., and Platt, U.: Observation of short-lived alkyl iodides and bromides at Mace Head, Ireland: links to biogenic sources and halogen oxide production, J. Geophys. Res., 104, 1679– 1689, 1999.
Carpenter, L., Liss, P., Platt, U., and Hebestreit, K.: Coastal zone production of IO precursors: a 2-dimensional study, Atmos. Chem. Phys., 1, 9–17, 2001,
SRef-ID: 1680-7324/acp/2001-1-9.
Carpenter, L. J.: Iodine in the marine boundary layer, Chem. Rev., 103, 4953–4962, 2003.
Coheur, P.-F., Fally, S., Carleer, M., Clerbaux, C., Colin, R., Jenou-vrier, A., M´erienne, M.-F., Hermans, C., and Vandaele, A. C.: New water vapor line parameters in the 26 000–13 000 cm−1 re-gion, J. Quant. Spect. Rad. Trans., 74, 493–510, 2002.
Cox, R., Bloss, W., Jones, R., and Rowley, D.: OIO and the at-mospheric cycle of iodine, Geophys. Res. Lett., 26, 1857–1860, 1999.
Ekdahl, A., Pedersen, M., and Abrahamsson, K.: A study of the diurnal variation of biogenic volatile halocarbons, Mar. Chem., 63, 1–8, 1998.
Fayt, C. and van Rozendael, M.: WinDOAS, ISAB/BIRA Belgium, http://www.oma.be/BIRA-IASB, 2001.
Frieß, U.: Spectroscopic Measurements of Atmospheric Trace Gases at Neumayer-Station, Antarctica, Institut f¨ur Umwelt-physik, Universit¨at Heidelberg, PhD thesis, 2001.
Frieß, U., Wagner, T., Pundt, I., Pfeilsticker, K., and Platt, U.: Spectroscopic Measurements of Tropospheric Iodine Oxide at Neumeyer Station, Antarctica, Geophys. Res. Lett., 28, 1941– 1944, 2001.
Greenblatt, G. D., Orlando, J. J., Burkholder, J. B., and Ravis-hankara, A. R.: Absorption Measurements of Oxygen between 330 and 1140 nm, J. Geophys. Res., 95, 18 577–18 582, 1990. Hausmann, M. and Platt, U.: Spectroscopic measurement of
bromine oxide and ozone in the high Arctic during Polar Sunrise Experiments 1992, J. Geophys. Res., 99, 25 399–25 413, 1994. Hebestreit, K.: Halogen Oxides in the Mid-Latitudinal Planetary
Boundary Layer, Institut f¨ur Umweltphysik, Universit¨at Heidel-berg, PhD thesis, 2001.
Hebestreit, K., Stutz, J., Rosen, D., Matveiv, V., Peleg, M., Luria, M., and Platt, U.: DOAS Measurements of Tropospheric Bromine Oxide in Mid-Latitudes, Science, 283, 55–57, 1999. Hegels, E., Crutzen, P. J., Kl¨upfel, T., Perner, D., and Burrows,
P. J.: Global distribution of atmospheric bromine monoxide from GOME on earth-observing satellite ERS 2, Geophys. Res. Lett., 25, 3127–3130, 1998.
Hoffmann, T., O’Dowd, C. D., and Seinfeld, J. H.: IO homogeneous nucleation: An explanation for coastal new particle formation, Geophys. Res. Lett., 28, 1949–1952, 2001.
H¨onninger, G.: Referenzspektren reaktiver Halogenverbindungen f¨ur DOAS-Messungen, University of Heidelberg, Diploma the-sis, 1999.
H¨onninger, G.: Halogen Oxide Studies in the Boundary Layer by Multi Axis Differential Optical Absorption Spectroscopy and Active Longpath-DOAS, Institut f¨ur Umweltphysik, Universit¨at Heidelberg, PhD thesis, 2002.
H¨onninger, G., Bobrowski, N., Palenque, E., Torrez, R., and Platt, U.: Reactive bromine and sulfur emissions at Salar de Uyuni, Bolivia, Geophys. Res. Lett., 31, L04101, doi:10.1029/2003GL018818, 2004a.
H¨onninger, G., Leser, H., Sebasti´an, O., and Platt, U.: Ground-based measurements of halogen oxides at the Hudson Bay by active longpath DOAS and passive MAX-DOAS, Geo-phys. Res. Lett., 31, L04111, doi:10.1029/2003GL018982, 2004b.
Jimenez, J. L., Bahreini, R., Cocker, D. R., Zhuang, H., Varut-bangkul, V., Flagan, R. C., Seinfeld, J. H., O’Dowd, C. D., and Hoffmann, T.: New particle formation from photooxida-tion of diiodomethane CH2I2, J. Geophys. Res., 108, 4318,
doi:10.1029/2002JD002452, 2003.
Leser, H., H¨onninger, G., and Platt, U.: MAX-DOAS measure-ments of BrO and NO2 in the marine boundary layer,
Geo-phys. Res. Lett., 30, 1537, doi:10.1029/2002GL015811, 2003. M¨akel¨a, J. M., Hoffmann, T., Holzke, C., V¨akev¨a, M., Suni, T.,
Mat-tila, T., Aalto, P. P., Tapper, U., Kauppinen, E. I., and O’Dowd, C. D.: Biogenic iodine emissions and identification of end-products in coastal ultrafine particles during nucleation bursts, J. Geophys. Res., 107, 8110, doi:10.1029/2001JD000580, 2002. Martinez, M., Arnold, T., and Perner, D.: The role of bromine and chlorine chemistry for Arctic ozone depletion events in Ny
˚
Alesund and comparison with model calculations, Ann. Geo-phys., 17, 941–956, 1999,
SRef-ID: 1432-0576/ag/1999-17-941.
Matveev, V., Peleg, M., Rosen, D., Tov-Alper, D. S., Hebestreit, K., Stutz, J., Platt, U., Blake, D., and Luria, M.: Bromine oxide – ozone interaction over the Dead Sea, J. Geophys. Res., 106, 10 375–10 387, 2001.
Meller, R. and Moortgat, G. K.: Temperature dependance of the absorption cross sections of HCHO between 223 and 323 K in the wavelength range 225–375 nm, J. Geophys. Res., 105, 7089– 7102, 2000.
M¨ossinger, J., Shallcross, D., and Cox, R.: UV-VIS absorption cross-section and atmospheric lifetimes of CH2Br2, CH2I2and CH2BrI, J. Chem. Soc. Faraday Trans., 94 (10), 1391–1396,
1998.
O’Dowd, C., Geever, M., Hill, M., Smith, M., and Jennings, S.: New particle formation: nucleation rates and spatial scales in the clean marine coastal environment, Geophys. Res. Lett., 25, 1661–1664, 1998.
O’Dowd, C., Jimenez, J., Bahreini, R., Flagan, R. C., Seinfeld, J., Haemeri, K., Pirjola, L., Kulmala, M., Jennings, S., and Hoff-mann, T.: Marine aerosol formation from biogenic iodine emis-sions, Nature, 417, 632–636, 2002.
Platt, U.: Differential optical absorption spectroscopy (DOAS), in: Air Monitoring by Spectroscopic Techniques, edited by: Sigrist, W. M., John Wiley & Sons, Inc., 127, 27–84, 1994.
Platt, U. and H¨onninger, G.: The role of halogen species in the troposphere, Chemosphere, 52, 325–338, 2003.
Platt, U. and Lehrer, E.: Arctic Tropospheric Ozone Chemistry, ARCTOC, Final Report of the EU-Project No. EV5V-CT93-0318, Heidelberg, 1996.
Platt, U. and Perner, D.: Measurements of Atmospheric Trace Gases by Long Path Differential UV/visible Absorption Spectroscopy, Optical and Laser Remote Sensing, p. 95–105, Springer Verlag, New York, 1983.
Pruvost, J.: ´Etude des compos´es organiques halog´en´es volatils en milieu marin. Origines biologiques et anthropiques, ´echanges avec l’atmosph`ere – Utilisation comme traceurs transitoires de la circulation dans l’Atlantique de Nord-Est, DEA Chimie fine, Chimie Analytique, Chimie de l’Environnement Marin de l’Universit´e de Bretagne Occidentale, PhD thesis, 2001. Saiz-Lopez, A. and Plane, J.: Novel iodine chemistry in the
marine boundary layer, Geophys. Res. Lett., 31, L04112, doi:10.1029/2003GL019215, 2004.
Saiz-Lopez, A., Plane, J. M. C., and Shillito, J. A.: Bromine oxide in the mid-latitude marine boundary layer, Geophys. Res. Lett., 31, doi:10.1029/2003GL018956, 2004a.
Saiz-Lopez, A., Saunders, R. W., Joseph, D. M., Ashworth, S. H., and Plane, J. M. C.: Absolute absorption cross-section and pho-tolysis rate of I2, Atmos. Chem. Phys., 4, 1443–1450, 2004b,
SRef-ID: 1680-7324/acp/2004-4-1443.
Sander, R., Keene, W. C., Pszenny, A. A. P., Arimoto, R., Ayers, G. P., Baboukas, E., Cainey, J. M., Crutzen, P. J., Duce, R. A.,