HAL Id: hal-00296574
https://hal.archives-ouvertes.fr/hal-00296574
Submitted on 18 Jun 2008
HAL is a multi-disciplinary open access
archive for the deposit and dissemination of
sci-entific research documents, whether they are
pub-lished or not. The documents may come from
teaching and research institutions in France or
abroad, or from public or private research centers.
L’archive ouverte pluridisciplinaire HAL, est
destinée au dépôt et à la diffusion de documents
scientifiques de niveau recherche, publiés ou non,
émanant des établissements d’enseignement et de
recherche français ou étrangers, des laboratoires
publics ou privés.
in the free troposphere: case studies
D. R. Benson, Li-Hao Young, Shan-Hu Lee, T. L. Campos, D. C. Rogers, J.
Jensen
To cite this version:
D. R. Benson, Li-Hao Young, Shan-Hu Lee, T. L. Campos, D. C. Rogers, et al.. The effects of airmass
history on new particle formation in the free troposphere: case studies. Atmospheric Chemistry and
Physics, European Geosciences Union, 2008, 8 (12), pp.3015-3024. �hal-00296574�
Atmos. Chem. Phys., 8, 3015–3024, 2008 www.atmos-chem-phys.net/8/3015/2008/ © Author(s) 2008. This work is distributed under the Creative Commons Attribution 3.0 License.
Atmospheric
Chemistry
and Physics
The effects of airmass history on new particle formation in the free
troposphere: case studies
D. R. Benson1, Li-Hao Young1, Shan-Hu Lee1, T. L. Campos2, D. C. Rogers2, and J. Jensen2
1Kent State University, Department of Chemistry, Kent, OH, USA
2National Center for Atmospheric Research, Earth Observing Laboratory, Broomfield, CO, USA
Received: 4 September 2007 – Published in Atmos. Chem. Phys. Discuss.: 8 October 2007 Revised: 12 March 2008 – Accepted: 20 May 2008 – Published: 18 June 2008
Abstract. Recent aircraft studies showed that new particle
formation (NPF) is very active in the free troposphere. And, these observations lead to a new question: when does NPF not occur? Here, we provide case studies to show how dif-ferent meteorological parameters affect NPF in the upper tro-posphere, using the aerosol size distributions measured at lat-itudes from 18◦N–52◦N and altitudes up to 14 km during the NSF/NCAR GV Progressive Science Missions. About 95% of the total samples showed the NPF feature with median number concentrations of particles with diameters from 4 to
9 nm (N4−9), 288±199 cm−3, and the total particle number
concentrations with diameters from 4 to 2000 nm (N4−2000),
500±259 cm−3. Surface areas were in general very low in
the free troposphere, 1.58±0.87 µm2cm−3, which in part
ex-plains the high frequency of NPF measured in this region, but there was no distinctive difference in surface area for the NPF and non-NPF cases. Our case studies show that rather airmass history is more important for nucleation in this re-gion. Weak- or non-events did not display uplifting of air-masses. On the other hand, strong NPF events were usually associated with uplifting of airmasses, although there were also NPF cases in which uplift did not occur, consistent with the previous observations (Young et al., 2007). NPF tends to easily occur in the free troposphere because of low surface areas and low temperatures (Carslaw and K¨archer, 2006), but because of the low aerosol precursors in this region, vertical motion (that can bring higher concentrations of aerosol pre-cursors from low altitude source regions to higher altitudes) can play a critical role. Latitude dependence of new particles also shows higher particle concentrations in the midlatitude and subtropics tropopause region than in the tropics, consis-tent with Hermann et al. (2003).
Correspondence to: Shan-Hu Lee ([email protected])
1 Introduction
Recent aircraft studies showed new particle formation (NPF) in the free troposphere and lower stratosphere (de Reus et al., 1998, 1999; Nyeki et al., 1999; Twohy et al., 2002; Lee et al., 2003; Young et al., 2007) with high frequen-cies (up to 86–100%) (Young et al., 2007) and strong
mag-nitudes (up to 45 000 cm−3) (Twohy et al., 2002).
Her-mann et al. (2003) have provided so far the most comprehen-sive statistical analysis of NPF in the Northern Hemisphere tropopause region from three-year aircraft measurements;
el-evated particle number concentrations of 1500–8000 cm−3
were frequently observed in a wide range of latitudes (5◦N–
50◦N). Twohy et al. (2002) showed especially high
num-ber concentrations of new particles up to 45 000 cm−3in the
midlatitudes, associated with deep convection. Minikin et al. (2003)’s aircraft studies showed relatively high
concen-trations of Aitken mode particles (up to 1000 cm−3)even in
the Southern Hemisphere, where the anthropogenic emission
of SO2is much lower than in the Northern Hemisphere; their
comparison of particle number concentrations in the North-ern and SouthNorth-ern Hemisphere indicates that new particles are directly related to aerosol precursor sources. NPF events take place near or in orographic clouds (Wiedensohler el al., 1997; Mertes et al., 2005) and stratus clouds (Hegg et al., 1992) during the nighttime, and even in cirrus clouds (Lee et al., 2004). As NPF was observed in a wide range of the free tro-posphere and lower stratosphere (Str¨om et al., 1999; Twohy et al., 2002; Hermann et al., 2003; Minikin et al., 2003; Lee et al., 2003, 2004; Young et al., 2007), it is also important to understand when NPF does not occur or when weak NPF occurs.
We present results from NPF studies during the Na-tional Science Foundation (NSF) and NaNa-tional Center for Atmospheric Research (NCAR) NSF/NCAR GV Progres-sive Science Missions. The GV is also known as HIAPER, the High-performance Instrumented Airborne Platform for
Table 1. The median values of the measured particle concentration
from 4–9 nm (N4−9), the particle concentration from 4–2000 nm
(N4−2000), and other key meteorological parameters during the
en-tire NSF/NCAR GV Progressive Science Missions. All 7 research flights are included here. The median absolute deviation values are also included. NPF indicates NPF. In total, 5181 data points of 30 s average data are included here.
All Days NPF Non-NPF
N4−9(cm−3) 275±198 288±199 4.93±4.88
N4−2000(cm−3) 457±273 500±259 60.8±42.3
Surface Area (µm2cm−3) 1.58±0.87 1.52±0.84 2.32±1.49
Temperature (K) 228±11 227±8 244±29
Relative Humidity Over Ice (%) 13.3±11.0 11.4±8.8 24.9±24.0
Potential Temperature (K) 325±14 327±12 310±26
H2O Mixing Ratio (ppmv) 115±75 102±58 423±398
Altitude (km) 9.52±2.31 9.87±1.94 5.67±4.72
Fraction of samples (%) 100 95 5
Environmental Research. The Progressive Science Mission was the first science mission onboard the GV and there were seven days of research flights (Young et al., 2007). There is the Part I paper by Young et al. (2007) that used two days of measurements in the midlatitude tropopause region (on 1 and 7 December 2005) from this mission to show how stratosphere and troposphere air mixing enhances NPF. The present study is the Part II paper, and we want to investi-gate when no-/weak- NPF takes place. There is also a third manuscript (Lee et al., 2008) that discusses nighttime ultra-fine particles observed from GV.
2 NSF/NCAR GV Progressive Science Missions
The NSF/NCAR GV Progressive Science Mission NPF stud-ies took place from 21 November to 19 December 2005 in Broomfield, Colorado. The flights covered the western half of the United States, and parts of Canada and Mexico in
latitude from 18◦N to 62◦N and in longitude from 92◦W
to 130◦W. There were three days of nighttime NPF
experi-ments (2, 12 and 19 December 2005) in order to investigate the effects of sun exposure (Lee et al., 2008). Nighttime stud-ies in this region are rare.
Aerosol sizes and concentrations were measured with the University of Denver nuclei mode aerosol size spectrometer (NMASS) and focused cavity aerosol spectrometer (FCAS). These instruments are described in detail elsewhere (Jons-son et al., 1995; Brock et al., 2000; Lee et al., 2003, 2004; Young et al., 2007) and have been used for NPF studies in the upper troposphere and lower stratosphere previously (Lee et al., 2003, 2004; Young et al., 2007). Briefly, NMASS has five condensation nucleus counters that measure cumulative number concentrations of aerosols larger than 4, 8, 15, 30 and 60 nm, respectively. FCAS is a light scattering instrument and sizes aerosols from 90 to 2000 nm. Using an inversion
10-2 10-1 100 101 102 103 104 N4-9 (cm -3 ) 0.1 1 10 100 Surface Area (µm2 cm-3 ) NPF event NonNPF event Strong event line Weak event line
(a) 10-2 10-1 100 101 102 103 104 N4-9 (cm -3 ) 280 260 240 220 200 Temperature (K) NPF event NonNPF event Strong event line Weak event line
(b) 10-2 10-1 100 101 102 103 104 N4-9 (cm -3 ) 1 10 100 RHI (%) NPF event NonNPF event Strong event line Weak event line
(c)
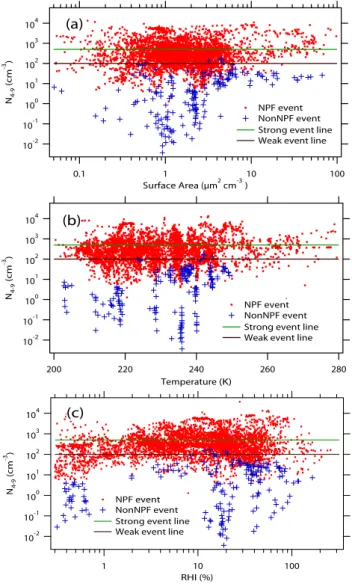
Fig. 1. The measured N4−9 as a function of surface area,
tem-perature and RHI during the entire NSF/NCAR GV Progressive Science Mission. All 7 research flights are included here. The data are split into two categories, NPF (red circles) and non-NPF (blue crosses), as discussed in the text. The horizontal bars indicate the level of the strong- (N4−9>500 cm−3)(green) and weak-NPF (N4−9<75 cm−3) (brown); note that the weak event line also is nearly the same as that the upper limit of the non-NPF N4−9, indi-cating that both non- and weak-events have sufficiently low N4−9.
algorithm, size distributions from 4 to 2000 nm are obtained. The inversion also includes sampling efficiency, anisokinetic inlet effects, and diffusion loss etc.
The criteria for NPF are (i) N4−9>1 cm−3, (ii) more than 1/15 of N4−2000are N4−9, and (iii) particles from 4 to 6 nm
(N4−6)are higher than those from 6 to 9 nm (N6−9)(Young
et al., 2007). A non-NPF event is defined when at least one of these three criteria is not satisfied. Non-events tended to have size distributions without a peak in the size range <10 nm, a
D. R. Benson et al.: The effects of airmass history on new particle formation 3017 clear indication of more aged aerosols than for NPF cases
(Fig. 3c). Each NPF event is further classified as a strong or week event by comparing with “background” concentra-tions, which are referred to as the median concentration val-ues from all events shown in Table 1. Strong events are for the cases when N4−9>500 cm−3(which is approximately the same value as that one median absolute deviation value
higher than the median N4−9for all events, (275+198) cm−3
in this case; similarly to Young et al. (2007)); weak events are
defined when N4−9<100 cm−3(one median absolute
devia-tion value lower than the median N4−9for all events, which is
(275–198) cm−3, and we took 100 cm−3here for simplicity).
As shown in Fig. 1, weak- and non-NPF cases show a
sim-ilar upper level of N4−9, indicating that even though these
two cases may have different size distributions (e.g., N4−6
vs. N6−9), they both have low N4−9. Previous NPF
stud-ies in the free troposphere made by other investigators have used the criterion that the measured total CN concentrations are higher than the background CN concentrations to iden-tify NPF cases (Twohy et al., 2003 and numerous references cited therein), for example. In comparison, our criteria for NPF are more quantitative, yet consistent with these cited studies. For example, our non-NPF samples had much lower
N4−9 and N4−2000than the median concentrations from all
days of experiments (Table 1) (that is, background concen-trations) so they will also be non-NPF cases even with the NPF criterion used in these cited studies.
There were only less than 2% of the measurement data from this mission showed RH values greater than 100%. All case studies presented here were taken from cloud free sec-tions of the flight (e.g., RH<60%) so new particles were not affected by clouds. Our previous studies also have shown that shattering of clouds in the inlet of the NMASS and FCAS in-struments has little effects on the measured aerosol number concentrations (while there are some effects on mass con-centrations) (Lee et al., 2004), so the measured new particles were unlikely affected by cloud processing.
3 Results
3.1 Overall
Table 1 summarizes the measured particle concentrations and meteorological conditions during this mission,
includ-ing the measured N4−9, N4−2000, surface area density of
preexisting aerosols, temperature, relative humidity over ice (RHI), the potential temperature, water mixing ratio, and altitude, along with the fraction of samples that sat-isfy (thus NPF), or do not satsat-isfy (non-NPF), the NPF
cri-teria. Overall, there were 95% of NPF and 5% of
non-NPF cases during the entire Progressive Science Missions (Table 1). Furthermore, 30% of NPF cases were strong-NPF and 25% were weak-strong-NPF. For strong-NPF events, the median
N4−9value was 288±199 cm−3and the median N4−2000was
500±259 cm−3. On the other hand, non-NPF events had
a median N4−9 of 4.93±4.88 cm−3 and a median N
4−2000
of 60.8±42.3 cm−3, both much lower than the overall N
4−9
of 275±198 cm−3and N4−2000of 457±273 cm−3. The
im-portant feature here is that a small fraction of measurements (5%), the non-NPF cases, showed an obvious and large
de-viation from the N4−9median. Surface area concentrations
were very low in this region, 1.58±0.87 µm2cm−3. For
NPF events surface areas were 1.52±0.84 µm2cm−3,and
for non-events 2.32±1.49 µm2cm−3; however, the ranges
of surface area were in fact the same for NPF and
non-NPF events (Fig. 1). Our low surface areas are
consis-tent with other studies (4–6 µm2cm−3 on average (Young
et al., 2007), 3.4±1.7 µm2cm−3(Lee et al., 2003) and less
than 10 µm2cm−3(Twohy et al., 2003; Carslaw and K¨archer,
2006)) and these low surface areas in general also explain the high frequency of NPF observed in this region. The higher median surface area for non-NPF is probably related to the fact that most of the non-NPF events were measured in the lower altitudes (Fig. 1b and c and Table 1). For example, for the non-event samples, the median temperature was ∼244 K, higher than that for NPF cases (∼228 K) (Table 1).
Our case studies discussed below will show weak- or non-NPF events did not show uplifting of the airmass, whereas strong NPF cases were closely associated with uplifting. In the present study, uplifting of the airmass is defined based on the NOAA HYSPLIT backward trajectory outputs (e.g., airmass altitude dependence with time) (Draxler and Rolph, 2003). Uplifting is referred to as the cases when the airmass was uplifted from a lower altitude, usually less than 2 km above ground level, to higher altitudes at an uplift rate greater than 3 km per day and the airmass was exposed to these low altitude source regions for at least 2 days before the vertical motion. On the other hand, if this rate was less than 3 km per day or if the airmass spent less than two days at an altitude of 2 km or less, we considered such a case as a non-uplifting event. It is noted that this “uplifting” process is slightly dif-ferent from the conventional “convection”, which is usually defined as a small scale process on the order of kilometers or less in size (the model output from NOAA HYSPLIT calcu-lations only has a grid resolution of 1 degree and cannot truly resolve convective systems).
HYSPLIT trajectories were run for a large number of cases other than those presented in two case studies in Sects. 3.2 and 3.3. However, because of the tremendous amount of data points we did not calculate for each individual data point. Also, when calculating HYSPLIT trajectories, one can only input the UTC time in hours for the starting time and our measurements were in 1 s and the data presented here were averaged in 30 s. Regardless, for NPF events (Table 1), in general it seemed that the majority of the time (>50%) the events displayed some degree of uplift. On the other hand, all non-NPF events found in the free troposphere region did not experience uplifting of airmasses (Sect. 3.2).
4000 3000 2000 1000 0 N4-9 , N 4-2000 (cm -3 ) 64.6x10³ 64.4 64.2 64.0 63.8 63.6 UTC (s) 20 15 10 5 0
RHI (%), Surface Area (µm
2 cm -3 ) 260 250 240 230 220 Temperature (K) 10 8 6 4 2 0 NFrac , N 4-6 /N 6-9 N4-9 N4-2000 RHI Temperature
Surface Area NFrac N4-6/N6-9
(a) 200 150 100 50 0 N4-9 , N 4-2000 (cm -3) 54.6x10³ 54.4 54.2 54.0 53.8 UTC (s) 30 20 10 0
RHI (%), Surface Area (µm
2 cm -3 ) 250 245 240 235 230 225 220 Temperature (K) 20 15 10 5 0 NFrac , N 4-6 /N 6-9 N4-9 N4-2000 RHI Temperature
Surface Area NFrac N4-6/N6-9
(b) 200 150 100 50 0 N4-9 , N 4-2000 (cm -3) 55.4x10³ 55.3 55.2 55.1 55.0 54.9 54.8 54.7 UTC (s) 40 30 20 10 0
RHI (%), Surface Area (µm
2 cm -3 ) 260 250 240 230 220 Temperature (K) 10 8 6 4 2 0 NFrac , N 4-6 /N 6-9 N4-9 N4-2000 RHI Temperature
Surface Area NFrac N4-6/N6-9
(c)
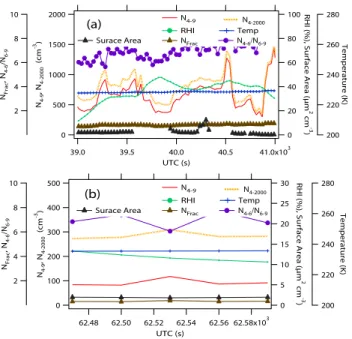
Fig. 2. The measured total particle number concentration
(N4−2000), ultrafine particle concentration (N4−9), fraction of
N4−9in N4−2000 (NFrac), ratio of the particle number
concentra-tion in the size range from 4 to 6 nm (N4−6)over that from 6 to 9 nm (N6−9), surface area, temperature and relative humidity over ice (RHI) as a function of universal time for several different events that were observed on 19 December 2005. (a) A strong NPF event ob-served during the day which occurred at 57◦N, 116◦W, 7.6 km and temperatures around 238 K. (b) A weak NPF event observed during the day which occurred at 50◦N, 112◦W, 8.0 km and temperatures around 235 K. (c) A non NPF event observed during the day which occurred at 52◦N, 113◦W, 8.0 km and temperatures around 237 K. See Fig. 2 for measured aerosol size distributions and Fig. 3 for backward trajectory calculations.
3.2 Case Study I (19 December 2005): Strong-, Weak-, and
Non-NPF Events
To understand how different meteorological parameters af-fect NPF, a variety of types of NPF events must be ana-lyzed including strong-, weak- and non-events. However, because there were only 186 data points (5%) that showed
4000 3000 2000 1000 0 dN/dLog D P (cm -3 ) 4 5 6 7 8 9 10 2 3 4 56 7 8 9 100 2 3 4 5 6 7 8 9 1000 D P(nm) (a) 120 100 80 60 40 20 0 dN/dLog DP (cm -3 ) 4 56 7 8 9 10 2 3 4 5 6 7 8 9100 2 3 4 56 7 8 91000 DP(nm) (b) 150 100 50 0 dN/dLog DP (cm -3) 4 5 6 7 8 9 10 2 3 4 5 6 7 8 9 100 2 3 4 5 6 7 8 9 1000 DP(nm) (c)
Fig. 3. The measured, average particle size distributions for the
events shown in Fig. 2. The letters here correspond to those from Fig. 2 and each distribution is for the time period shown for the corresponding event from Fig. 2. The dip at ∼100 nm in the size distribution comes from the inversion program when combining the NMASS and the FCAS data together and may not be representative of the actual aerosols sizes. The same is true for Fig. 6. The size mode at 20 nm or 70 nm (b and c) is representative of more aged particles that grew from newly formed fresh particles.
absolute non-NPF events (Table 2) and some of these data points were also rather sporadically distributed, we provide here only one case study including a non-NPF event. Fig-ure 2 shows strong- (a) weak- (b), and non-NPF (c) event cases, for the measured N4−2000, N4−9, fraction of N4−9 in
N4−2000 (NFrac), ratio of the particle number concentration
in the size range from 4 to 6 nm (N4−6)over that from 6 to
9 nm (N6−9)(N4−6/N6−9), surface area, temperature and
RHI as a function of universal time for 19 December 2005’s
flight. On this day, the GV flew north to latitude 62◦N
D. R. Benson et al.: The effects of airmass history on new particle formation 3019
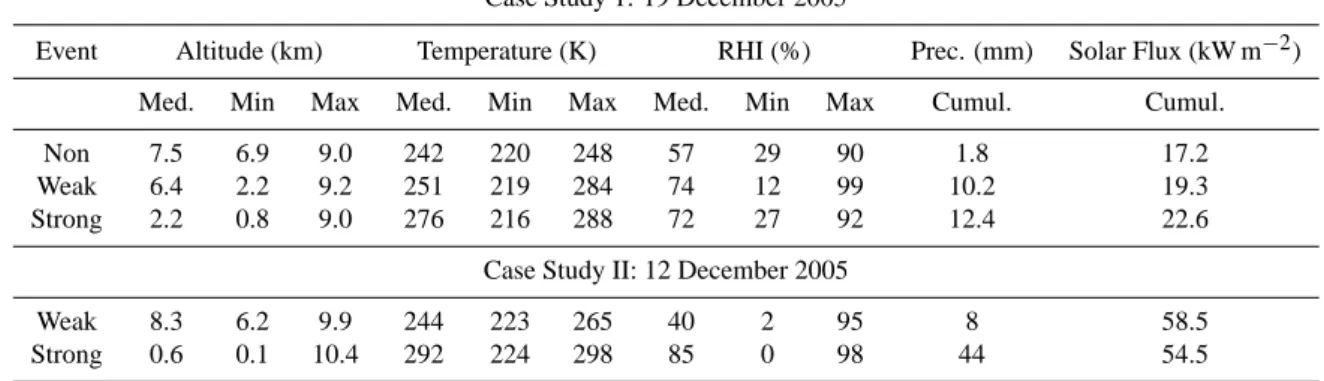
Table 2. The meteorological parameters derived from the five day NOAA HYSPLIT trajectory calculations for the case studies used in the
present study. Median, maximum, and minimum values of the altitude, temperature, RHI, cumulative precipitation and cumulative solar flux intensity are shown.
Case Study 1: 19 December 2005
Event Altitude (km) Temperature (K) RHI (%) Prec. (mm) Solar Flux (kW m−2) Med. Min Max Med. Min Max Med. Min Max Cumul. Cumul. Non 7.5 6.9 9.0 242 220 248 57 29 90 1.8 17.2 Weak 6.4 2.2 9.2 251 219 284 74 12 99 10.2 19.3 Strong 2.2 0.8 9.0 276 216 288 72 27 92 12.4 22.6
Case Study II: 12 December 2005
Weak 8.3 6.2 9.9 244 223 265 40 2 95 8 58.5 Strong 0.6 0.1 10.4 292 224 298 85 0 98 44 54.5
along a similar track. This flight was made in the upper troposphere region (altitudes 8 to 14 km) for most of the time and had a ∼4 h of daytime and another ∼4 h of night-time measurements. The case studies shown here are taken from the daytime measurement. The strong event occurred at 57◦N, 116◦W, and 7.6 km, the weak event occurred at 50◦N,
112◦W, and 7.6 km, and the non-event was found in a
simi-lar geographical region, 52◦N, 113◦W, and 8.0 km (and thus all three events took place at similar temperatures <240 K). Figure 3 shows the average aerosol size distributions taken for the periods corresponding to these three events (Fig. 2).
There are substantial differences in the number concentra-tion and size distribuconcentra-tion between all three of these events.
The strong event had N4−9 of 1500 cm−3 and N4−2000
of 2000 cm−3, the weak event had N4−9 of 20 cm−3 and
N4−2000of 60 cm−3, and the non event had N4−9of 5 cm−3
and N4−2000 of 100 cm−3(failing to satisfy one of the NPF
criteria, the ratio of N4−9 over N4−2000 (NFrac)>6%). The
strong event shows clearly fresh new particles in the size range <10 nm as does the weak event, but the strong event has a much higher particle concentrations for the smaller par-ticles and the weak event has peaks at 20 nm and 70 nm. The non-event shows almost no particles in the <10 nm range and shows more aged aerosols with the highest aerosol mode at around 70 nm. RHI was actually highest (20%) for the non-event compared to the weak non-event (15%) and strong non-event
(8%) case. The surface area was comparable (∼1 µm2cm−3)
for all three events. The surface areas measured at event times are often related to altitudes, with higher surface areas at lower altitudes (Young et al., 2007).
Differences among the three events can also be seen in the back trajectory data from HYSPLIT. The strong event had a higher amount of cumulative precipitation (12.4 mm) com-pared to the weak event (10.2 mm) and non event (1.8 mm) as is shown in Table 2. The solar flux was also slightly
higher for the strong event (22.6 kW m−2) than the
weak-(19.3 kW m−2)and non-event (17.2 kW m−2). However, the
distinctive difference between the three events is the airmass history from the previous five days (Fig. 4). These trajec-tories show two main differences. The first difference is the altitude that the airmasses come from. For the strong NPF event, the airmass originated from a much lower alti-tude (1 km) three days prior to the event, whereas the airmass for the weak event originated from about 2 km and the air-mass for the non event was in the upper troposphere (7 km) for the past 5 proceeding days. Furthermore, for the strong event, the airmass was uplifted over 6 km in the span of a day, whereas the airmass for the weak event rose 6 km in three days. Such differences suggest that the airmass from the strong NPF event underwent a significant extent of ver-tical motion and rapidly brought higher concentrations of the expected aerosol precursors (e.g., H2SO4, NH3, organic
compounds and water vapor, as well as OH and sulfur com-pounds that can be oxidized to form H2SO4, including SO2)
from lower altitudes to aid in NPF at higher altitudes with lower temperatures. It is also possible that air mixing might occur when the humid and warm air was rapidly uplifted to higher altitudes and mixed with the cold and dry air at the higher altitudes and this case, a steep gradient of temperature and RH took place to enhance nucleation rates because nu-cleation is a non-linier process as discussed in Nilsson and Kulmala (1998). For the non-event, there was no uplifting present at all. It is noted that it was consistent that other non-event cases all did not have vertical motion, clearly un-derlying the importance of large scale vertical motion for nu-cleation in this high altitude region.
3.3 Case Study II (12 December 2005): Strong- and
Weak-Events
Figures 5 and 6 show graphs for a strong and weak NPF event occurring on 12 December 2005. On 12 December 2005,
the GV flew from Colorado (40◦N latitude) south to latitude
(a)
(b)
(c)
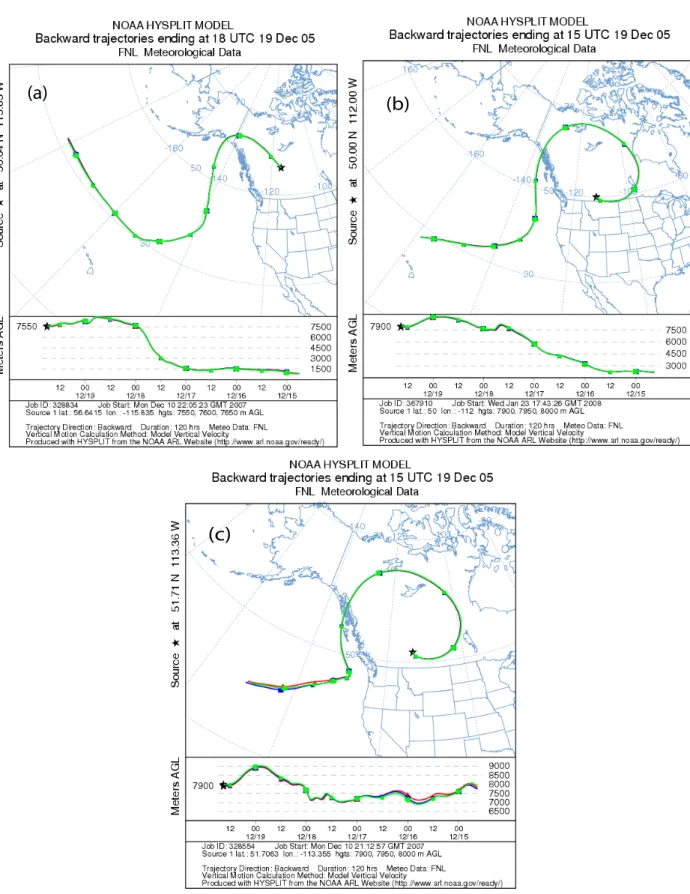
Fig. 4. NOAA HYSPLIT back trajectories for the airmasses for the strong- (upper left panels) (corresponding to Figs. 2a and 3a),
weak-(upper right panels) (Figs. 2b and 3b), and non-event (bottom left panels) (Figs. 2c and 3c) on 19 December 2005. The star indicates where the event occurred. Altitude variations as a function of the number of days prior to the event are also shown (12 h of interval).
D. R. Benson et al.: The effects of airmass history on new particle formation 3021 2000 1500 1000 500 0 N4-9 , N 4-2000 (cm -3) 41.0x10³ 40.5 40.0 39.5 39.0 UTC (s) 100 80 60 40 20 0
RHI (%), Surface Area (µm
2 cm -3 ) 280 260 240 220 200 Temperature (K) 10 8 6 4 2 NFrac , N 4-6 /N 6-9 N4-9 N4-2000 RHI Temp
Surace Area NFrac N4-6/N6-9
(a) 500 400 300 200 100 0 N4-9 , N 4-2000 (cm -3) 62.58x10³ 62.56 62.54 62.52 62.50 62.48 UTC (s) 30 25 20 15 10 5 0
RHI (%), Surface Area (µm
2 cm -3 ) 280 260 240 220 200 Temperature (K) 10 8 6 4 2 NFrac , N 4-6 /N 6-9 N4-9 N4-2000 RHI Temp
Surace Area NFrac N4-6/N6-9
(b)
Fig. 5. The same as Fig. 2 except for a strong (a) and weak (b) NPF
event occurring on 12 December 2005. The strong event occurred before sunrise (nighttime) at 36◦N, 115◦W, and 10 km. The weak event occurred during the day at 37◦N, 111◦W, and 9 km.
18◦N before sunrise and returned along the same track to
Colorado after sunrise by flying through similar longitudes, latitudes, and altitudes. The strong event occurred before
sunrise (nighttime) at 36◦N, 115◦W, and 10 km while the
weak event occurred after sunrise during the day at 37◦N,
111◦W, and 9 km. Both events occurred at temperatures
be-low 240 K.
Similarly to the previous case study, there were substan-tial differences in number concentration and size distribu-tion between the strong- and the weak-events. The strong
event had N4−9 of 700 cm−3 and N4−2000 of 800 cm−3,
whereas the weak event had N4−9 of 90 cm−3and N4−2000
of 280 cm−3. The strong event also shows many more
par-ticles in the size range <10 nm, whereas the weak event shows similar amounts of smaller and larger particles. RHI was higher (40%) for the strong event compared to the weak event (12%). The surface area was also comparable (∼2 µm2cm−3)for both events.
Once again the HYSPLIT trajectory shows differences be-tween the two events. The strong event had a higher amount of cumulative precipitation (44 mm) compared to the weak event (8 mm) as is shown in Table 2. The solar flux,
how-ever, was comparable for both cases (∼55 kW m−2). The
distinctive difference between the strong and weak events is the back trajectory from the previous five days (Fig. 7). These trajectories show the same differences as the previous case study. For the strong NPF event, the airmass originated from a much lower altitude (ground level) three days prior to
3000 2500 2000 1500 1000 500 0 dN/dLog DP (cm -3 ) 4 5 6 7 8 9 10 2 3 4 56 7 8 9100 2 3 4 5 6 7 8 91000 DP (nm) (a) 400 300 200 100 0 dN/dLog DP (cm -3 ) 4 56 7 8 9 10 2 3 4 5 6 7 8 9 100 2 3 4 56 7 8 9 1000 Dp (nm) (b)
Fig. 6. The measured, average particle size distribution for the
events from Fig. 5. The letters here correspond to those from Fig. 5 and each distribution is for the time period shown for the corre-sponding event from Fig. 5.
the event, whereas the airmass for the weak event was only exposed to altitudes as low as 7 km a day prior to the event and was actually at higher altitudes (∼9 km) 2 to 3 days prior to the event. The strong event experienced rapid vertical mo-tion (10 km in 2 days), whereas the weak event experienced far less an extent of vertical motion (only 2 km in a day). As in the previous case study, this could be a reason why the strong event had such high levels of new particle concentra-tion compared to the weak event.
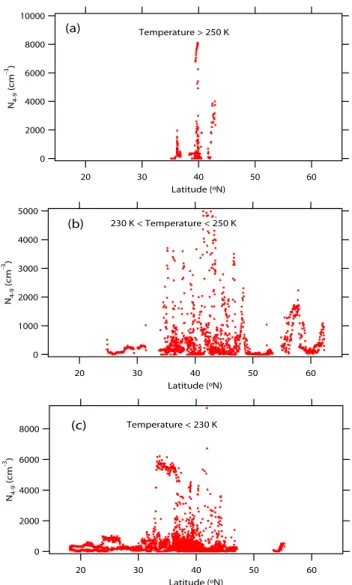
3.4 Latitude dependence of new particles
Figure 8 shows the latitude dependence of ultrafine particles for all 7 science flights measured at for three different tem-perature and altitude regions: temtem-perature >250 K (altitude <6 km), 230 K<temperature<250 K (6 km<altitude<9 km), and 200 K<temperature<230 K (9 km<altitude<14 km). These results show that at altitudes from 9 to 14 km, par-ticle concentrations are higher in the subtropics and mid-latitudes than in the tropics, consistent with the Hermann et al. (2003) trend; both the present study and Hermann et al. (2003) were mostly conducted near the tropopause re-gion in the midlatitudes at similar latitude ranges. It has been shown that air mixing induced by convection and the stratosphere and troposphere exchange is strong in the mid-latitude (Pan et al., 2007) and these air mixing processes
(a)
(b)
Fig. 7. The same as Fig. 4, except for the strong (left) (corresponding to Figs. 5a and 6a) and weak (right) (Figs. 5b and 6b) NPF events
occurring on 12 December 2005.
can enhance NPF; for example, very high frequency (86–
100 %) and high magnitude (∼700–3960 cm−3 N4−9 and
∼1000–3990 cm−3 N4−2000) of NPF were observed in the
mid-latitude tropopause region due to air mixing (Young et al., 2007). On the other hand, this trend is different from the previous report by Lee et al. (2003) which showed higher concentrations of ultrafine particles in the lower latitudes. Because a majority of the data in Lee et al. (2003) were taken in the subtropics and polar regions, rather than in the midlatitutes, while the present study was made mostly in the midlaltitude region, a direct comparison between Lee et al. (2003) and this study is difficult.
4 Discussions and conclusion
Because surface area is the sink of new particles, an
anti-correlation of N4−9 with surface area might be expected.
However, our analysis shows little correlation between these two parameters, although the median value of surface ar-eas was higher for non-NPF events than NPF events. This is probably because that the majority of the samples (95%) were NPF cases and the measurements were made in a wide range of the free troposphere region (altitudes up to 14 km and latitudes from 18◦N–62◦N). This feature in fact is also
consistent with Str¨om et al. (1999) which showed that ul-trafine particles are not always anti-correlated to surface ar-eas in the free troposphere. The high frequency and mag-nitude of NPF observed in this region (Twohy et al., 2003; Young et al., 2007; Hermann et al., 2003; Lee et al., 2003; this study) are thus due to such low surface areas
mea-sured in this region in general (4–6 µm2cm−3 on average
(Young et al., 2007); 3.4±1.7 µm2cm−3(Lee et al., 2003);
<10 µm2cm−3 (Twohy et al., 2003; Carslaw and K¨archer,
2006); 1.58±0.87 µm2cm−3from the present study) and in
addition to low temperatures (Carslaw and K¨archer, 2006). Our case studies shown in this study indicate that airmass history is important for nucleation in this region. All non-/weak-NPF cases identified here did not have large scale ver-tical motion, indicating that airmasses originated from rela-tively high altitudes, possibly with low concentrations of ex-pected aerosol precursors. On the other hand, strong events usually had uplifting. Large scale uplifting brings higher
concentrations of aerosol precursors (including SO2and
wa-ter vapor) to higher altitudes where temperature and surface areas are lower. With these factors together, uplifting can create an ideal condition for aerosol NPF: higher aerosol precursors, lower surface areas, low temperatures, and air
D. R. Benson et al.: The effects of airmass history on new particle formation 3023 the atmosphere is around 10–14 days under the typical free
tropospheric conditions. Even with this relatively long
pho-tochemical lifetime, however, the measured SO2
concentra-tions in the free troposphere showed a clear vertical profile, with much lower concentrations at higher altitudes than in the ground level (Thornton et al., 1999). In this case, uplifting can play a very important role for bringing higher concentra-tions of SO2from the source regions to higher altitudes in a
short time. In addition, it is possible that rapid uplifting can also bring insoluble organic trace gases to higher altitudes to produce new particles (Kulmala et al., 2006). Abrupt air mixing can also take place during rapid uplifting. As shown in previous theoretical predictions (Nilsson and Kulmala., 1998), because nucleation is a non-linear process, when two airmasses mix with each other with different RHI, tempera-tures, and aerosol precursors, nucleation rates can be much higher than without mixing.
While the role of uplifting of an airmass on NPF is much clear, it is less clear how other meteorological parameters from the airmass history can also play a role in determining if nucleation occurs and the extent to which it occurs (Table 2). The solar flux from the previous five days was similar for the strong- and weak- NPF events for both case studies and if the sun exposure fraction (that is the average ratio of the sun exposure hours in a day during the five preceding days) also did not vary much day to day (approximately 0.5 to 0.6), so the average OH concentrations in airmasses would be similar. While the RHI was higher for the strong event than the weak event on 12 December, the values were comparable for both events on December 19 (Table 2). Precipitation may have affected the strength of the event as in both cases the strong event experienced more cumulative precipitation (Table 2). Precipitation is believed to lower the surface area density be-cause of scavenging, but since for all these events the surface areas were in fact very low in this region, the precipitation ef-fects can be less important under such a condition. For these specific case studies, however, the altitude rather seems to be a dominating factor in determining the strength of the NPF event. Both strong events had a median altitude of less than 2.5 km during the previous five days and had minimum alti-tudes very close to the ground level (<1 km), whereas for the weak events the median altitudes were both above 6 km and the air never fell below 2 km (Table 2). And, this may again point to the significance of airmass history in determining the extent of NPF.
It was consistent that weak- or non-events did not expe-rience large scale uplifting during the Progressive Science Missions. Because of low surface areas and low tempera-tures, nucleation can easily take place, but with the limited supply of aerosol precursors in this region, nucleation be-comes sensitive to the extent of vertical motion. Our obser-vations are inline with numerous obserobser-vations (de Reus et al., 1998; Nyeki et al., 1999; Str¨om et al., 1999; Twohy et al., 2002; Lee et al., 2003; Minikin et al., 2003; Hermann et al., 2003; Carslaw and K¨archer, 2006) in which NPF was
of-10000 8000 6000 4000 2000 0 N4-9 (cm -3 ) 60 50 40 30 20 Latitude (ºN) Temperature > 250 K (a) 5000 4000 3000 2000 1000 0 N4-9 (cm -3 ) 60 50 40 30 20 Latitude (ºN) 230 K < Temperature < 250 K (b) 8000 6000 4000 2000 0 N4-9 (cm -3) 60 50 40 30 20 Latitude (ºN) Temperature < 230 K (c)
Fig. 8. The measured N4−9 as a function of latitude for
dif-ferent temperatures (and hence difdif-ferent altitudes) during the NSF/NCAR GV Progressive Science Mission. All 7 research flights are included here. Temperatures >250 K (Altitudes < 6 km); 230 K<Temperatures < 250 K (6 km < Altitudes < 9 km); Temper-atures < 230 K (Altitudes > 9 km).
ten attributed to air mixing and convection. However, there were also some NPF cases where vertical motion clearly did not occur (<50% of the NPF cases), similarly to Young et al. (2007), suggesting that airmass history is an important but not the only governing factor for aerosol nucleation in this region.
Acknowledgements. This study was supported by NSF grants
awarded to KSU (ATM-0507709; CAREER ATM-0645567). NCAR is supported by NSF, but any opinions expressed here do not represent those from NSF. We thank James C. Wilson for provid-ing NMASS and FCAS and helpful discussions, and the scientists, engineers and pilots involved in the NSF/NCAR GV Progressive Science Missions. We also thank two reviewers for helpful com-ments.
Edited by: D. Cziczo
References
Brock, C. A., Schr¨order, F., K¨archer, B., Petzold, A., Busen, R., and Fiebig, M.: Ultrafine particle size distributions measured in aircraft exhaust plumes, J. Geophys. Res., 105, 26 555–26 567, 2000.
Carslaw, K. S. and K¨archer, B.: Stratospheric aerosol processes, Chap. 1, in: Stratospheric Processes and Their Role in Global Climate (SPARC), A Project of WMO/ICSU/IOC World Climate Research Program: Assessment of Stratospheric Aerosol Prop-erties (ASAP), edited by: Thomason, and Peter, Th., SPARC Scientific Steering Group, February 2006, http://www.atmosp. physics.utoronto.ca/SPARC/ASAP%20V3c1.pdf, 2006. de Reus, M., Str¨om, J., Kulmala, M., Pirjola, L., Lelieveld, J.,
Schiller, C., and Z¨oger, M.: Airborne aerosol measurements in the tropopause region and the dependence of NPF on preexist-ing number concentration, J. Geophys. Res., 103, 31 255–31 263, 1998.
de Reus, M., Str¨om, J., Hoor, R., Lelieveld, J., and Schiller, C.: Particle production in the lowermost stratosphere by convective lifting of the tropopause, J. Geophys. Res., 104, 23 935–23 940, 1999.
Draxler, R. R. and Rolph, G. D.: HYSPLIT (HYbrid Single-Particle Lagrangian Integrated Trajectory) Model access via NOAA ARL READY Website (http://www.arl.noaa.gov/ready/hysplit4.html), NOAA Air Resources Laboratory, Silver Spring, MD, 2003. Hermann, M., Heintzenberg, J., Wiedensohler, A., Zahn, A.,
Hein-rich, G., and Brenninkmeijer, C. A. M.: Meridional distribu-tions of aerosol particle number concentradistribu-tions in the upper tro-posphere and lower stratosphere obtained by Civil Aircraft for Regular Investigation of the Atmosphere Based on an Instru-ment Container (CARIBIC) flights, J. Geophys. Res., 108, 4114, doi:10.1029/2001JD001077, 2003.
Jonsson, H. H., Wilson, J. C., Brock, C. A., Knollenberg, R. G., Newton, R., Dye, J. E., Baumgardner, D., Borrmann, S., Ferry, G. V., Pueschel, R., Woods, D. C., and Pitts, M. C.: Performance of a focused cavity aerosol spectrometer for measurements in the stratosphere of particle size in the 0.06–2.0 µm diameter range, J. Atmos. Ocean Technol., 12, 115–129, 1995.
Kulmala, M., Reissell, A., Sipil¨a, M., Bonn, B., Ruuskanen, T. M., Lehtinen, K. E. J., Kerminen, V.-M., and Str¨om, J.: Deep convective clouds as aerosol production engines: Role of insoluble organics, J. Geophys. Res., 111, D17202, doi:10.1029/2005JD006963, 2006.
Lee, S. H., Reeves, J. M., Wilson, J. C., Hunton, D. E., Viggiano, A. A., Miller, T. M., Ballenthin, J. O., and Lait, L. R.: Particle formation by ion nucleation in the upper troposphere and lower stratosphere, Science, 301, 1886–1889, 2003.
Lee, S.-H., Wilson, J. C., Baumgardner, D., Herman, R. L., Wein-stock, E. M., LaFleur, B. G., Kok, G., Anderson, B., Lawson, P., Baker, B., Strawa, A., Pittman, J. V., Reeves, J. M., and Bui, T. P.: NPF observed in the tropical/subtropical cirrus clouds, J. Geophys. Res., 109, D02009, doi:10.1029/2004JD005033, 2004.
Lee, S.-H., Young, L.-H., Benson, D. R., Suni, T., Kulmala, M., Junninen, H., Campos, T. L., Rogers, D. C., and Jensen, J.: Ob-servations of Nighttime NPF in the Troposphere, J. Geophys. Res., 113, D10210, doi:10.1029/2007JD009351, 2008.
Mertes, S., Galgon, D., Schwirn, K., Nowak, A., Lehmann, K., Massling, A., Wiedensohler, A., and Wieprecht, W.: Evolution of particle concentration and size distribution observed upwind, inside and downwind hill cap clouds at connected flow condi-tions during FEBUKO, Atmos. Environ., 39, 4233–4245, 2005. Minikin, A., Petzold, A., Str¨om, J., Krejci, R., Seifert, M.,
Velthoven, P. V., Schlager, H., and Schumann, U.: Aircraft ob-servations of the upper tropospheric fine particle aerosol in the northern and southern hemispheres at midlatitudes, Geophys. Res. Lett., 30, 1503, doi:10.1029/2002GL016458, 2003. Nilsson, E. D. and Kulmala, M.: The potential for atmospheric
mixing processes to enhance binary nucleation rate, J. Geophys. Res., 103, 1381–1389, 1998.
Nyeki, S., Kalberer, M., Lugauer, M., Weingartner, E., Petzold, A., Schr¨oder, F., Colbeck, I., and Baltensperger, U.: Condensation Nuclei (CN) and ultrafine CN in the free troposphere to 12 km: A case study over the Jungfraujoch high-alpine research station, Geophys. Res. Lett., 26, 2195–2198, 1999.
Pan, L. L., Bowman, K. P., Shapiro, M., Randel, W. J., Gao, R., Campos, T., Davis, C., Schauffler, S., Ridley, B. A., Wei, J. C., and Barnet, C.: Chemical behavior of the tropopause region observed during the Stratosphere-Troposphere Analyses of Re-gional Transport (START) experiment, J. Geophys. Res., 112, D18110, doi:10.1029/2007JD008645, 2007.
Str¨om, J., Fischer, H., Lelieveld, J., and Schr¨oder, F.: In situ mea-surements of microphysical properties and trace gases in two cu-mulonimbus anvils over western Europe, J. Geophys. Res., 104, 12 221–12 226, 1999.
Thornton, D. C., Bandy, A. R., Blomquist, B. W., Driedger, A. R., and Wade, T. P.: Sulfur dioxide distribution over the Pacific Ocean 1991–1996, J. Geophys. Res., 104, 5845–5854, 1999. Twohy, C. H., Clement, C. F., Gandrud, B. W., Weinheimer, A.
J., Campos, T. L., Baumgardner, D., Brune, W. H., Faloona, I., Sachse, G. W., Vay, S. A., and Tan, D.: Deep convection as a source of new particles in the midlatitude upper troposphere, J. Geophys. Res., 107, 4560, doi:10.1029/2001JD000323, 2002. Wiedensohler, A., Hansson, H.-C., Orsini, D., Wendisch, M.,
Wag-ner, F., Bower, K. N., Choularton, T. W., Wells, M., Parkin, M., Acker, A., Wieprecht, W., Fachini, M. C., Lind, J. A., Fuzzi, S., Arends, B. G., and Kulmala, M.: Nighttime formation and occur-rence of new particles associated with orographic clouds, Atmos. Environ., 31, 2545–2559, 1997.
Young, L.-H., Benson, D. R., Montanaro, W. M., Lee, S.-H., Pan, L. L., Rogers, D. C., Jensen, J., Stith, J. L., Davis, C. A., Campos, T. L., Bowman, K. P., Cooper, W. A., and Lait, L. R.: Enhanced NPF observed in the northern midlatitude tropopause region, J. Geophys. Res., 112, D10218, doi:10.1029/2006JD00810, 2007.