HAL Id: hal-01823695
https://hal.laas.fr/hal-01823695
Submitted on 26 Jun 2018
HAL is a multi-disciplinary open access archive for the deposit and dissemination of sci-entific research documents, whether they are pub-lished or not. The documents may come from teaching and research institutions in France or abroad, or from public or private research centers.
L’archive ouverte pluridisciplinaire HAL, est destinée au dépôt et à la diffusion de documents scientifiques de niveau recherche, publiés ou non, émanant des établissements d’enseignement et de recherche français ou étrangers, des laboratoires publics ou privés.
Conformational changes in antibody Fab fragments upon
binding and their consequences on the performance of
docking algorithms
Amélie Barozet, Marc Bianciotto, Thierry Simeon, Hervé Minoux, Juan Cortés
To cite this version:
Amélie Barozet, Marc Bianciotto, Thierry Simeon, Hervé Minoux, Juan Cortés. Conformational changes in antibody Fab fragments upon binding and their consequences on the performance of docking algorithms. Immunology Letters, Elsevier, 2018, 200, pp.5-15. �10.1016/j.imlet.2018.06.002�. �hal-01823695�
Conformational changes in antibody Fab fragments
upon binding and their consequences on the performance
of docking algorithms
Amélie Barozeta,b,*, Marc Bianciottob, Thierry Siméona, Hervé Minouxb,
Juan Cortésa,*
aLAAS-CNRS, Université de Toulouse, CNRS, 31400, France
bSanofi-aventis recherche et développement, Integrated Drug Discovery, Molecular Design
Sciences, 13, quai Jules Guesde, BP 14, 94403 Vitry-sur-Seine Cedex – France *Corresponding authors:
Amélie Barozet
[email protected], +33 5 61 33 68 99
LAAS-CNRS, 7 avenue Du Colonel Roche, 31400 Toulouse Juan Cortés
[email protected], +33 5 61 33 63 45
LAAS-CNRS, 7 avenue Du Colonel Roche, 31400 Toulouse
Abstract
Background
The existence of conformational changes in antibodies upon binding has been previously established. However, existing analyses focus on individual cases and no quantitative study provides a more global view of potential moves and repacking, especially on recent data. The present study focuses on analyzing the conformational changes in various antibodies upon binding, providing quantitative observations to be exploited for antibody-related modeling.
Methods
Cartesian and dihedral Root-Mean-Squared Deviations were calculated for different subparts of 27 different antibodies, for which X-ray structures in the bound and unbound states are available. Elbow angle variations were also calculated. Previously reported results of four docking algorithms were condensed into one score giving overall docking success for each of 16 antibody-antigen cases.
Results
Very diverse movements are observed upon binding. While many loops stay very rigid, several others display side-chain repacking or backbone rearrangements, or both, at many different levels. Large conformational changes restricted to one or more antibody hypervariable loops were found to be a better indicator of docking difficulty than overall conformational variation at the antibody-antigen interface. However, the failure of docking algorithms on some almost-rigid cases shows that scoring is still a major bottleneck in docking pose prediction.
Conclusions
This study is aimed to help scientists working on antibody analysis and design by giving insights into the nature and the extent of conformational changes at different levels upon antigen binding.
Graphical Abstract
Keywords
antibody conformational changes; Complementarity Determining Regions; computational docking; antibody-antigen binding
Abbreviations
CDR, Complementaritydetermining region; Fab, Fragment antigenbinding; Fc, Fragment crystallizable; FR, Framework Region; Fv, Fragment variable; RMSD, RootMeanSquare deviation.
1. Introduction
Antibodies play a crucial role in the immune system by identifying and neutralizing pathogenic molecules. This function is permitted by their variability that enables them to bind virtually any protein target with high affinity and specificity. This feature led pharmaceutical companies to develop therapeutic monoclonal antibodies. Antibody design is aimed at finding the optimal sequence for an antibody against a specific target, given a variety of constraints, including e.g. affinity, specificity and druggability. Understanding how antibodies interact with their antigen counterparts is therefore of paramount importance. In particular, predicting the structure of the antibody-antigen complex would provide very valuable information about their interaction and would facilitate affinity optimization and antibody design against a given
antigen. However, although great progress has been made in the prediction of the binding mode of two proteins, computational docking remains an open problem [1], due in particular to the conformational changes happening upon binding [2, 3]. Indeed, the CAPRI challenge [4] showed that, overall, docking algorithms perform better on targets for which the structures of the bound proteins are directly provided or when variations between bound and unbound structures are limited [5, 6].
Flexibility has been reported to play a role in antibody cross-reactivity by enabling them to recognize several unrelated antigens [7]. In particular, studies show that for germline antibodies, sequences of one specific loop located in the binding site are optimized for flexibility [8]. Conformational changes may therefore be expected to happen upon antibody-antigen binding.
The present analysis focuses on the conformational changes happening in the Fab (Fragment, antigen-binding) region of antibodies. Since it binds the antigen directly, conformational changes can be very large in this region, given the inherent flexibility of the antigen-binding domain, also called paratope. However, one should keep in mind that conformational changes may also be observed in the rest of the antibody upon binding. A description of antibody structure is provided in the next section.
Conformational changes are often analyzed on a case by case basis, when the structures of both the complexed and unbound forms of an antibody become available. Sela-Culang and co-workers [9] analyzed conformational changes upon antibody-antigen binding in a large dataset of 49 different antibodies. Their analysis focuses on significant conformational changes over all antibodies. The present work, however, focuses on the nature of the different movements that can be observed, even when those are only shown by a few antibodies in our dataset. The prime goal of our analysis is to gather quantitative information about conformational changes for a relatively large number of cases, providing a basis for estimating the expected amplitude of the different possible rearrangements and for defining the overall range of conformational changes.
The recently updated protein-protein docking benchmark [3] provides structures for both complexed and free proteins. This dataset contains 40 antibody-antigen systems, 12 of which do not contain a structure for the unbound antibody. One of the remaining cases contained an unusual heavy chain IgNAR shark antibody, and was excluded from our study. The remaining 27 antibody-antigen complexes were used for this study. The structures of bound and unbound antibodies were compared using root-mean-square deviations (RMSDs) of atom positions and of dihedral angles calculated for different subparts of the Fab fragments. Vreven and co-workers [3] also tested four docking algorithms on the newly added cases of their benchmark. The data concerning antibody-antigen complexes presented in this recent study is further analyzed here aiming to better characterize conformational changes, as well as their effects on the performance of current docking prediction algorithms.
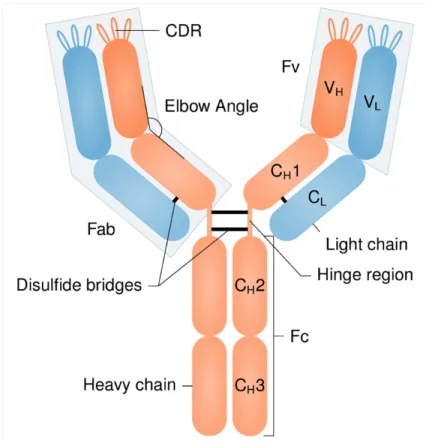
2. Antibody structure and types of conformational
changes
An antibody is a protein formed by the association of two identical heavy chains and two identical light chains. A heavy chain is composed of a variable domain VH and several constant
domains (CH1, CH2 …), while a light chain is composed of a variable domain VL and only one
constant domain CL. Heavy and light chains are assembled so that the antibody adopts a
symmetrical 'Y' topology (Fig. 1). Each arm of this 'Y' consists of two variable domains (VH and
VL) and two constant domains (CH1 and CL), while the base of the 'Y' contains the other
constant domains from the two heavy chains.
The base of the 'Y' is the crystallizable fragment (Fc) and is responsible for the activation of the immune response. The arms of the 'Y' are the antigen-binding fragments (Fab fragments). Their tips, composed of the two variable domains, are called the variable fragments (Fv) and are the regions that directly interact with the antigen. VH and VL both contain three
hypervariable loops (H1, H2, H3 for VH and L1, L2, L3 for VL) that play a crucial role in antigen
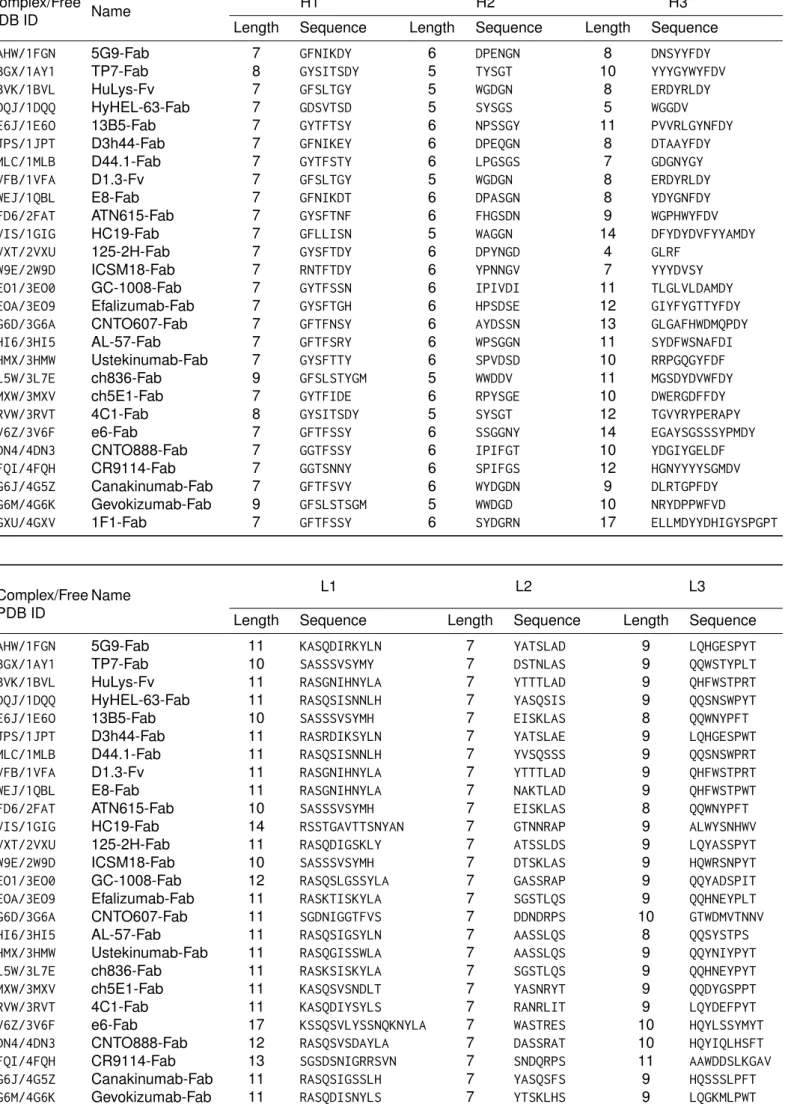
binding. They are called the complementarity-determining regions (CDRs). The lengths and the sequences of the CDRs are very variable. Table S1 reports the information for the antibodies considered in this study. The regions of Fv that are outside the CDRs are called Framework Regions (Frs).
Wilson and Stanfield reviewed the conformational changes that could be observed in Fab fragments upon antigen binding [10, 11], based on the limited data available at the time. At the Fab level, the main conformational changes include: side-chain repacking [12] (especially in CDRs), loop movements in hypervariable loops [13], orientation change between Fv and the constant region formed by CH1 [14] (the elbow angle), and repacking between heavy and light
chains [15].
3. Material and Methods
3.1 Structural analysis
3.1.1 Antibodies
The protein-protein docking benchmark version 5.0 [3] contains 28 antibody-antigen cases with both the unbound and bound structures available for the antibody. We excluded the antibody from PDB entry 2I25 (New antigen Receptor PBLA8), a shark single-domain (IgNAR) antibody, from our study due to its major structural differences with ‘conventional’ antibodies.
The structural files for the remaining 27 antibodies (Table 1) were renumbered with the Martin (enhanced Chothia) scheme, using the ANARCI [16] software and custom scripts. These files do not contain hydrogen atoms. RMSD calculations as well as alignments were therefore performed on heavy atoms only.
For each antibody, the Fv fragments of the bound and unbound domains were structurally aligned on all heavy atoms using the ‘align’ method from PyMOL [17], with default parameters. It may be argued that FR alignment would provide a better alignment of structures, since CDRs are known to be more flexible. However, aligning on Fv provides an equal treatment of FR and CDRs, allowing the comparison of FR and CDRs RMSDs. In addition, PyMOL 'align' method with default parameters contains 5 cycles of outlier rejection. Therefore, CDR loops displaying large movements should not influence the alignment of Fv domains. Comparison of FR Cartesian RMSD after FR or Fv alignment showed that aligning on Fv rather than FR provides the same quality of alignment on FR in practice (Table S2).
Custom python scripts and PyMOL were then used to calculate RMSDs of atom positions between the bound and unbound structures. Initially, the RMSDs were calculated on backbone atoms (C, Cα, N and O) for different subparts of the antibody: FRs, H1, H2, H3, L1, L2 and L3,
while keeping the Fv fragments aligned between the bound and unbound structures. This RMSD was meant as a measure of whole loop movements.
Then, for each CDR, a new alignment was performed between the bound and unbound loops’ backbones and Cartesian RMSD of side-chain atoms only was calculated. The same operation was done for FRs (the alignment was performed on backbone atoms of residues within FRs). This RMSD was meant as a measure of whole side-chain movements.
Angular RMSDs were also calculated for each subpart of each antibody, on backbone dihedral angles (Φ, Ψ and ω) [18] on the one hand, and on side-chain dihedrals on the other. These values were meant as a measure of internal conformational change, for the side-chains and for the backbone.
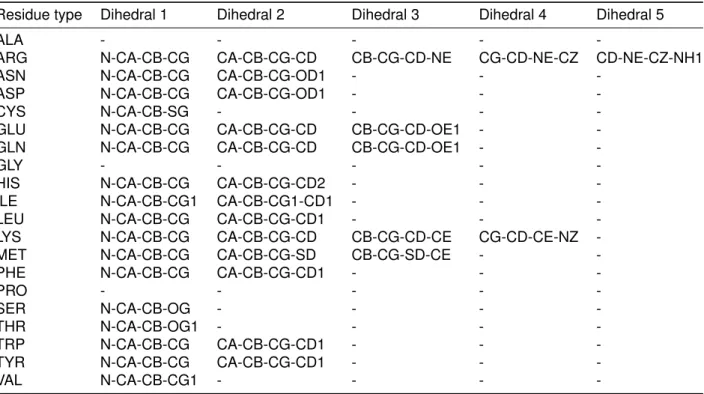
Table S3 gives the list of dihedral angles involved in the calculation of side-chain angular RMSD per residue type.
The distance between two angles was taken as the shortest distances on the trigonometric circle. While the definition of RMSD on backbone dihedrals is straightforward, the RMSD on side-chain dihedrals demands some clarification. In this study, the side-chain angular RMSD of a subpart is defined as the average of its side-chains’ individual dihedral RMSDs. i.e., with
RMSD of subpart X , NX the number of side-chains in X , nx, i the number of dihedrals of the i -th subchain of subpart X , χX ,i , j ,c the j -th dihedral of the i -th subchain of subpart X in conformation c ( c=u for the unbound conformation, c=b
for the bound conformation), we have:
RX= 1 NX
∑
i=1 NX(
∑
j=1 nX ,i d(
χX , i , j , u, χX ,i , j ,b)
2 nX , i)
1/ 2Note that glycine, alanine and proline amino acids were excluded from the calculation, and that the deviation of the last dihedral of arginine, phenylalanine, tyrosine, aspartic acid and glutamic acid residues were taken to be between 0 and 90 degrees due to the invariability of these side-chains following a 180° rotation of their last dihedral. To perform those calculations, an in-house C++ software was used.
Except for 1BVK and 1VFB, which only contain the Fv fragment of the antibody, the variations of elbow angle between the bound and unbound conformations were calculated using the web tool developed by Stanfield and co-workers [19].
3.1.2 Antigens
Cartesian RMSDs were also calculated on the antigen side. Bound and unbound antigens were aligned on their interface. Cartesian RMSD (calculated both on backbone atoms only and on all atoms) were calculated and are reported in supplementary material (Table S4) both for the antigen interface and for the whole antigen. Since the present work focuses on conformational changes of antibodies, these values are only provided as complementary information, and are not further analyzed.
3.1.3 Contacts
Contacts between antibody and antigen were taken as pairs of residues ( r1 , r2 ) so that
r1 belongs to the antibody, r2 belongs to the antigen and there exists one atom a1 from
r1 and one atom a2 from r2 so that the distance between a1 and a2 is less than 5
Å. The interface is then defined as the set of residues that are involved in at least one contacting pair. Attractive electrostatic contacts were taken as contacts between arginine or lysine on the one hand and aspartic or glutamic acid on the other. Repulsive contacts were taken as contacts pairs involving either arginines and lysines only or aspartic and glutamic acids only.
3.2 Docking algorithms
Vreven and co-workers report the results of four docking algorithms on all new cases of the protein-protein docking benchmark version 5 [3]. This concerns 16 antibodies of our dataset. They report the presence of high, medium or acceptable quality solutions (according to CAPRI’s criteria) among the top 1, 5, 10, 50 and 100 predictions as ranked by the scoring function for each of the four docking algorithms (SwarmDock [20, 21], PyDock [22], ZDOCK [23,24] and HADDOCK [25]). For one target, we define Sx, A as the score associated with the top x predictions of algorithm A , Tx , A . Sx, A is 3 if Tx , A contains at least one high quality prediction, 2 if Tx , A contains no high quality prediction but at least one medium
quality prediction , 1 if Tx , A contains no high or medium quality prediction but at least one acceptable prediction, 0 otherwise. We then define the score PA related to the performance of algorithm A on this docking target:
PA=
S100, A+4 ×
(
S50, A+4 ×(
S10, A+4 ×(
S5, A+4 × S1, A)
)
)
4 +42+43+44+45The docking success score is then taken as the average of the score of the 4 algorithms. It is a value between 0 and 1, with 0 describing a failure of all 4 docking algorithms, without any acceptable solution in the top 100 predictions, and 1 describing a situation where the top prediction for all 4 algorithms is of high quality.
4. Results and Discussion
Conformational changes upon antigen binding were analyzed in 27 antibodies. Table 1 lists all antibodies and gives a short summary of the main changes for each of them. Note that given the difference in the experimental conditions that were employed to obtain the structures, conformational changes are not necessarily all due to antigen binding. Some of them may be a result of the change in pH conditions, or an effect of crystal packing for example. Despite these other possible sources of conformational changes, the analysis performed in this section is accurate and meaningful. It provides an overview of the potential conformational changes in antibodies and their order of magnitude, which can be very helpful for antibody modeling from partial or inaccurate experimental data.
Although this work focuses on antibody conformational changes, Cartesian RMSD were also calculated for the antigen and are reported in supplementary material (Table S4). We note that for a few antigens, large domain rearrangements happen away from the interface, leading to a large RMSD for the full antigen, while the RMSD for the interface stays low. It is the case for the antigens of 1BGX, 2FD6 and 4FQI for example. The antigen in 3G6D is the one that displays the largest conformational changes at the interface level, by far (the RMSD on backbone atoms of the interface is as high as 2.79 Å, while the second highest is 2.08 Å for the interface of the antigen in 1BGX).
4.1 Amplitude of conformational changes in antibodies
Three main types of conformational changes can be analyzed using our results: backbone movements within the Fv domain, particularly of hypervariable loops, side-chain movements in CDRs, and articulation between the variable and constant domains. Results for each individual antibody can be found in Figs. S1 and S2. Note that Cartesian RMSDs are subject to biases depending on the model used for generating the structure from X-ray crystallography’s electronic density. The results reported here are meant to be taken as general trends rather than analyses of conformational changes in individual antibody-antigen pairs.
FRs are the regions of Fv outside CDR loops. In agreement with previous work, backbone movements are found to be very limited for residues in FRs as can be observed in Fig. 2(a). The highest backbone Cartesian RMSD calculated was 1.05 Å (antibody from complex 1BGX, RMSD calculated on 688 atom pairs from 172 residue pairs). For 20 complexes out of 27, the backbone positional RMSD measured for the FRs was below 0.7 Å, indicating that Framework
Complex/Free PDB ID (resolution (Å)) Name Elbow angle variation (°) Docking score Docking success
rank Conformational changes-observations 1AHW/1FGN
(3/2.5) 5G9-Fab 2.9 NA NA Small backbone changes and shifts, internal changes in some side-chains. 1BGX/1AY1
(2.3/2.2) TP7-Fab 9.7 NA NA
Large shifts of all loops. Some backbone internal conformational changes, especially in H3, L1 and L2. Side-chains reorganized in all the loops. 1BVK/1BVL
(2.7/2.87) HuLys-Fv NA NA NA
Large shift of H2's backbone. Some internal backbone conformational changes in L3, but the loop remains globally in place. Side-chain rearrangements in L1, L3 and H3, located at the center of the binding site.
1DQJ/1DQQ
(2/1.8) HyHEL-63-Fab 0.9 NA NA
Small backbone shifts with side-chain rearrangements of H2 and H3. Limited internal conformational changes in H1.
1E6J/1E6O
(3/1.8) 13B5-Fab 0.9 NA NA Loops are slightly shifted, no major internal variation. FR does not fit very well. Some side-chains rearrangements in H3 only. 1JPS/1JPT
(1.85/1.85) D3h44-Fab 2.8 NA NA Only a few side-chains conformational changes. 1MLC/1MLB
(2.5/2.1) D44.1-Fab 5 NA NA
H2 changes conformation and shifts. The rest is stable overall. Some rearrangements in position and orientation for side-chains in L1, and a few rotamer changes in L2.
1VFB/1VFA
(1.8/1.8) D1.3-Fv NA NA NA
Only little conformational changes at the tip of the H3 loop, where some side-chains change conformations.
1WEJ/1QBL
(1.8/2.26) E8-Fab 6.7 NA NA Only side-chains conformational changes in L1 and H2. 2FD6/2FAT
(1.9/1.77) ATN615-Fab 5.1 NA NA
Internal conformational changes with side-chain rearrangements for H2. No global move.
2VIS/1GIG
(3.25/2.3 ) HC19-Fab 48.6 NA NA
Backbone conformational changes at the tip of H3 and in L3, and in other loops, but minor. Side-chains rearrangements, especially where backbone changes conformations
2VXT/2VXU
(1.49/2.36) 125-2H-Fab 13.1 1.7E-01 4
Small internal conformational change for H3. Internal conformational change for some side-chains in L1.
2W9E/2W9D
(2.9/1.57) ICSM 18-Fab 2 4.9E-03 9
Some backbone conformational changes for H1 and H2, along with associated chains global and internal rearrangements. No global move. A few side-chains rearrangements.
3EO1/3EO0
(3.1/1.75) GC-1008-Fab 17.2 2.4E-03 11
Backbone internal conformational changes in all loops, slight for some. Global move of H1 but not of other loops. H1 side-chains are completely rearranged. H2 and L1 chains also move following the movement of the backbone. The side-chains in L2 change their internal conformation.
3EOA/3EO9
(2.8/1.8) Efalizumab-Fab 49.1 2.4E-04 14 Small internal backbone changes without global movement at the tip of the H3 loop. The side-chains in L1 and in the region of the tip of H3 are rearranged. 3G6D/3G6A
(3.2/2.1) CNTO607-Fab 67.9 1.5E-03 12
Very small shifts everywhere. Some minor conformational changes in H3 with some side-chains displacements and conformational changes.
3HI6/3HI5
(2.3/2.5) AL-57-Fab 22.8 1.2E-03 13
Large conformational changes in the backbone of H3, along with a large move. Side-chains in and surrounding H3 are completely rearranged.
3HMX/3HMW
(3/3) Ustekinumab-Fab 29.4 2.5E-01 3
Some limited conformational changes for H2. Small shifts of backbones, especially for loops in the heavy chain. Some side-chains in H2 and L2 change
conformations. 3L5W/3L7E
(2/2.5) ch836-Fab 9.3 1.1E-02 8
Small backbone shifts for all loops, especially those in the heavy chain. Some side-chains movements are observed at the tip of H3.
3MXW/3MXV
(1.83/1.9) ch5E1-Fab 8.4 4.0E-01 1
All 3 heavy chain hypervariable loops are slightly shifted but their conformations remain stable. Some side-chain rearrangements at the tip of H3.
3RVW/3RVT
(1.95/2.05) 4C1-Fab 2.5 2.4E-03 10
Heavy chain hypervariable loops are slightly shifted, but all loops keep their overall conformations. A few side-chains rearrangements, especially in H3 and L2. 3V6Z/3V6F
(3.34/2.52) e6-Fab 2.1 0 16
Large conformational changes in the backbone of H3 and L3, that both move. L1 shifts. Big side-chains conformational changes in H3 and L3, and some rearrangements in the tip of L1 and in L2.
4DN4/4DN3
(2.8/2.6) CNTO 888-Fab 28.8 4.9E-02 6
Some limited internal backbone changes for H1 and L1, along with a shift for H1. H2 shifts as well, but its internal structure is globally maintained. Side-chains are rearranged everywhere except in H3.
4FQI/4FQH
(1.71/2.05) CR9114-Fab 26.8 2.4E-02 7
Move of H2 loop, along with small internal changes. H3 is shifted as well, but only a subpart. Conformational changes for the side-chains in H3 and H2, and also for side-chains in L2. Some other side-chain rearrangements.
4G6J/4G5Z
(2.03/1.83) Canakinumab-Fab 25.5 1.3E-01 5
Stable backbone conformation of all loops. Some minor changes but the overall conformations are maintained. H2 shows some side-chain rearrangements. 4G6M/4G6K
(1.81/1.9) Gevokizumab-Fab 2.2 3.4E-01 2 The backbone of H1 shifts slightly. 4GXU/4GXV
(3.29/1.45) 1F1-Fab 26 0 15
Some limited backbone changes for L3 and at the tip of H3. Loops very slightly shifted. In H3 and L3, side-chains move with the backbone but keep their internal conformation. Some changes in conformations for the side-chains of L2.
Table 1: List of the antibodies used in this study. The docking score is defined in the methods section, and the
Regions have a very stable structure. Notwithstanding, the median of backbone dihedral RMSDs for FRs is high compared with the medians of backbone dihedral RMSDs in each CDR
Fig. 2: RMSDs and elbow angle distributions. (a) Boxplot of RMSDs on backbone atom positions. (b)
Boxplot of backbone dihedral RMSDs. (c) Boxplot of RMSDs on side-chain atom positions. (d) Boxplot of side-chain dihedral RMSDs. (e) Elbow angle distribution.
loop (Fig. 2(b)). The dihedrals in FRs might be less restricted than those in short loops since they do not have to satisfy loop closure constraints, or this might be an artifact of the method used for obtaining the atom coordinates from electron density. Nevertheless, FRs present almost no outlier for backbone dihedral RMSDs: all values are below 20° except for the antibodies in 1BVK and 1BGX, with values of 23.8° and 26.9°, respectively. The dihedral changes in the backbone of FRs thus remain limited. Taken together, these observations suggest that FRs dihedrals are flexible but compensate each other so that FRs keep their overall structure with very limited changes in atom positions.
Many loops show no backbone movement between their bound and unbound conformations, with very low atomic and dihedral RMSDs. It is the case for instance of the L1 loop of 4G6M (Fig. 3(a)). Other loops show large backbone conformational changes upon binding. Disparities between atomic and dihedral RMSDs distributions for CDRs indicate that loop movements can be decomposed into internal conformational changes and global shifts. The former are responsible for the shape of the loops, while the latter correspond to a displacement of the loop in 3D space. Some loops such as the H1 loop of antibody in 3EO1 (Fig. 3(d)) combine both movements. Other loops such as the H2 loop of antibody in 2FD6 (Fig. 3(b)) change their conformation while retaining their overall position. Finally, a few loops such as the H2 loop of the antibody in 1BVK (Fig. 3(c)) shift but keep their internal shape.
Hypervariable loops were found to be more flexible than FRs upon binding. More than half the complexes (14) have at least one CDR with a backbone Cartesian RMSD larger than 1 Å. Overall, hypervariable loops in the heavy chain were found to be more flexible than those in the light chain. No L1 or L2 and only one L3 loop exhibit a backbone positional RMSD larger than 2 Å, while 2 H1, 2 H2 and 3 H3 loops do. The largest loop motion is observed in the H1 loop of the antibody in the complex 3EO1 (Figs. 3(d), 4(e)). The loop’s backbone Cartesian RMSD is 4.65 Å and corresponds to a large loop rearrangement.
Distributions of backbone dihedral RMSDs for each CDR show two or more peaks: one major peak centered below 10° and one or more smaller peaks for higher dihedral RMSD values (Fig. S3). This multimodal distribution may come from loop closure constraint: variation
Fig. 3: Different types of backbone movements of hypervariable loops upon binding. The bound
antibody is represented in blue, the unbound antibody in red. The loop under focus is in a ball and stick representation. (a) Stable backbone for the L1 loop of 4G6M antibody. (b) Local movements of the loop backbone for the H2 loop of 2FD6 antibody. (c) Global backbone movement with stable internal conformation for the H2 loop of 1BVK antibody. (d) Local and global backbone movements for the H1 loop of 3EO1 antibody.
of one dihedral angle causes the other dihedrals to vary in order to keep satisfying loop closure. Therefore, either the loop presents very little dihedral changes, or it has a high dihedral RMSD. Large dihedral RMSD is not always correlated with high Cartesian RMSD, as we can see for the L3 loop of 2VIS. A pair of dihedral angles may compensate each other and leave a small local change if the residues they are found in are close to one another in the loop.
Most CDR loops maintain their unbound conformation, yet contrary to FRs, CDRs backbone dihedral RMSDs show a few high outliers, suggesting major internal conformational changes in some loops. L1, L2, L3, H1 and H2 loops have been shown to adopt canonical conformations, determined by their length and sequence [26, 27, 28, 29]. Our results show that a few of these loops display large conformational changes upon binding, and therefore do not seem to adopt canonical conformations. Even though this is only a minority in our dataset, and canonical structures show remarkable accuracy for most loops, these cases expose the limits of the reliability of predictions based on canonical conformations. Appendix A from Supplementary material details the analysis we performed on canonical loop assignment and proximity to class representative for the CDR loops in our dataset.
H3 is known to be the most variable loop in antibodies, in terms of length, sequence and conformation. This makes it difficult to predict its structure. The distributions of positional and angular RMSDs for H3 do show some variability, but are similar to those of the H2 loop in our dataset. However, these results may not be comparable due to the length difference between the two loops, H3 being on average much longer than H2 (on our antibody set, the average lengths in residues are 10.0 and 5.7 for H3 and H2, respectively).
We analyzed further one of the most striking cases of non-H3 loop movement: the conformational change of H1 loop in 3EO1. Analysis of the antigen interface in the vicinity of H1 shows a hydrophobic patch constituted of two leucine residues (LEU-28 and LEU-64), one glycine (GLY-29) and two tryptophan residues (TRP-30 and TRP-32) (Fig. S4(a)). Upon binding, H1 moves and changes its conformation to cover this hydrophobic patch (Fig. S4(b) (c)). Aligning the unbound antibody to its bound position against the antigen leaves a cavity against this patch (Fig. S4 (d)-(f)). This cavity is filled by H1 in the complex. Global and local conformational changes allow H1 to be closer to the patch and to fill the cavity (Fig S4 (g)-(i)). The local conformational changes also bury the hydrophobic PHE-29 of H1. All these conformational changes contribute to limiting the hydrophobic surface exposed to the solvent.
No correlation could be observed between the amplitude of a loop movement upon binding and the amount of contacts if forms with the antigen. There are loops that form very few contacts and yet display large movements (H1 loop from 4DN4 forms 1 contact - out of 42 for the whole interface- , but its backbone shows a Cartesian RMSD over 2 Å upon binding). Conversely, some loops form a large number of contacts but do not show any movement (H3 loop from 4GXU contributes to 38 contacts out of 61 for the whole interface but barely moves upon binding). A more detailed analysis is provided in Appendix B in supplementary material.
To measure the amplitude of side-chain movements, we calculated the Cartesian side-chain RMSDs of each antibody subpart after backbone alignment of this subpart in the bound and unbound conformations (Fig. 2(c)), as well as side-chain dihedral RMSDs (Fig. 2(d)). Not surprisingly, these values are larger than backbone RMSDs previously calculated, indicating that side-chain movements are larger than backbone movements.
Remarkably, FRs side-chain atomic RMSDs are very similar in all cases (they are all comprised between 0.67 Å and 1.73 Å), and relatively high compared to CDRs, whereas the inverse trend would have been intuitively expected. Visual observation of a few structures reveals that chains located within the core volume move very little, whereas surface side-chains are quite flexible, although the cause of their movement may be other than antigen binding (crystal packing effects, data quality, coexistence of alternative side-chain conformations unresolved at the resolution of the data...). Side-chain angular RMSDs for FRs also show a tight distribution compared to the side-chain angular RMSDs for CDR loops, with a median that is neither below nor above the distributions of CDR loops’. FRs side-chain conformational variations are comparable from one antibody to another, whereas CDR side-chain variations can have very different levels.
CDR side-chain Cartesian RMSDs are far more dispersed than FRs side-chain Cartesian RMSDs, but not always higher. Although positional RMSDs show higher variations for H3 side-chains, angular RMSDs suggest that H2 side-chains are more flexible. This indicates that H3 side-chains movements are mainly due to dihedral changes within the backbone, while H2 side-chains movements are also due to dihedral changes within the side-chains. Contrary to backbone Cartesian RMSDs, side-chains Cartesian RMSDs after backbone alignment do not reveal striking differences between the heavy and light chains.
We can see some correlation between backbone and side-chain atomic RMSDs after backbone alignment (Figs. S1(a) and S1(c)). More precisely, we find that when backbone Cartesian RMSD is high, side-chain Cartesian RMSD is generally also high. An obvious explanation is that large backbone rearrangements cause imperfect alignment of loop backbones, thus increasing side-chain positional RMSD after alignment. Notwithstanding, another reason could be that a displacement of the loop causes a change of environment for the side-chains, that are consequently repacked. This is confirmed by a similar yet looser correlation between backbone and side-chain angular RMSDs (Spearman correlation test gives ρ=0.46 , p-value = 1.36 ×10− 9 ), showing that large backbone rearrangements are
accompanied by side-chain repacking. This is the case e.g. for the H1 loop of the antibody in 3EO1 (Fig. 4(e)), and the L3 loop of 3V6Z (Fig. 4(f)). In the former case, the bound loop adopts a different conformation in order to fit in a cavity between the rest of the antibody and the antigen. The side-chains are then repacked to fill the cavity. In the latter case, the bound loop has to change its conformation to avoid major steric clashes with the antigen. The side-chains also have to move to avoid collisions. Both these loops adopt entirely different backbone conformations in the bound case, and the side-chains are packed to create favorable contacts with the antigen according to this new conformation, regardless of their previous positions.
However, a few antibody’s loops show relatively high backbone movement with little side-chain repacking: this is the case for the H1 loop of the antibody in 1BGX (Fig. 4(a)), whose backbone moves slightly upon binding to avoid collision with the antigen, and the H2 loop of the antibody in 1BVK (Fig. 4(b)), which gets closer to the antigen upon binding, supposedly maximizing positive contacts. These loops are only slightly shifted or displaced, and their conformation is overall maintained, which explains why most of their side-chains remain approximately in the same place.
It is also common to observe large side-chain movements with limited or no backbone rearrangement. This happens to the H3 loop of the antibody in 3L5W where the Tyr-99 moves to allow the binding of the antigen (Fig. 4(c)). Likewise, in the H3 loop of 4FQI, the Tyr-98 moves to allow the binding of the antigen, thus triggering a cascade of conformational changes for the other side-chains (Fig. 4(d)).
After the observation of the different types of loop movements illustrated by Figs. 3 and 4, we decided to classify all the loops in our dataset and assign them a “backbone” class and a
Fig. 4: Different types of backbone and side-chains movements of hypervariable loops upon binding.
The antigen is represented as a blue transparent surface. The bound antibody is represented in blue, the unbound antibody in red. The loop under focus is represented with thicker tubes and has its side-chains represented as sticks. (a)(b) Large movement of the loop backbone with limited side-chain conformational changes for the H1 loop of 1BGX antibody and the H2 loop of 1BVK antibody. (c)(d) Stable backbone with side-chain conformational changes for the H3 loop of 3L5W antibody and the H3 loop of 4FQI antibody. (e)(f) Large movements of both the backbone and the side-chains for the H1 loop of 3EO1 antibody and the L3 loop of 3V6Z antibody.
“side-chain” class, corresponding to the classes observed in the figures. The classification is reported in Table S5. Although these results give interesting insight into the number of loops representing each class, the number of complexes in our dataset is too limited to draw any final conclusion about the actual frequency of each class. However, this analysis seems to confirm the high structural variability at the interface level. Indeed, among antibodies that display conformational changes at the interface, no pattern was discernable.
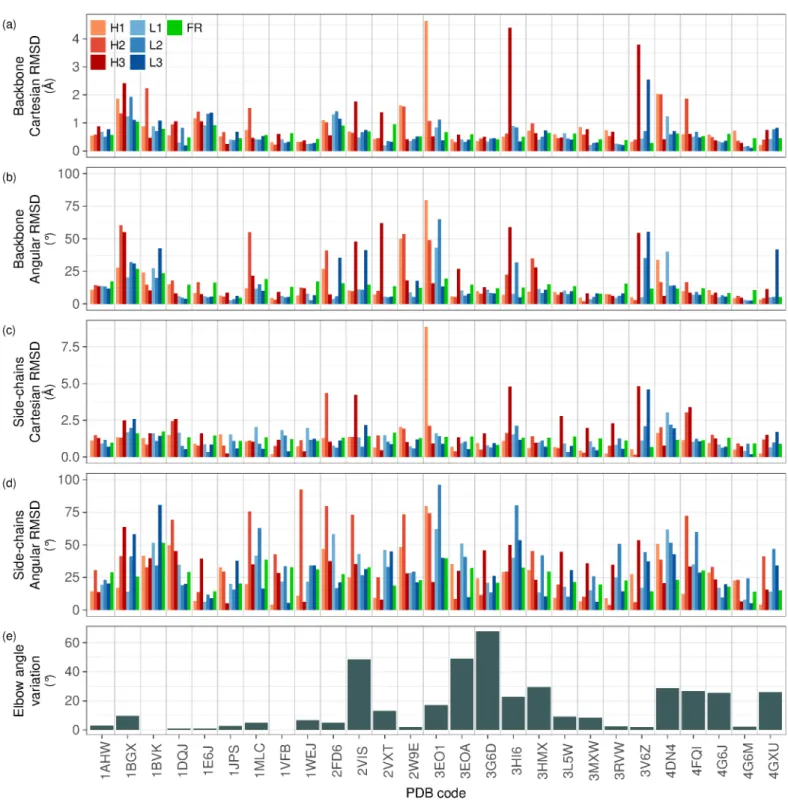
The distribution of elbow angle variations presents two major clusters: one between 1° and 11° (14 antibodies), and another between 24° and 29° (6 antibodies) (Fig. 2(e)). Therefore, although for most antibodies the elbow angle barely varies, there is still a sizable number of antibodies for which relatively large elbow angle variations occur. Only 2 antibodies show a variation of the elbow angle between 11° and 24°, and 3 above 29°. These three outliers indicate that very large variations of the elbow angle can also be observed, which should be borne in mind while building a model for a Fab structure. The largest elbow angle variation is measured for the antibody in 3G6D (67.9°). Structural alignment of the bound and free Fv showed a clear displacement of the constant domain between the two conformations.
4.2 Influence of conformational changes on docking performance
Four docking algorithms were tested on the newly added cases of the protein-protein docking benchmark version 5 [3]. From the results of these four algorithms, we derived a score describing the overall performance of docking algorithms for each case. Docking success score as well as values for conformational changes for each new antibody case in the docking benchmark version 5, are displayed on Fig. 5(a-f).
None of the four algorithms seems to perform distinctly better than the others. Each of them performs better than all others on at least one case (4DN4 for SwarmDock, 2VXT for pyDock, 3G6D for ZDOCK and 4G6J for HADDOCK), and fail in cases where others succeed. ZDOCK never performs undeniably worse than all three other algorithms: for each case, at least one of SwarmDock, pyDock and HADDOCK performs worse than ZDOCK. However, since ZDOCK rarely yields better results than all other algorithms (at least on the antibody-antigen cases we consider in this study), and since the first solution it predicts is never even acceptable, it cannot be considered to perform better overall.
Results reveal that large backbone movements in CDRs are correlated with low docking performance. Indeed, 3V6Z, 3HI6 and 3EO1 show substantial backbone movements of CDRs and docking algorithms perform badly on those cases. 2W9E, 4FQI and 4DN4 also show backbone movements in CDRs, although not as large as those three previous cases. Docking performance is increased for those cases, but remains limited. Side-chain repacking also seems to be correlated with docking difficulty. Indeed, 3L5W shows limited backbone movements but substantial side-chain repacking in H3 and the docking performance for this case is also limited. Conversely, in the five easiest cases (3MXW, 4G6M, 3HMX, 2VXT and 4G6J), only one CDR loop presents a backbone atomic RMSD of more than 1 Å (2VXT–H3, 1.38 Å), and no CDR exhibits Cartesian side-chain RMSD of more than 2 Å. Angular RMSD does not reveal such a clear correlation with docking success, suggesting that the actual displacement of atoms has a higher impact on docking algorithms efficiency than their local reorganization. However, this has to be tempered by the fact that neither backbone angular RMSDs nor side-chain angular RMSDs show any notable outlier for the best-working cases. These results suggest that conformational changes in CDRs, whether whole backbone
Fig. 5: Docking success relative to conformational changes. (a) Docking success score. (b)
Backbone Cartesian RMSDs after alignment of bound and free Fv. (c) Backbone dihedral RMSDs. (d) Side-chains Cartesian RMSDs after alignment of bound and free backbones of each antibody subpart. (e) Side-chains dihedral RMSDs. (f) Elbow angle variation between free and bound conformations. Note that a high side-chains Cartesian RMSD is expected when the backbone Cartesian RMSD is high (the backbone alignment will be bad and therefore the side-chains cannot align properly). Particular care must be taken when interpreting these values since the different measures are strongly correlated.
movements or side-chains rearrangements, are poorly handled by docking algorithms, which tend to fail when those become too large.
Nevertheless, the negative correlation between conformational changes in CDR and docking performance is far from being perfect. Indeed, 4GXU, 3EOA and 3G6D show very limited conformational changes at the binding site yet docking algorithms perform very poorly for these cases. This may be due to the large variation in the elbow angle that occurs for these three cases. Such a large conformational change, although remote from the binding site, may be important for binding. Indeed, constant regions have been shown to stabilize antibody-antigen binding, in particular during Molecular Dynamics simulations [30]. Similarly, correct modeling of the constant regions may be necessary in order to improve the accuracy of the scoring functions in docking algorithms.
Still, a large variation of the elbow angle upon binding is not necessarily a warranty of computational docking failure. Upon binding, the elbow angles of 4G6J and 3HMX vary of 26° and 29°, respectively. Despite these relatively large variations, these two cases are among the most successful for computational docking.
The poor docking performance for the case of 3RVW is harder to explain with arguments related to conformational changes. This case presents some side-chain rearrangements at the interface, in particular in the H3 loop, yet these remain limited. Conformational changes in the antigen exist but are also limited (Fig. S5). This example shows that docking remains a difficult problem, even for some almost rigid cases. In such cases, for which conformational changes are limited, sampling is generally not an issue and the difficulty more probably lies in the ability of the scoring function to determine the right pose. Although the analysis of the nature and size of the interface did not provide any interesting information that would let us hypothesize on the reason for docking prediction failure, the strength of the interaction do. Vreven and co-workers provide values of free energy and dissociation constants for all of the antibody-antigen complexes also tested for docking, except for 3EO1 and 3HMX. These values reveal that 3RVW is the complex with the second highest measured dissociation constant (after 3HI6, which displays large conformational changes at the interface). The weakness of the antibody-antigen interaction may be one reason why docking algorithms are unable to find the right docking pose.
Vreven and co-workers also assessed the expected difficulty of docking on each case based on the interface atoms RMSD and the number of non native contacts in aligned unbound structures. Of course, the result is highly correlated to the level of conformational changes at the interface, even though it is smoothed over the whole binding site. Nevertheless, separating the different components of the antibody gives a more precise insight into what actually constitutes a challenge for docking algorithms. Indeed, among the new antibody-antigen cases, none is expected to be difficult according to the classification by Vreven and co-workers yet many of them yield very poor or no results. Looking at the conformational changes of each component of the Fab fragment, we can see that a very large movement of a single CDR loop will more likely make the case difficult than a higher positional RMSD over the whole Fv fragment, even though both are obviously correlated.
Other than conformational changes at the interface (which may prevent the sampling of the right pose), the failure of some cases can be explained by the difficulty to design an accurate scoring function able to discriminate between the actual docking pose and other poses. By
focusing on the RMSD and contacts at the interface, the classification provided by Vreven and co-workers ignores changes away from the binding site (which may be important for the accuracy of scoring functions of docking algorithms).
The antibody-antigen complexes on which the four docking algorithms were tested can be divided into three classes. The “medium difficulty”cases as defined by Vreven et al., showing major conformational changes either in the antibody or the antigen (3V6Z, 3HI6, 3EO1, 3L5W), the “easy – low success” cases (easy according to the classification by Vreven and co-workers, but with poor success when tested by the docking algorithms: 4GXU, 3EOA, 3RVW, 2W9E) and the “easy – high success” cases (easy according to Vreven et al. And with high success with docking algorithms: 4FQI, 4DN4, 4G6J, 2VXT, 3HMX, 4G6M, 3MXW). When tested on “medium difficulty cases, the docking algorithms unsurprisingly fail or yield poor solutions. However, perhaps less evidently, the RMSD profiles of the “easy – low success” and the “easy – high success” are similar, and it seems that conformational changes alone cannot account for the difference in the performance of docking algorithms. Using Capri’s definition of contacts (two residues on both sides of the interface are in contact if we can find one atom belonging to the first residue and one atom belonging to the other within a distance below 5 Å), we tried to relate the docking success difference between these two categories with the contacts formed by the CDR loops. In particular, we looked at electrostatic contacts. Attractive electrostatic contacts (between arginine or lysine on the one hand and aspartic or glutamic acid on the other) greatly outnumber repulsive contacts (at least 5 more contacts) in the interface of 4 "easy - high success” cases (4DN4, 2VXT, 4G6M, 3MXW) and 2 “medium difficulty” cases (3G6D, 3L5W) but not in any “easy - low success” case. On the contrary, repulsive electrostatic contacts outnumber attractive electrostatic contacts in one “easy - low success” case, 2W9E.
These results suggest that scoring functions may rely too strongly on electrostatic interactions to determine the right pose. Indeed, when sampling does not seem to be an issue (easy cases as classified by Vreven et al. show limited conformational changes at the interface), complexes showing many more attractive than repulsive electrostatic contacts appear to be more easily predicted, suggesting that scoring functions better discriminate this type of profile. Looking at the number and nature of the residues at the interface, this constitutes the only difference we could observe between “easy low success” and “easy -high success” interfaces.
We also note that 3EOA, one of the “easy - low success” cases, exhibits a large elbow movement upon binding. When this is not predicted by the docking algorithm, this may contribute to the inaccuracy of the scoring function, even though it is not a conformational change close to the interface.
5. Conclusion
In this work, we have analyzed the conformational changes in 27 antibodies upon binding. Results show that Framework Regions are structurally stable, despite some side-chains movements on the antibody surface. More importantly, their variability is similar in the different antibodies, with very few outliers. Hypervariable loops are much more flexible overall, and much more heterogeneous. Some are extremely stable and rigid, while others display large conformational changes upon binding. Conformational changes may consist in large backbone
motions, while others may be large side-chains rearrangements. Some movements are local only, while some create a large displacement of the loop. A classification of the loop movements into classes showed that there is an even higher diversity of conformational changes at the antibody interface level: each antibody shows a different profile from any other. The limited size of the dataset did not allow us to draw any further conclusion, but extending this classification to a larger number of cases constitutes an interesting lead for future work. The orientation between the Fv and the constant domain in the Fab fragment is also very variable. A considerable number of antibodies present variations of the elbow angle larger than 25°.
Conformational changes were found to partly account for docking difficulty in most cases. Antibodies presenting large CDR loop motions or substantial side-chains rearrangements upon binding appear harder to dock, implying that changes in the topology of the binding site are a major obstruction to successful computational docking. However, conformational changes at the interface only could not explain the lack of success of some cases, suggesting that scoring remains an important issue in antibody-antigen docking. Some antibodies with rigid binding sites but large elbow angle variations yielded poor docking results, suggesting that large movements of the constant domains may hinder docking prediction in some cases, possibly through the inaccuracy of scoring functions. The nature of the antibody-antigen interface was also found to play a role in the success of docking algorithms. Interfaces with a much larger number of positive rather than negative electrostatic contacts appeared to be better predicted in the absence of large conformational changes, which suggests that scoring functions used in docking greatly focus on electrostatic contacts to assess the correctness of a pose. The improvement of antibody-antigen docking predictions will thus require the design of more accurate scoring functions that can work better when the interfaces are not of an electrostatic nature.
Acknowledgements
The authors would like to thank Dr Thomas Bertrand and Dr Anke Steinmetz for their careful critical reading of the manuscript and useful comments.
Funding sources
The French National Association of Research and Technology (ANRT) is gratefully acknowledged for supporting A.B. (contract 2016/0239).
Conflict of interest
References
[1] M. Pedotti, L. Simonelli, E. Livoti, L. Varani, Computational docking of antibody-antigen complexes, opportunities and pitfalls illustrated by influenza hemagglutinin, Int. J. Mol. Sci. 12 (2011) 226–251. doi:10.3390/ijms12010226.
[2] A.M.J.J. Bonvin, Flexible protein-protein docking, Curr. Opin. Struct. Biol. 16 (2006) 194– 200.
[3] T. Vreven, I.H. Moal, A. Vangone, B.G. Pierce, P.L. Kastritis, M. Torchala, R. Chaleil, B. Jiménez-García, P.A. Bates, J. Fernandez-Recio, A.M.J.J. Bonvin, Z. Weng, Updates to the integrated protein-protein interaction benchmarks: Docking benchmark version 5 and affinity benchmark version 2, J. Mol. Biol. 427 (2015) 3031–3041. doi:10.1016/j.jmb.2015.07.016.
[4] J. Janin, Welcome to CAPRI: A Critical Assessment of PRedicted Interactions, Proteins. 47 (2002) 257–257. doi:10.1002/prot.10111.
[5] S. Vajda, Classification of protein complexes based on docking difficulty, Proteins. 60 (2005) 176–180. doi:10.1002/prot.20554.
[6] M.F. Lensink, S.J. Wodak, Docking and scoring protein interactions: CAPRI 2009, Proteins. 78 (2010) 3073–3084. doi:10.1002/prot.22818.
[7] L.C. James, P. Roversi, D.S. Tawfik, Antibody multispecificity mediated by conformational diversity, Science. 299 (2003) 1362–1367.
[8] M. Babor, T. Kortemme, Multi-constraint computational design suggests that native sequences of germline antibody H3 loops are nearly optimal for conformational flexibility, Proteins. 75 (2009) 846–858. doi:10.1002/prot.22293.
[9] I. Sela-Culang, S. Alon, Y. Ofran, A Systematic comparison of free and bound antibodies reveals binding-related conformational changes, J. Immunol. 189 (2012) 4890–4899. doi:10.4049/jimmunol.1201493.
[10] I.A. Wilson, R.L. Stanfield, Antibody-antigen interactions, Curr. Opin. Struct. Biol. 3 (1993) 113–118.
[11] I.A. Wilson, R.L. Stanfield, Antibody-antigen interactions: new structures and new conformational changes, Curr. Opin. Struct. Biol. 4 (1994) 857–867. doi:10.1016/0959-440X(94)90267-4.
[12] Y. Li, H. Li, S.J. Smith-Gill, R.A. Mariuzza, Three-Dimensional Structures of the Free and Antigen-Bound Fab from Monoclonal Antilysozyme Antibody HyHEL-63, Biochemistry. 39 (2000) 6296–6309. doi:10.1021/bi000054l.
[13] J.M. Rini, U. Schulze-Gahmen, I.A. Wilson, Structural evidence for induced fit as a mechanism for antibody-antigen recognition, Science. 255 (1992) 959–965. doi:10.1126/science.1546293.
[14] L.W. Guddat, L. Shan, J.M. Anchin, D.S. Linthicum, A.B. Edmundson, Local and Transmitted Conformational Changes on Complexation of an Anti-sweetener Fab, J. Mol. Biol. 236 (1994) 247–274. doi:10.1006/jmbi.1994.1133.
[15] J.N. Herron, X.M. He, D.W. Ballard, P.R. Blier, P.E. Pace, A.L.M. Bothwell, E.W. Voss, A.B. Edmundson, An autoantibody to single-stranded DNA: Comparison of the three-dimensional structures of the unliganded fab and a deoxynucleotide–fab complex, Proteins. 11 (1991) 159–175. doi:10.1002/prot.340110302.
[16] J. Dunbar, C.M. Deane, ANARCI: antigen receptor numbering and receptor classification, Bioinformatics. 32 (2016) 298–300. doi:10.1093/bioinformatics/btv552.
[18] Brändén, J. Tooze, Introduction to Protein Structure, Taylor & Francis, 1999.
[19] R.L. Stanfield, A. Zemla, I.A. Wilson, B. Rupp, Antibody Elbow Angles are Influenced by their Light Chain Class, J. Mol. Biol. 357 (2006) 1566–1574. doi:10.1016/j.jmb.2006.01.023.
[20] I.H. Moal, P.A. Bates, SwarmDock and the Use of Normal Modes in Protein-Protein Docking, Int. J. Mol. Sci. 11 (2010) 3623–3648. doi:10.3390/ijms11103623.
[21] X. Li, I.H. Moal, P.A. Bates, Detection and refinement of encounter complexes for protein– protein docking: Taking account of macromolecular crowding, Proteins. 78 (2010) 3189– 3196. doi:10.1002/prot.22770.
[22] T.M.-K. Cheng, T.L. Blundell, J. Fernandez-Recio, pyDock: electrostatics and desolvation for effective scoring of rigid-body protein-protein docking, Proteins. 68 (2007) 503–515. doi:10.1002/prot.21419.
[23] R. Chen, L. Li, Z. Weng, ZDOCK: An initial-stage protein-docking algorithm, Proteins. 52 (2003) 80–87. doi:10.1002/prot.10389.
[24] R. Chen, Z. Weng, A novel shape complementarity scoring function for protein-protein docking, Proteins. 51 (2003) 397–408. doi:10.1002/prot.10334.
[25] C. Dominguez, R. Boelens, A.M.J.J. Bonvin, HADDOCK: A Protein--Protein Docking Approach Based on Biochemical or Biophysical Information, J. Am. Chem. Soc. 125 (2003) 1731–1737. doi:10.1021/ja026939x.
[26] C. Chothia, A.M. Lesk, Canonical structures for the hypervariable regions of immunoglobulins, J. Mol. Biol. 196 (1987) 901–917. doi:10.1016/0022-2836(87)90412-8. [27] C. Chothia, A.M. Lesk, A. Tramontano, M. Levitt, S.J. Smith-Gill, G. Air, S. Sheriff, E.A.
Padlan, D. Davies, W.R. Tulip, P.M. Colman, S. Spinelli, P.M. Alzari, R.J. Poljak, Conformations of immunoglobulin hypervariable regions, Nature. 342 (1989) 877–883. doi:10.1038/342877a0.
[28] B. Al-Lazikani, A.M. Lesk, C. Chothia, Standard conformations for the canonical structures of immunoglobulins, J. Mol. Biol. 273 (1997) 927–948. doi:10.1006/jmbi.1997.1354.
[29] B. North, A. Lehmann, R.L. Dunbrack, A New Clustering of Antibody CDR Loop Conformations, J. Mol. Biol. 406 (2011) 228–256. doi:10.1016/j.jmb.2010.10.030.
[30] B. Knapp, J. Dunbar, M. Alcala, C.M. Deane, Variable Regions of Antibodies and T-Cell Receptors May Not Be Sufficient in Molecular Simulations Investigating Binding, J. Chem. Theory Comput. 13 (2017) 3097–3105. doi:10.1021/acs.jctc.7b00080.
Supplementary Material for the paper
“Conformational changes in antibody Fab fragments upon binding and their
consequences on the performance of docking algorithms”
Am ´elie Barozet, Marc Bianciotto, Thierry Sim ´eon, Herv ´e Minoux, Juan Cort ´es
Figure S1: Conformational changes. (a) Backbone Cartesian RMSDs after alignment of bound and free Fv. (b) Backbone
dihedral RMSDs. (c) Side-chains Cartesian RMSDs after alignment of bound and free backbones of each antibody subpart. (d) Side-chains dihedral RMSDs. (e) Elbow angle variation between free and bound conformations.
Figure S2: Conformational changes for Fv as a whole, for FR and for the CDRs in concert. (a) Backbone Cartesian RMSDs
after alignment of bound and free Fv. (b) Backbone dihedral RMSDs. (c) Side-chains Cartesian RMSDs after alignment of bound and free backbones of each antibody subpart. (d) Side-chains dihedral RMSDs.
Table S1: Lengths and sequences of CDR loops as defined using enhanced Chothia numbering scheme.
Complex/Free PDB ID Name
H1 H2 H3
Length Sequence Length Sequence Length Sequence
1AHW/1FGN 5G9-Fab 7 GFNIKDY 6 DPENGN 8 DNSYYFDY
1BGX/1AY1 TP7-Fab 8 GYSITSDY 5 TYSGT 10 YYYGYWYFDV
1BVK/1BVL HuLys-Fv 7 GFSLTGY 5 WGDGN 8 ERDYRLDY
1DQJ/1DQQ HyHEL-63-Fab 7 GDSVTSD 5 SYSGS 5 WGGDV 1E6J/1E6O 13B5-Fab 7 GYTFTSY 6 NPSSGY 11 PVVRLGYNFDY 1JPS/1JPT D3h44-Fab 7 GFNIKEY 6 DPEQGN 8 DTAAYFDY
1MLC/1MLB D44.1-Fab 7 GYTFSTY 6 LPGSGS 7 GDGNYGY
1VFB/1VFA D1.3-Fv 7 GFSLTGY 5 WGDGN 8 ERDYRLDY
1WEJ/1QBL E8-Fab 7 GFNIKDT 6 DPASGN 8 YDYGNFDY
2FD6/2FAT ATN615-Fab 7 GYSFTNF 6 FHGSDN 9 WGPHWYFDV 2VIS/1GIG HC19-Fab 7 GFLLISN 5 WAGGN 14 DFYDYDVFYYAMDY
2VXT/2VXU 125-2H-Fab 7 GYSFTDY 6 DPYNGD 4 GLRF
2W9E/2W9D ICSM18-Fab 7 RNTFTDY 6 YPNNGV 7 YYYDVSY 3EO1/3EO0 GC-1008-Fab 7 GYTFSSN 6 IPIVDI 11 TLGLVLDAMDY 3EOA/3EO9 Efalizumab-Fab 7 GYSFTGH 6 HPSDSE 12 GIYFYGTTYFDY 3G6D/3G6A CNTO607-Fab 7 GFTFNSY 6 AYDSSN 13 GLGAFHWDMQPDY 3HI6/3HI5 AL-57-Fab 7 GFTFSRY 6 WPSGGN 11 SYDFWSNAFDI 3HMX/3HMW Ustekinumab-Fab 7 GYSFTTY 6 SPVDSD 10 RRPGQGYFDF 3L5W/3L7E ch836-Fab 9 GFSLSTYGM 5 WWDDV 11 MGSDYDVWFDY 3MXW/3MXV ch5E1-Fab 7 GYTFIDE 6 RPYSGE 10 DWERGDFFDY 3RVW/3RVT 4C1-Fab 8 GYSITSDY 5 SYSGT 12 TGVYRYPERAPY 3V6Z/3V6F e6-Fab 7 GFTFSSY 6 SSGGNY 14 EGAYSGSSSYPMDY 4DN4/4DN3 CNTO888-Fab 7 GGTFSSY 6 IPIFGT 10 YDGIYGELDF 4FQI/4FQH CR9114-Fab 7 GGTSNNY 6 SPIFGS 12 HGNYYYYSGMDV 4G6J/4G5Z Canakinumab-Fab 7 GFTFSVY 6 WYDGDN 9 DLRTGPFDY 4G6M/4G6K Gevokizumab-Fab 9 GFSLSTSGM 5 WWDGD 10 NRYDPPWFVD
4GXU/4GXV 1F1-Fab 7 GFTFSSY 6 SYDGRN 17 ELLMDYYDHIGYSPGPT
Complex/Free PDB ID
Name L1 L2 L3
Length Sequence Length Sequence Length Sequence 1AHW/1FGN 5G9-Fab 11 KASQDIRKYLN 7 YATSLAD 9 LQHGESPYT 1BGX/1AY1 TP7-Fab 10 SASSSVSYMY 7 DSTNLAS 9 QQWSTYPLT 1BVK/1BVL HuLys-Fv 11 RASGNIHNYLA 7 YTTTLAD 9 QHFWSTPRT 1DQJ/1DQQ HyHEL-63-Fab 11 RASQSISNNLH 7 YASQSIS 9 QQSNSWPYT 1E6J/1E6O 13B5-Fab 10 SASSSVSYMH 7 EISKLAS 8 QQWNYPFT 1JPS/1JPT D3h44-Fab 11 RASRDIKSYLN 7 YATSLAE 9 LQHGESPWT 1MLC/1MLB D44.1-Fab 11 RASQSISNNLH 7 YVSQSSS 9 QQSNSWPRT 1VFB/1VFA D1.3-Fv 11 RASGNIHNYLA 7 YTTTLAD 9 QHFWSTPRT 1WEJ/1QBL E8-Fab 11 RASGNIHNYLA 7 NAKTLAD 9 QHFWSTPWT 2FD6/2FAT ATN615-Fab 10 SASSSVSYMH 7 EISKLAS 8 QQWNYPFT 2VIS/1GIG HC19-Fab 14 RSSTGAVTTSNYAN 7 GTNNRAP 9 ALWYSNHWV 2VXT/2VXU 125-2H-Fab 11 RASQDIGSKLY 7 ATSSLDS 9 LQYASSPYT 2W9E/2W9D ICSM18-Fab 10 SASSSVSYMH 7 DTSKLAS 9 HQWRSNPYT 3EO1/3EO0 GC-1008-Fab 12 RASQSLGSSYLA 7 GASSRAP 9 QQYADSPIT 3EOA/3EO9 Efalizumab-Fab 11 RASKTISKYLA 7 SGSTLQS 9 QQHNEYPLT 3G6D/3G6A CNTO607-Fab 11 SGDNIGGTFVS 7 DDNDRPS 10 GTWDMVTNNV 3HI6/3HI5 AL-57-Fab 11 RASQSIGSYLN 7 AASSLQS 8 QQSYSTPS 3HMX/3HMW Ustekinumab-Fab 11 RASQGISSWLA 7 AASSLQS 9 QQYNIYPYT 3L5W/3L7E ch836-Fab 11 RASKSISKYLA 7 SGSTLQS 9 QQHNEYPYT 3MXW/3MXV ch5E1-Fab 11 KASQSVSNDLT 7 YASNRYT 9 QQDYGSPPT 3RVW/3RVT 4C1-Fab 11 KASQDIYSYLS 7 RANRLIT 9 LQYDEFPYT 3V6Z/3V6F e6-Fab 17 KSSQSVLYSSNQKNYLA 7 WASTRES 10 HQYLSSYMYT 4DN4/4DN3 CNTO888-Fab 12 RASQSVSDAYLA 7 DASSRAT 10 HQYIQLHSFT 4FQI/4FQH CR9114-Fab 13 SGSDSNIGRRSVN 7 SNDQRPS 11 AAWDDSLKGAV 4G6J/4G5Z Canakinumab-Fab 11 RASQSIGSSLH 7 YASQSFS 9 HQSSSLPFT 4G6M/4G6K Gevokizumab-Fab 11 RASQDISNYLS 7 YTSKLHS 9 LQGKMLPWT 4GXU/4GXV 1F1-Fab 13 SGSSSNIGSYTVN 7 SLNQRPS 12 AAWDDSLSAHVV
Table S2: Comparison of alignments on Fv or FR on FR all-atom Cartesian RMSD. The alignments were performed using
PyMOL ”align” method with default parameters (5 cycles of outlier rejection). The alignments do not show substantial differences: the differences in RMSD are below the precision level that can be expected from the measure of atomic positions. The difference in alignments is therefore negligible.
PDB All-atom FR RMSD ( ˚A) Variation ( ˚A) Absolute variation ( ˚A) After FR alignment After Fv alignement
1AHW 0.79715 0.79660 -5.50E-04 5.50E-04
1BGX 1.34271 1.34351 7.98E-04 7.98E-04
1BVK 1.31529 1.31789 2.59E-03 2.59E-03
1DQJ 0.99034 0.99185 1.52E-03 1.52E-03
1E6J 1.19938 1.20381 4.43E-03 4.43E-03
1JPS 0.82862 0.82899 3.75E-04 3.75E-04
1MLC 1.02216 1.02450 2.33E-03 2.33E-03
1VFB 0.95838 0.95918 8.06E-04 8.06E-04
1WEJ 0.80961 0.81012 5.02E-04 5.02E-04
2FD6 1.10940 1.10769 -1.71E-03 1.71E-03
2VIS 1.09164 1.09842 6.78E-03 6.78E-03
2VXT 1.34265 1.34376 1.11E-03 1.11E-03
2W9E 0.95412 0.95695 2.83E-03 2.83E-03
3EO1 1.05729 1.05803 7.44E-04 7.44E-04
3EOA 1.06013 1.06054 4.11E-04 4.11E-04
3G6D 0.63604 0.63751 1.47E-03 1.47E-03
3HI6 0.98537 0.98769 2.31E-03 2.31E-03
3HMX 1.01561 1.02857 1.30E-02 1.30E-02 3L5W 1.05444 1.05427 -1.71E-04 1.71E-04 3MXW 0.92467 0.92543 7.52E-04 7.52E-04 3RVW 0.82847 0.82700 -1.47E-03 1.47E-03 3V6Z 0.50735 0.50718 -1.77E-04 1.77E-04 4DN4 0.91967 0.92114 1.47E-03 1.47E-03
4FQI 0.86853 0.87946 1.09E-02 1.09E-02
4G6J 1.01086 1.01155 6.88E-04 6.88E-04
4G6M 0.71789 0.71548 -2.41E-03 2.41E-03
4GXU 0.69689 0.69807 1.18E-03 1.18E-03
Min 0.50735 0.50718 -2.41E-03 1.71E-04
Max 1.34271 1.34376 1.30E-02 1.30E-02
Mean 0.96462 0.96649 1.87E-03 2.35E-03
Median 0.98537 0.98769 8.06E-04 1.47E-03
Table S3: Dihedrals used per residue type for side-chain angular RMSD calculations.
Residue type Dihedral 1 Dihedral 2 Dihedral 3 Dihedral 4 Dihedral 5
ALA - - - -
-ARG N-CA-CB-CG CA-CB-CG-CD CB-CG-CD-NE CG-CD-NE-CZ CD-NE-CZ-NH1
ASN N-CA-CB-CG CA-CB-CG-OD1 - -
-ASP N-CA-CB-CG CA-CB-CG-OD1 - -
-CYS N-CA-CB-SG - - -
-GLU N-CA-CB-CG CA-CB-CG-CD CB-CG-CD-OE1 - -GLN N-CA-CB-CG CA-CB-CG-CD CB-CG-CD-OE1 -
-GLY - - - -
-HIS N-CA-CB-CG CA-CB-CG-CD2 - -
-ILE N-CA-CB-CG1 CA-CB-CG1-CD1 - -
-LEU N-CA-CB-CG CA-CB-CG-CD1 - -
-LYS N-CA-CB-CG CA-CB-CG-CD CB-CG-CD-CE CG-CD-CE-NZ -MET N-CA-CB-CG CA-CB-CG-SD CB-CG-SD-CE -
-PHE N-CA-CB-CG CA-CB-CG-CD1 - -
-PRO - - - -
-SER N-CA-CB-OG - - -
-THR N-CA-CB-OG1 - - -
-TRP N-CA-CB-CG CA-CB-CG-CD1 - -
-TYR N-CA-CB-CG CA-CB-CG-CD1 - -
-Table S4: Antigen conformational changes upon binding. Bound and unbound antigens were aligned on their interface (all
residues within 5 ˚A of the antibody in the complex structure). Cartesian RMSD on backbone atoms (N, C, Cα and O) and
on all atoms are reported both for the interface residues and for the whole antigen. Note that some antigens display large domains rearrangements that results in a large full antigen RMSD (1BGX and 4FQI).
Complex PDB ID Residue count RMSD on backbone atoms ( ˚A) RMSD on all atoms ( ˚A) Full Ag Ag interface Full Ag Ag interface Full Ag Ag interface
1AHW 199 27 2.17 0.69 2.36 1.09 1BGX 799 70 49.73 2.08 50.09 2.98 1BVK 129 20 1.27 1.63 1.79 1.62 1DQJ 129 24 0.97 1.29 1.50 1.79 1E6J 71 13 1.87 1.04 2.42 1.53 1JPS 182 24 1.90 0.65 2.19 1.07 1MLC 129 19 1.13 0.71 1.44 1.11 1VFB 129 21 1.24 1.73 1.66 2.03 1WEJ 104 15 0.53 0.82 1.22 1.83 2FD6 247 17 8.22 0.67 8.48 1.22 2VIS 267 22 0.94 0.46 1.25 0.64 2VXT 152 24 2.65 1.94 3.58 2.93 2W9E 99 19 2.60 1.73 3.03 2.63 3EO1 224 17 4.68 1.27 4.99 2.17 3EOA 178 16 1.34 0.38 1.69 0.87 3G6D 106 19 3.02 2.79 3.61 3.46 3HI6 178 25 2.11 1.35 2.72 2.20 3HMX 406 25 3.63 1.07 3.97 1.55 3L5W 101 11 2.77 0.42 3.22 1.43 3MXW 150 24 0.57 0.75 1.05 1.06 3RVW 219 19 0.69 0.70 1.18 1.36 3V6Z 137 22 4.28 0.92 4.69 1.56 4DN4 61 14 1.46 0.51 1.92 1.24 4FQI 1419 24 29.33 1.31 29.38 1.54 4G6J 149 23 0.88 1.02 1.44 1.88 4G6M 149 24 0.75 0.55 1.52 1.09 4GXU 1446 28 3.67 0.76 3.74 0.90
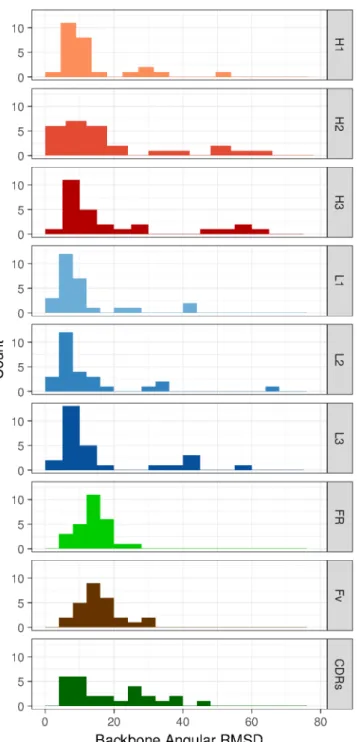
Figure S3: Histogram of angular RMSDs for individual CDRs and for FRs, Fv and CDRs in concert. Backbone angular
(a) (b) (c)
(d) (e) (f)
(g) (h) (i)
Figure S4: Conformational changes in 3EO1. (a) Hydrophobic patch in contact with H1 in the antigen (deeper red indicates
greater hydrophobicity). (b) Simulated interface between unbound antibody and bound antigen. The antibody is in grey, the antigen in light blue. The hydrophobic patch on the antigen is in red (deeper red indicates greater hydrophobicity). The serines SER-30 and SER-31 are turned away from the antigen, and the phenylalanine PHE-29 is in contact with the solvent. (c) Bound antibody in complex with antigen. The antibody is in grey, the antigen in light blue. The hydrophobic patch on the antigen is in red (deeper red indicates greater hydrophobicity). The serines SER-30 and SER-31 are directed towards the hydrophobic patch, and the phenylalanine PHE-29 is buried. (d)(e)(f) Three different views of the cavities at the simulated interface between unbound antibody and bound antigen. The unbound antibody is in grey, the antigen in light blue. The cavities and the H1 loop are shown in red. This position of the H1 loop would leave a large cavity. (g)(h)(i) Three different views of the cavities at the antibody-antigen complex interface. The antibody is in grey, the antigen in light blue. The cavities and the H1 loop are shown in blue. The cavity is partly filled by the H1 loop with bound conformation.
Table S5: Classification of CDR loops into classes. A classification was made after the definition of thresholds. A global
movement was considered above 1.5 ˚A of Cartesian RMSD and a local movement was considered above 40° angular RMSD. These thresholds are arbitrary but work well when visually checking class assignments. For each loop, one class was assigned for the backbone and another for the whole loop. For the “backbone” classes:
• class 0 corresponds to the absence of conformational changes (backbone Cartesian RMSD lower than 1.5 ˚A and backbone angular RMSD lower than 40°)
• class 1 corresponds to local conformational changes without displacements (backbone Cartesian RMSD lower than 1.5 ˚A and backbone angular RMSD greater than 40°)
• class 2 corresponds to a hinge motion without local conformational changes (backbone Cartesian RMSD greater than 1.5 ˚A and backbone angular RMSD lower than 40°)
• class 3 corresponds to a global displacement with internal conformational changes (backbone Cartesian RMSD greater than 1.5 ˚A and backbone angular RMSD greater than 40°)
For the “whole loop” classes:
• class 0 corresponds to loops without any conformational changes, (“backbone” class is 0, side-chain Cartesian RMSD is lower than 1.5 ˚A after backbone alignment and side-chain angular RMSD is lower than 40°)
• class 1 corresponds to backbone conformational changes without side-chain movements (“backbone” class is not 0, side-chain Cartesian RMSD is lower than 1.5 ˚A after backbone alignment and side-chain angular RMSD is lower than 40°)
• class 2 corresponds to a stable backbone with side-chain movements (“backbone” class is 0 and either side-chain Cartesian RMSD is higher than 1.5 ˚A after backbone alignment or side-chain angular RMSD is above 40°)
• class 3 corresponds to both backbone and side-chains conformational changes (“backbone” class is not 0 and either side-chain Cartesian RMSD is higher than 1.5 ˚A after backbone alignment or side-chain angular RMSD is above 40°)
PDB Code Backbone classes Whole loop classes of complex (H1-H2-H3-L1-L2-L3) (H1-H2-H3-L1-L2-L3) 1AHW 0-0-0-0-0-0 0-0-0-0-0-0 1BGX 2-1-3-0-2-0 1-3-3-2-3-2 1BVK 0-2-0-0-0-1 2-1-2-2-0-3 1DQJ 0-0-0-0-0-0 2-2-2-2-0-0 1E6J 0-0-0-0-0-0 0-0-2-0-0-0 1JPS 0-0-0-0-0-0 2-0-0-2-0-0 1MLC 0-3-0-0-0-0 0-3-0-2-2-0 1VFB 0-0-0-0-0-0 0-2-0-2-0-0 1WEJ 0-0-0-0-0-0 0-2-0-2-0-0 2FD6 0-1-0-0-0-0 2-3-0-2-0-0 2VIS 0-0-3-0-0-1 0-2-3-2-0-3 2VXT 0-0-1-0-0-0 0-0-1-2-0-2 2W9E 3-3-0-0-0-0 3-3-0-0-0-0 3EO1 3-1-0-1-1-0 3-3-0-3-3-2 3EOA 0-0-0-0-0-0 0-0-0-2-2-0 3G6D 0-0-0-0-0-0 0-0-2-0-0-0 3HI6 0-0-3-0-0-0 0-2-3-2-2-2 3HMX 0-0-0-0-0-0 0-2-0-0-2-0 3L5W 0-0-0-0-0-0 0-0-2-0-0-0 3MXW 0-0-0-0-0-0 0-0-2-0-0-0 3RVW 0-0-0-0-0-0 0-0-2-0-2-0 3V6Z 0-0-3-0-0-3 0-0-3-0-2-3 4DN4 2-2-0-1-0-0 3-3-0-3-2-2 4FQI 0-2-0-0-0-0 0-3-2-0-2-0 4G6J 0-0-0-0-0-0 0-2-0-0-0-0 4G6M 0-0-0-0-0-0 0-0-0-0-0-0 4GXU 0-0-0-0-0-1 0-2-2-0-2-3
Figure S5: Conformational changes of the antibody in 3RVW and its antigen upon binding. The interface is displayed in
color. The bound antibody is in red, the unbound antibody is in yellow. The bound antigen is in dark blue, the unbound antigen is in light blue. The unbound antibody was aligned on the bound antibody Fv. The unbound antigen was aligned on the bound antigen. (a) and (b) Limited conformational changes of the antibody interface upon binding, shown in two different orientations. (c) and (d) Limited conformational changes of the antigen interface upon binding, shown in two different orientations. (e) The antibody-antigen interface in its unbound conformation shows a major steric clash of side-chains TYR-185 of antigen and TYR-100 of the antibody’s heavy chain (enhanced Chothia numbering). (f) Displacement of the TYR-100 side-chain of the antibody’s heavy chain prevents this major clash and allows binding.