Complexity Cost Analysis in a Large Product Line
Josi: Luis Landivar Chavez
Bachelor of Science in Electrical and Computer Engineering, SUNY Buffalo (1 998)
Submitted to the Department of Electrical Engineering and Computer Science and the Sloan School of Management in Partial Fulfillment of the Requirements for the Degrees
of
Master of Science in Electrical Engineering and Computer Science Master of Business Administration
In Conjunction with the Leaders For Manufacturing Program at the Massachusetts Institute of Technology
June 2006
02006 Massachusetts Institute of Technology. /7 All rights reserved.
Signature of Author -
Department of Electrical Engineering and Computer Science Sloan School of Management May 5,2006
Certified by
Sharon Novak, Thesis Supervisor
Visiting Professor of Management Science, Sloan School of Management
Certified by
David Simchi-Levi, Thesis Supervisor
Professor, Department of Civil and Environmental Engineering and Engineering Systems Division
Accepted by -
Debbie Berechman, Executive hirector of Masters Program ,'
~ " - 7
A & n Sc@1 of ManagementAccepted by - - - , - - , *,
~ Smith, Department 'Gmmittee oh Graduate Theses ~ r t
V
Department of Electrical Engineering and Computer Science
OF TECHNOLOGY
NOV
0
2
2006
Complexity Cost Analysis in a Large Product Line By
Jose Luis Landivar ChIvez
Submitted to the Department of Electrical Engineering and Computer Science and the Sloan School of Management on May 5, 2006 in partial fulfillment of the Requirements
for the Degrees of Master of Science in Electrical Engineering and Computer Science and Master of Business Administration
Abstract
Hewlett-Packard's Industry Standard Servers (ISS) organization offers a large variety of server computers and accessories. The large range of options available to its customers gives way to complex processes and less than optimal resource usage. In the work presented here, a method for quantifying the costs associated with these effects is reviewed and applied to the current ISS offering. Several areas for investigation are identified including Research and Development, Sales and Marketing, Materials, Inventory, Organizational, amongst other costs that erode profits. Each area is explored through interviews and detailed modeling to arrive to a cost estimate. The end goal for estimating the costs associated with complexity is to establish a simple process for evaluating the "real" profitability of a new product introduction (NPI). Such process is enabled by implementing a set of complexity guidelines through the use of a complexity cost calculator. The end result is that HP's ISS division could see savings in the millions of dollars once the program is implemented. In the end, a set of wide reaching conclusions are drawn from the study to assist in future complexity cost analyses.
Thesis Supervisor: Sharon Novak
Title: Visiting Professor of Management Science, Sloan School of Management Thesis Supervisor: David Simchi-Levi
Title: Co-Director, Leaders For Manufacturing Fellows Program
ACKNOWLEDGEMENTS
For all the great experiences and incredible knowledge imparted, I would like to thank the Leaders for Manufacturing program at MIT. Everyone in the administrative and executive staff has been a supporting force behind all my efforts in this incredible endeavor. Thanks also go to all the members of the LFM '06 family especially all the classmates with whom we were able to share sad and joyful moments together. Many memories will remain and others hopefully will be forgotten. Also, thanks to all the people from Wauwatosa, Wisconsin who are a living example of success under adversity and to all members of the Secret Brotherhood of Lambda Fi Mu.
I would also like to thank the members of the Strategic Planning and Modeling group at Hewlett-Packard, Palo Alto, CA. Without their hospitality, knowledge and support it would have been impossible to complete this project. In particular, I would like to thank Bill Crandall for his continued support of the LFM program throughout several internships. Furthermore, Chris Fry deserves my heartfelt thanks for all the expertise and opportunities that he has shared with me inside and outside of HP. Also, Brian Cargille with his immense ability in the art of communicating and managing people has taught me more than he will ever take credit for in the difficult task of project management. I would also like to thank: Scott Ellis, Marilena Russo, Thomas Olavson, Jane Melia, Quin Garcia, Gavin DeNyse, Dorothea Kuettner, Jason Amaral, Sitki Timucin, John Bowman, and Wendy Schumer, all incredibly talented members of SPaM and ISS.
Much of the work presented in this thesis would not have materialized without Professor Sharon Novak's persistence and devotion to teaching at MIT and for her detailed suggestions to improve this thesis. Thanks also go to Professor David Simchi-Levi for his teachings in Supply Chain Management.
Finally, I would not be writing these acknowledgments if it was not for the most important person in my life, my mother. She has devoted herself to her family and taught me to value education while sacrificing hers. Thanks also go to my fiancee who has lovingly dealt with my absence for two years. Finally, to my family and friends in the United States and Ecuador, I wish you get to read this some day and feel that all the pains of dealing with me were not all in vane.
Complexity Cost Analysis in a Large Product Line
By Josd Luis Landivar Chavez
CHAPTER 1: BACKGROUND ... 9
1.1 Hewlett-Packard Company ... 9
1.2 Industry Standard Servers ... 10
1.3 Strategic Planning and Modeling Group ... 11
1.4 The Design for Supply Chain Team ... 12
1.5 Organizational relationships ... 13
CHAPTER 2: PRODUCT VARIETY AND COMPLEXITY... 15
2.1 Product variety versus complexity... 15
2.2 Complexity drivers... 17
2.3 The impact of too much variety ... 18
2.4 Pure complexity costs and unaccounted costs ... ... 20
2.5 Organizational aspects of complexity ... 22
2.6 Learnings from other industries ... 23
CHAPTER 3: VARIETY CONTROL IN ISS... ... 27
3.1 ISS products and supply chain ... 27
3.2 New product introduction process ... 29
3.3 ISS state of complexity ... 30
3.4 Existing framework for the analysis of complexity... ... 32
3.5 Challenges in framework use for ISS ... 34
CHAPTER 4: IDENTIFICATION & QUANTIFICATION OF COSTS ... 37
4.1 Analytical methods used ... 37
4.2 Impacted cost areas ... 37
4.3 Development costs ... 41
4.4 Sales & Marketing costs ... 45
4.5 Part inventory and Material costs ... 49
4.6 W arranty costs ... ... 52
4.7 Organizational costs... 53
4.8 G uidelines ... 55
CHAPTER 5: MEASURING THE IMPACT... ... ... 57
5.1 New product introduction review process ... 57
5.2 Guideline implementation... 58
5.3 Strategic considerations ... 60
5.4 Projected impact at Platform and SKU levels ... 61
5.5 SKU level impact breakdown ... 64
CHAPTER 6: CONCLUSION ... 67
6.1 Summary of key learnings ... 67
6.2 Implementation status ... 70
CHAPTER 1: BACKGROUND
1.1 Hewlett-Packard Company
In 1939, Bill Hewlett and David Packard, then recent Stanford University graduates, started a small electronics company in Palo Alto, California. Their first informal office was a rented garage at Addison Avenue. Here, the electronics revolution started and "Silicon Valley", as the area became known, was the epicenter of it all. Their first products were in the area of electronic instrumentation. Walt Disney Studios was their first customer, purchasing the first audio oscillators from the young Hewlett and Packard. These oscillators were used with great success in the creation of the sound for the movie Fantasia. Since then, Hewlett-Packard's product line has expanded rapidly to take shape into what the company is today.a
The 60th anniversary of the company was received with radical changes in the organization. In order to better compete with aggressive new-comers in the computing industry, HP decided to spin off its Test & Measurement, Semiconductor, Medical Devices and Chemical Analysis businesses into a new company called Agilent
Technologies [NYSE: A] in 1999.
The second big change that the company would experience during this year was the appointment of Ms. Carly Fiorina as the new leader of the company. Fiorina spearheaded one of the biggest events in US financial history: a merger between two giants in the field, Compaq Corporation and The Hewlett-Packard Company. In May 3, 2002, the new company began operating and quickly moved up to No. 13 in the Fortune
a Hewlett-Packard's product line grew to more than 100 products by 1952 and 380 products by 1959. Packard, Dave; 1996. The HP Way: How Bill Hewlett and Il Built Our Company; Pages 65, 77. New York: HarperCollins Publishers, Inc.
500 ranking. This was the largest tech merger in history at the time and created a company with combined revenues of US$87.4B.'
Actively participating in the personal computer arena, HP now designs and markets portable and desktop computers, printers, handheld PCs, storage devices, server computers and other related products. In the computing front specifically, HP is the 2nd largest manufacturer of Personal Computers in the world based in volume of sales. Today, Hewlett-Packard Co. [NYSE: HPQ] has 150,000 employees worldwide, generated revenues of US$86.7B in 2005 and remains headquartered in Palo Alto, CA.
1.2 Industry Standard Servers
The server organization within HP is under the Enterprise Storage and Servers (ESS) group. This division includes groups involved with Business Critical Servers, Storage Servers and finally, Industry Standard Servers (ISS). ISS' mission is to design and market server computers based on industry-standard components such as off-the-self PentiumTM and OpteronTM microprocessors, commonly available hard drives and memory modules, etc.b As one may expect, and as it is the case in any business based on
commodity components, margins tend to be small and accessories take on a bigger role in profits.
In order to remain competitive, HP has evolved from being a vertically integrated company to relying on third party contract manufacturers to build many of its products. Lower labor costs, high productivity and attractive business development deals have
b During my period at HP, I worked closely with members of several teams within ISS. During my
assignment, the general manager of ISS and main stakeholder of the project, moved to a position with a competing firm causing uncertainty in the expectations of the effort. However, this did not have any noticeable effect on the outcome of this work.
drawn computer manufacturers into Asian countries. As a result of having a geographically diverse operation, HP has modified its supply chain to become tighter and more flexible. HP has close relationships with its suppliers and even the suppliers to its suppliers to ensure that no disruption occurs in fulfilling customer demand. Even so, HP server products are still manufactured by factories located in Europe and the US in part because customers in this segment expect shorter delivery times and are less sensitive to prices than consumer product customers. The manufacturing of the latter products have migrated to Asia to take advantage of lower labor costs.
Finally, over 64% of HP's revenue in 2005 came from outside the US and this percentage has increased in the past years.c Therefore, it is important for ISS to focus on improving its supply chain in key non-US markets before doing so in the US. The remaining part of this document is focused on the study performed on ISS' operations in Europe, Middle East and Africa [EMEA].
1.3 Strategic Planning and Modeling Group
In today's highly competitive computer industry, customers have come to expect high quality products at low prices.d For large computer manufacturers like Hewlett-Packard, this translates to a need for operational efficiency and a renewed supply chain focus. All eyes in the corporation are set on achieving the highest level of performance in
C Hewlett-Packard's non-US revenue was $43.843B of $73.061B (60.01%) of total revenues in 2003,
$50.543B of $79.905B (63.25%) in 2004, and $56.148B of $86.696B (64.76%) in 2005. Hewlett-Packard, December 21, 2005. Hewlett-Packard Co (HPQ) IO-K Financial Report; Page 133, SEC Filing
d As computer components become ever faster, cheaper and smaller, computers become increasingly more versatile and powerful. However, the average customer is not able to harness this performance completely and thus, becomes less willing to pay more for such improvements. Rappaport, Andrew S.; Halevi, Shmuel;
1991. The Computerless Computer Company; Harvard Business Review; Jul/Aug91, Vol. 69, Issue 4,
operations. Furthermore, as many of Hewlett-Packard's products are now manufactured in Asia by Original Design Manufacturers (ODM), understanding and optimizing the manufacturing and supply chain processes of these ODMs could translate into a global competitive advantage.
The Strategic Planning and Modeling group, also known as "SPaM", is part of the Global Operations organization of Hewlett-Packard. Its main goal is to advise functional divisions on topics related to business planning and to develop models and tools to enable more effective decision making within these divisions.2' 3'4 In addition, this group operates as an internal consulting organization and employs the brightest operations consultants from renowned institutions like MIT and Stanford University. Functional divisions within the company come to SPaM for help on solving complex operational issues with a typical engagement lasting 8 to 12 weeks. Currently, SPaM provides services through consultants based in several geographies: USA, France and Singapore.
1.4 The Design for Supply Chain Team
Design for Supply Chain (DfSC) is not new at HP.2,3 However, SPaM's DfSC team is unique in enabling the systematic and repeatable application of supply chain concepts across the company through an integrated approach. HP's World-Wide Design for Supply Chain program was created in 20014 as a solution to the increasing number of engagements related to supply chain issues within SPaM, as opposed to strategic business planning work. This team focuses on finding creative and effective solutions to the supply chain problems of Hewlett-Packard and educating the company on industry-wide
best practices. DfSC has historically been responsible for considerable dollar savings to the company in general, and to the individual divisions, in particular.
An example of the value added by DfSC to Hewlett-Packard can be observed in the implementation of a Product Line Management process for the North American Consumer Computing [NACC] division. In this project, as described by LFM '05 Aaron Raphel, the complexity related costs of offering tens of desktop models to retail establishments are estimated before a new product is introduced.5 By doing this, the
company can realize early on if a potential product will bring real net profits or if its attributes will make it look profitable on paper but money-losing in practice. Once again, for HP this translated into multiple millions of dollars in savings.
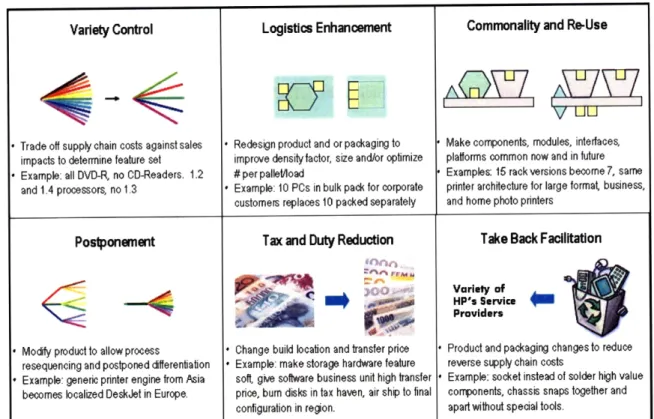
The previous two examples fall into two of the six focus categories of the DfSC team, namely Variety Control and Logistics Enhancement. The remaining four categories of Commonality and Re-Use, Postponement, Tax and Duty Reduction, and Take Back Facilitation are shown in Figure 1. For any specific engagement, several of these focus areas can be addressed at the same time.
1.5 Organizational relationships
Both SPaM and DfSC are relationship-based functions and, as such, maintain close ties with the functional divisions that act as their consulting clients. Supply chain champions, procurement consultants, and logistics managers provide project support within the individual divisions. They are the key to getting buy-in from the clients to reach successful implementation of the recommendations provided.
Variety Control Logistics Enhancement Commonality and Re-Use
* Trade off supply chain costs against sales * Redesign product and or packaging to Make components, modules, interfaces, impacts to determine feature set improve density factor, size and/or optimize platforms common now and in future * Example: all DVD-R, no CD-Readers. 1.2 # per pallet/load * Examples: 15 rack versions become 7, same
and 1.4 processors, no 1.3 * Example: 10 PCs in bulk pack for corporate printer architecture for large format business, customers replaces 10 packed separately and home photo printers
Postponement Tax and Duty Reduction Take Back Facilitation
S. Varelty of
HP's Service
Providers
Modify product to allow process * Change build location and transfer price * Product and packaging changes to reduce resequencing and postponed differentiation * Example: make storage hardware feature reverse supply chain costs
Example: generic printer engine from Asia soft give software business unit high transfer * Example: socket instead of solder high value
becomes localized DeskJet in Europe. price, bum disks in tax haven, air ship to final components, chassis snaps together and configuration in region. apart without special tools.
CHAPTER 2: PRODUCT VARIETY AND COMPLEXITY
2.1 Product variety versus complexity
It is well known that if a company is able to offer valuable products with unique features the job of selling becomes much easier.e Consumers purchase products that fit most closely with their needs. In turn, increasing the breath of products also increases the probability that the customer will find a suitable product.f Typically this product variety
drives key decisions in a company, especially in consumer product companies such as
Hewlett-Packard, which face increased competitive pressures. Sales & Marketing and
other customer-facing organizations in the company may increase the product offering but may not have the benefit of accurate visibility into the costs incurred when doing so.
Increased product variety means that the sales force of these corporations can offer more specialized or customized products to their customers, thereby increasing revenue. However, for a business to be successful, profit, not revenue, needs to drive the key decisions. Often when introducing a new product or set of products, several unwanted side-effects are created. Such problems range from higher inventory costs due to the reduction in volume aggregation benefits when splitting demand into smaller volumes, increased planning overhead, and even the cost of a stressed workforce that was
e William Davidow explains that "if the product has a number of unique characteristics of great value to a customer, then the salesperson's job is that much easier." However, he goes on to say that the difficulty is in educating the salesperson on those characteristics. Davidow, William H., 1986. Marketing High
Technology: An Insider's View; Page 44. New York, NY: The Free Press.
f Mr. Verghis asserts that "[H]aving a choice gives customers some degree of control over the interaction,
which invariably improves their satisfaction." If the customer is easier to satisfy the probability of closing a sale should increase. Verghis, Phil., 2005. The Ultimate Customer Support Executive: Unleash the Power
intended to support 10 products and now needs to service 50 products with the same
resources.g
For the purposes of this analysis, we define product complexity as the effects of overextending variety in a given product offering. In practice, the costs of this complexity in product lines are extremely hard to identify, let alone quantify. Frequently, everybody in the company knows when there are too many products to work on with the resources available. Management can often observe the effects of this complexity in the form of increased overhead costs and unhappy workers. However, the problem of uncovering and quantifying all the areas impacted by product complexity is exceedingly difficult and takes a concerted effort from management to undertake. For instance, how do you quantify the cost of a worker that is more likely to make mistakes in her job due to the fact that she has to focus on many products at once?
As described above, not all product variety is good. On the one hand it potentially increases customer satisfaction, filling all necessary price points to avoid customer migration to competitors. It can even benefit certain areas of the firm since they may be
rewarded on a revenue-growth basis. However, there are two caveats to the benefits. First, increased product variety must be strategic; e.g. gaining market share in a nascent market environment. Second, increasing the number of products also increases costs in unpredictable ways, as pointed out earlier. Companies must be reminded that if their customers' needs are flexible, they could as well have been satisfied with existing products. The costs of complexity can be significant and greatly affect the bottom line. In the remainder of this chapter, we will focus on the second caveat.
g An example of this behavior is found in the Departments of Labor and Health, Education, and Welfare
and related agencies appropriations forfiscal year 1979: hearings before a subcommittee of the Committee on Appropriations, United States Senate, Ninety-fifth Congress, second session; Page 659.
2.2 Complexity drivers
There are industry-wide forces as well as market-specific ones that drive the
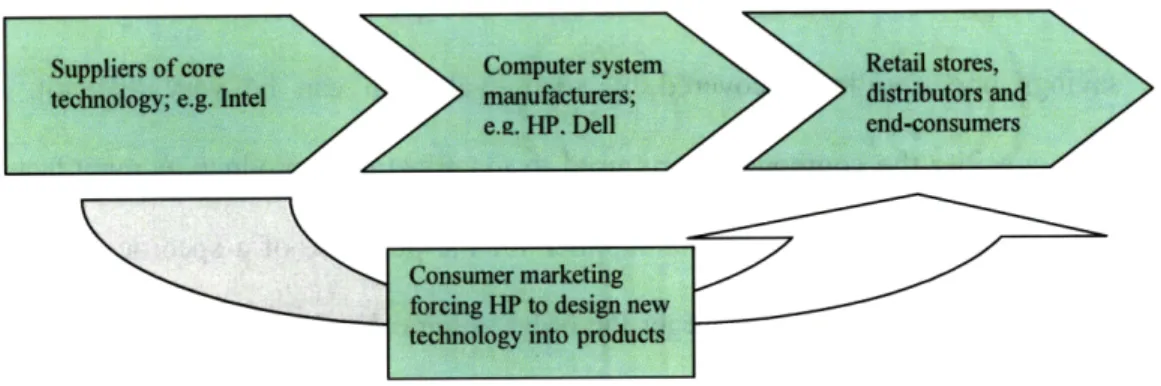
proliferation of products. Industry-wide drivers involve suppliers as well as end consumers and any other organizations in the channel between the two, such as retailers and distributors. One such driver can be seen in the high tech industry. Rapid changes in technology such as faster microprocessors or higher-capacity hard disks, and the market demand for products that incorporate such technologies force companies like HP to offer more variety. On one hand, early adopters have the buying power to force HP to offer the latest and greatest technologies as soon as they are ready for the market. On the other hand, there are suppliers such as Intel that push products with new features such as increased microprocessor speed and bigger cache sizes to manufacturers like HP and Dell. The combined effect is that these computer manufacturers end up increasing their product lines without control. Figure 2 addresses this chain reaction.
Figure 2 - Technology-driven product variety
Another cause of complexity is specific to the computer equipment market. End consumers look favorably at a corporation which offers a wide variety of products and is
willing to customize a solution for that particular individual.h This is exceedingly important in a commodity market such as computers, where there are other products from which consumers can choose and competitors that are willing to do everything they can to gain market share. Similar "cut-throat" competition can be seen in the distribution/sales channel of these industries. For instance, if the product is sold to consumers through retailers, these retailers will compete voraciously with one another to entice end consumers with "exclusive" models of products (e.g. computer desktops at Best Buy) that can only be offered at their store. Of course, as stated in Raphel 2005', this puts a lot of pressure on manufacturers to produce customized product offerings for each retailer; thus, increasing complexity.
2.3 The impact of too much variety
The main problem with variety growing out of control is that it is hard to evaluate its impact on profits. Even if the associated costs were quantifiable, extracting value from the savings opportunities uncovered by such evaluation can be very difficult. For example, consider the component parts used to manufacture a product. A manufacturer like HP will negotiate a price with a supplier for the purchase of a specific volume of these components. Typically, the larger the order volume, the lower the per-unit cost for the part. This occurs because as the demand volume for the supplier's product increases, the supplier benefits from moving down in the learning-curve which decreases costs.
h According to the following study, the old economy was characterized by mass production of commodities
whereas the modern economy is based on production of increasingly differentiated products. Also, one of the major findings in this study is that customization is even more important than reliability in customer satisfaction. Fornell, Claes, Johnson, Michael D., Anderson, Eugene W., Jaesung Cha, Bryant, Barbara Everitt, Oct. 1996. The American Consumer Satisfaction Index: Nature, Purpose and, Findings; Journal of Marketing, Vol. 60, Issue 4, Pages 7-18. Chicago, IL: American Marketing Association
Also, for the supplier, higher volumes mean spreading fixed costs over a larger base.6 If HP decides to use a unique part in a new product being introduced (as opposed to a common part already used to build another product), the company will lose the opportunity of combining the volume of the unique part with the volume of the common part already being procured. The combined volume would potentially result in lower per-unit costs. Nonetheless, even though we can quantify the potential benefit of consolidating demand for a common part, restructuring procurement contracts with suppliers may not be straightforward.
It must be noted here that there are valid reasons why a company would choose to introduce a product with a unique component. Performance improvements on certain top-of-the-line products could benefit the company by increasing profit margins. Also, there are occasions when some parts would simply not interoperate correctly with a common product base. This lack of fit can increase costs excessively in customer support requirements as well as trigger market share losses. Therefore, using common components in this situation could be counter-productive.
In capturing the benefits of a reduction in complexity, the timing of these benefits depends on some factors. If the source areas of complexity are mainly labor-related, a recipe for complexity reduction translates into reducing the workforce. Such reduction of workers is based on estimates of "possible" savings which may not be a compelling enough reason for disrupting a worker's life. Therefore, in the short run, these costs can be accounted for but the savings may not be captured. Nonetheless, the company could allow attrition to decrease the workforce size to the desired level in the long run. In
summary, one must have realistic expectations as to the timing of the benefits when implementing a complexity reduction plan.
In addition, a method for reducing the impact of complexity in a product line is through effective product lifecycle management policies. In this scheme, new product introductions replace existing "legacy" products. The retirement of these older products is known as planned obsolescence; that is, the programmed exclusion of specific existing products from the offering. In well managed product lines, the rate of new product
introductions is in harmony with the rate of products being retired.
However, even when product obsolescence is planned, companies worry that retiring products from their offering would reduce their revenues and alienate current customers that are used to existing products. It is difficult to decide between existing revenue generating products and only the prospects of a new product's market performance. The concerns of losing customers loyal to a specific product are very real. However, the complexity costs incurred in keeping around older products may be higher than the cost of transferring this customer to a better and newer product. The cost of materials today for a product designed 20 years ago is higher than that for a newly designed product because economies of scale in older materials are gone for good and are only sold as specialty or antique materials.
2.4 Pure complexity costs and unaccounted costs
A distinction must be made when discussing the costs of complexity. There are
complexity costs and is related to the increasing difficulty in supporting' a product
offering. For instance, some companies in the computer industry place special emphasis on Research and Development (R&D) investments while attempting to differentiate their products in the marketplace by introducing innovations. Part of the responsibility of the R&D department is to test all possible combinations of features and components; e.g. an older desktop model with newer hard disk sizes or newer memory modules. If the company has a policy of "backwards-compatibility"j, the testing costs can grow exponentially as the new components need to be tested against all existing products being offered, not only the products being introduced with the new components.
The second cost type that we will consider is unaccounted costs. In this context, "unaccounted" does not imply a failure by finance and accounting professionals in a
company to keep track of product performance. Rather, in many companies, product lines are not "held accountable" for their share of fixed costs. That is, a company may
manufacture a multimillion dollar server computer and a tiny portable computer. The server computer product may use more fixed resources than the portable computer yet the costs associated with the usage of these resources may not be proportionally divided between the two products. This occurs because companies don't operate their overhead functions as independent businesses but rather as service organizations; e.g. Finance, customer support, shipping and receiving, etc. Such organizations are not responsible for profit and loss reporting at the end of a fiscal quarter but rather are allocated a budget for their quarterly spending.
'This support may include improving the original product, offering new components, fixing bugs in the product, and ensuring spare parts are available.
I A product is said to be backward compatible (or downward compatible) when it is able to take the place of
an older product, by interoperating with other products that were designed for the older product. Source: Wikipedia (http://en.wikipedia.org/wiki/Backwards_compatibility)
Both unaccounted and pure complexity costs are incurred whenever a new product is introduced. Therefore, if these costs are quantified, one can also estimate what those costs would be for a similar product (one with similar attributes) being introduced in the future. If we can determine the expected complexity-adjusted costs of offering a new product, we could compare them against the expected profits in order to make a better informed decision about its introduction. That is, a company may see a product introduction as profitable pre-consideration of complexity costs and as money-losing when adjusting for complexity. Of course, there could be a strategic argument for introducing a money-losing product and we will consider this in Section 5.3.
2.5 Organizational aspects of complexity
Marketing and New Product Introduction (NPI) teams within a company are typically responsible for determining and potentially increasing the number of Stock Keeping Units (SKUs) through their direct and indirect activities. These organizations may make the decision to offer a new product based on a standardized worksheet which includes financial considerations such as projected volume of sales, cost of goods sold and other operational expenses. However, the cost of carrying an already large product line is not one of those considerations. Due to their close involvement in product decisions, any attempt to account for costs of complexity during product introduction must include members of Marketing and NPI teams.
Supply chain teams are on the other side of the equation. Individuals involved in this functional area of the company typically support more concrete studies of the consequences and risks present in offering a large set of products. However, these teams
cannot directly influence product complexity. Rather, they provide detailed studies and analyses that can persuade decision makers to implement changes in the evaluation of new product introductions. In the middle of this chasm are all the remaining functional areas of the firm. These groups are the real "victims" of the problems of product proliferation since they incur the cost of complexity at least through increased team work load, typically without budget increases. An example of this is can be observed again in the R&D departments where the budget remains the same and does not get significantly adjusted for most changes to the projected work plan. At HP, a new product may add anywhere from thousands of dollars to hundreds of thousands in the case when the product defines a new family or platform. This is indeed a wide range of costs and it depends on several attributes such as the number of microprocessors supported by the system, whether the design is done internally or outsourced, and whether this is a brand new product design or it leverages a previous design. These attributes are highly specific to a company; therefore, quantifying R&D costs will require a high degree of internal research. Only when there is a large and highly visible new project, such as a product that creates a new family or platform, does the budget get revised to reflect the real burden that this represents for the organization.
2.6 Learnings from other industries
Hewlett-Packard is not alone in its variety control problem. In fact, many other companies have experienced the same issues in the past. In this section, we explore the complexity profile of a very different company in the bio-technology industry and show its effects on company returns.
Bionix, Inc.k
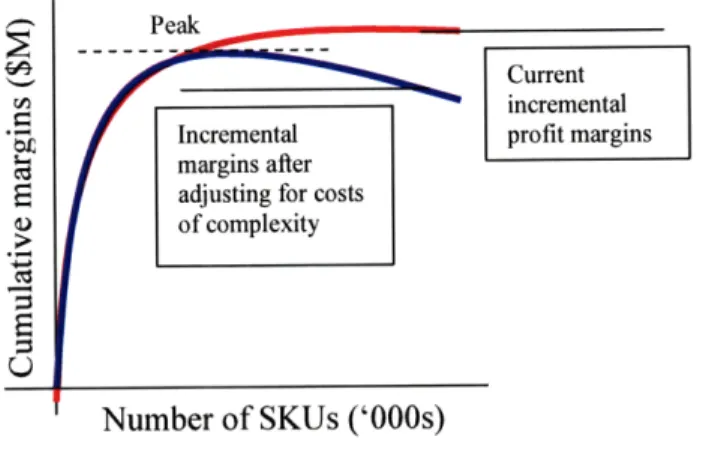
Bionix, Inc. is a company that specializes in the manufacturing of laboratory equipment such as glassware. A graph of profits versus the number of SKUs was prepared after analyzing pertinent profit margin data. Figure 3 illustrates the 80/20 rule:
80% of the profits are generated by 20% of the products. Similar graphs for other large
companies would show similar trends.'
I
Irumaotr or aru.u k VVVu)Figure 3 - Diminishing-returns curve for Bionix, Inc.
It is clear from Figure 3 that returns decrease as the number of SKUs (ordered list) increases. It is therefore expected that after accounting for costs of complexity, the real returns of the SKUs to the right of the curve actually become negative and the curve moves slightly downward as illustrated. That is, after a certain number of SKUs has been added to the product line, any additional SKU not only does it not add any profits to the company but even diminishes profits! An optimal strategy would guide the company to
k The company name and example are fictitious, but are based on real-world observations of companies outside of the computer industry.
I Jim Olsztynski suggests that product proliferation has reached a point of diminishing returns
industry-wide. He quotes a Wharton School online subsidiary survey which concludes that out of 424 executives from different industries, 35% believe that product proliferation affects profitability and 32% think that it affects product quality. Olsztynksi, Jim. April 8, 2006, How much is too much?; Supply House Times: Editorial.
offer only the number of products necessary to achieve cumulative profits somewhere near the peak of the blue line in Figure 3.
CHAPTER 3: VARIETY CONTROL IN ISS
3.1 ISS products and supply chain
The Industry Standard Servers (ISS) organization within the Enterprise Server Solutions group of Hewlett-Packard served as the consulting client for this project. The server products offered by ESS extend from standards-based systems (ISS) that sell for several thousand dollars, to entire super computers for business critical applications
(BCS) that can reach millions of dollars in price. For the purposes of this investigation,
our focus will be on servers based on industry standard components (ISS), such as off-the-shelf Intel processors, memory modules and disk drives. Such servers represent over half of ESS' revenue in 2005 according to HP's Annual Report.
As mentioned previously, ISS' origins trace back to Compaq Corporation in Houston, Texas, where it became the industry's leading server maker on its own right. After the merger of The Hewlett-Packard Company and Compaq Corporation in 2002, HP's Netserver line of servers and Compaq's more prominent ProLiant line of servers became a single group. The merger of these two companies solidified the market
leadership of the HP server division.
The server computing market is classified according to customer type, but most
importantly, according to the architecture used in the microprocessors. The market in which ISS' products compete is called "x86" which basically encompasses servers built around the widely accepted Intel and AMD microprocessors, as opposed to workstations built by companies such as Sun Microsystems, which use microprocessors based on the
"RISC" (Reduced Instruction Set Computer) architecture.m In recent years, the overall server market has seen a marked increased in demand for cheap and powerful servers based on standard x86 chips, to the advantage of manufacturers like Hewlett-Packard.n
The products offered by this organization are classified into two main product lines: ProLiant standalone servers and Blade systems. Proliant servers are powerful computers that come in either Desktop-computer-like enclosures or in space-saving boxes (colloquially called "pizza boxes ") that fit into a racking structure. Blade servers are much denser in terms of space usage. The idea behind these servers is that a single server will come in the form of a printed circuit board fitted into a small enclosure, thus savings space in the data center. About 16 such servers fit into an enclosure equivalent to 6 pizza
box servers. Aside from space savings, another advantage of Blade servers is that they
minimize the need to keep track of cables since servers attach seamlessly to a common interface circuit board called a backplane. All types of servers are offered in a variety of configurations based mostly around Intel microprocessors, with more AMD-based systems increasingly becoming available as well. The servers are sub-classified into
platforms or families positioned to fill different price points based on performance and to compete with products from Dell and IBM.
The manufacture of these products within HP varies widely from ODM-built systems to servers built in-house, in company owned factories. A large set of suppliers located throughout the world is used for making these HP server computers. These suppliers provide the standard components used for the fabrication of these systems such
m RISC based processors use a smaller set of simpler instructions with the goal of reducing the time it takes
to execute a single instruction. Some companies have implemented such architectures under names such as: ARM, DEC Alpha, PA-RISC, SPARC, MIPS, and PowerPC.
as microprocessors, memory modules, enclosures, power supplies, disk drives, and motherboards as well as less critical components such as screws, cable adapters, pre-packaged software, and packaging materials.
In the "front-end" portion of the supply chain (i.e. closer to the consumer), distributors throughout the world make the servers available to corporations and other business types. From the sales and marketing perspective, there is a desire to offer the widest variety of servers possible as to attract a larger customer base. A customer who does not find a product that fits her needs, may never come back to buy another HP product; or such is the belief.0 This view supports variety proliferation and has resulted in
the offering of a very large set of products and accessories over time by the division.
3.2 New product introduction process
As described in Chapter 2, the need to compete in a market where even the smallest product differentiation is perceived as having a positive effect on market share greatly encourages the addition of new products. This decision is typically based on market research studies and estimates of potential costs performed by marketing teams. These teams put together a Plan of Record (POR) document which contains revenue projections and cost estimates for making the new product. After profit or strategic evaluation and approval from relevant upper level management, the product is scheduled for production.
On the revenue side, we have asserted previously that sales and marketing teams in HP require incremental variety of products to make sales easier and more effective. On
o The problem of a customer not finding a product is analyzed in the context of stockouts in: Anderson,
Eric T.; Fitzsimons, Gavan; Simester, Duncan; 2006. Measuring and Mitigating the Costs ofStockouts; Management Science
the cost side, the Supply Chain and Operations teams work to make the products more effectively and cheaper. These latter teams have historically lacked the ability to influence the decision to introduce a new product. One goal of this study is to enable the company to make more fully informed decisions in this regard.
For a long time now, employees throughout the organization have felt that the added complexity due to an expanding product line increases the cost of conducting everyday business7. This hypothesis has resonated at the highest HP levels and upper
management teams have taken action to understand the effects of excessive variety in the product offering. The Design for Supply Chain team was charged with conducting a thorough analysis of the issue. This work is affiliated with that effort.
3.3 ISS state of complexity
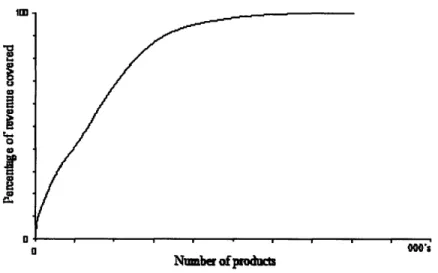
In order to get an idea of the level of complexity in the current product line, one can look at the percentage of revenue covered by a given number of SKUs. This is an ordered list with the more profitable products ranked higher. Figure 4 shows that 29% of the SKUs generate less than 1% of cumulative revenue.
a,
O
II
a a, a, Number of prodmtsFigure 4 - Diminishing returns curve for ISS products
Relatively speaking, 1% is a very small revenue figure for the size of the offering. When we take into account that some of the products in the 29% are very complex to manufacture and maintain, one gets the picture of the implications of this behavior on the bottom line. Furthermore, these results are not isolated. A similar picture can be drawn for most medium to large companies with similar results [See footnote 1].
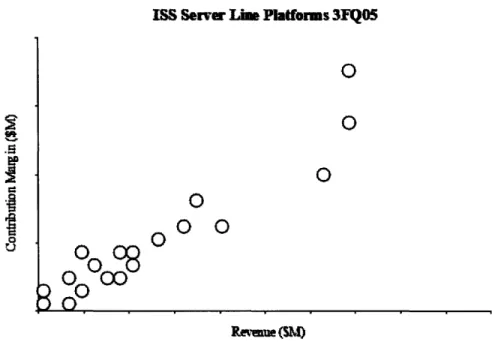
In addition to the SKU-level complexity, we can observe complexity effects at the platform level. A platform is a family or group of products that share similar attributes. In section 5.4 we will examine in more detail the real impact of complexity at HP in the platform level. However, the current platform complexity, as shown in Figure 5, is similar to SKUs in that a large percentage of platforms represent a small percentage of revenues. In particular for ISS platforms, 20% of platforms generate a very small portion of revenues. We illustrate the magnitude of complexity at this level by plotting revenues versus profit margins as shown in Figure 5.
ISS Server Line Platforms 3FQ05 03 U3
0
0
0
ýO
0 0
0
000
Reven e(SM)Figure 5 - Platform performance graph for ISS
In Figure 5, the platforms in the lower left corner are lower profit and revenue generating while profit-enhancing platforms are in the top right corner. Note the higher density of data points as one approaches the origin. Once again, this does not mean that HP should cut all lower performing platforms. It simply means that HP should target such platforms for evaluation of their strategic value and only then, act on their performance.
3.4 Existing framework for the analysis of complexity
A framework to analyze the costs of complexity in the product line is proposed in
Raphel, 20055. This framework takes a comparative approach to the problem of complexity in HP's North America Consumer Computing (NACC) group. It consists of listing all costs incurred in multiple areas of the current offering, side-by-side with a similar listing for a stripped-down pro-forma offering consisting of only a fraction of the
original products. It then compares the costs and identifies the potential savings. For the study of ISS' product line, we use a similar approach but instead of comparing the two product lines explicitly, this is done implicitly. Furthermore, in ISS we make use of more interview investigation methods instead of quantitative modeling for some areas and the opposite for other areas of cost.
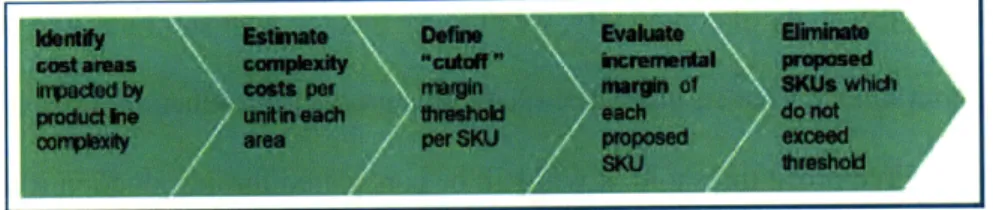
The general approach used in Cargille, et al, 20058 will be used for ISS as well. The following diagram describes the approach:
Figure 6 - General approach for cost of complexity analysis
The first step in this approach for studying complexity in an organization is to identify the affected cost areas. This can be done by conducting initial interviews with key players throughout the organization. Also, it is advisable to start with as many potentially affected areas as possible and then focus on the ones that show promise as a significant source of complexity of costs.
The second step is perhaps the most difficult of all. In order to estimate the
complexity costs in the previously identified areas we need to go through a detail quantification of the effects such as inefficient use of inventory, cost of time and errors produced by an overstretched workforce, and even providing technical support for all products.
Thirdly, the framework requires that one define a "cutoff' threshold for the margins required of a SKU. That is, after quantifying the costs of complexity for all products, one must determine the minimum amount (threshold) of profit margins that a given product must reach in order to overcome their estimated complexity costs.
In the case when a new product introduction is proposed to the organization, the fourth step is to evaluate its incremental margin and ensure that it meets the profit margin threshold. If it does, the product is considered for approval. However, if it does not meet
it, the product is rejected and this becomes the fifth and last step in the framework. In the ISS study of complexity, we propose that the fifth and final step include a strategic component. That is, instead of rejecting a product introduction when it does not meet the required profit threshold, it will still be considered for introduction if the product is deemed strategic for the company.
3.5 Challenges in framework use for ISS
As one might expect, it is very difficult to apply such a broad framework to a product line. ISS' product line is vastly larger than the line at NACC. This difference is the source of many interesting findings described throughout this document. Another important difference that we must note when looking at the ISS product offering versus the example in Raphel, 20055 is that the identification and quantification of cost areas changes when the type of products being offered changes. For instance, NACC's costs of complexity associated with the sales and marketing function are mostly associated with increased advertising expenses and other incentives to retail stores. In contrast, for ISS, these costs are primarily driven by inefficient inventory management at the distributors
and Value Added Resellers (VAR). The reason for this is that NACC builds and markets consumer computing products whereas ISS markets server computers to corporations and other institutions which may prefer purchasing through distributors instead of a retail chain.
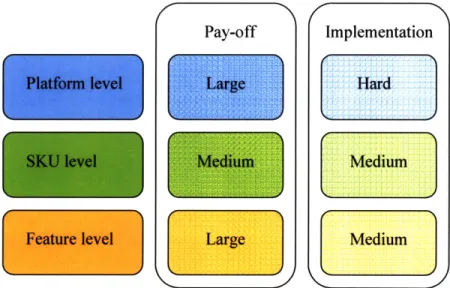
Lastly, in the ISS analysis we delve deeper into the issue of "multi-level" complexity.P In particular, we focus on SKU and Platform level complexity effects and briefly describe the concept of feature-level complexity. The latter is currently the focus of a great deal of research in the DfSC team. The following diagram shows the relationship between performing a complexity analysis at each level and the difficulty of implementing the recommendations of the study as well the expected pay-offs.
Figure 7 - Multiple levels of complexity in ISS
A final difference in reusing the approach from Figure 6 is that a software tool
developed by HP Laboratories in Palo Alto, CA was used in the ISS study in order to determine the relative importance of SKUs. In essence, this software, initially called
P Complexity issues not only can be associated with the proliferation of SKUs but also with that of platforms and/or features.
Margin Coverage Optimization (MCO), ranks those products with "aggregate" overall margins, higher in the list. "Aggregate" here means that all sales invoices which contain the given product at least once were gathered. Then, the combined profit margins for such product as well as other products purchased in the same invoice were added. Finally, all products were ranked based on this final combined profit margin figure. This is different than simply ranking products with high individual margins higher. For instance, if a lower margin product enables HP to make more profits in accessories or options then this product would be ranked higher using the MCO tool than if using individual margins.
CHAPTER 4: IDENTIFICATION & QUANTIFICATION OF COSTS
4.1 Analytical methods used
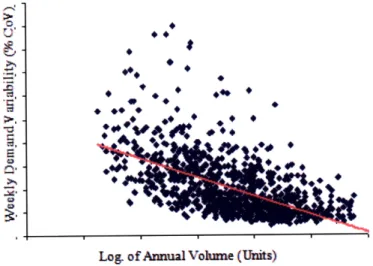
In structuring the study of complexity for the Industry Standard Servers division of HP, several methods of information gathering and synthesis were used. Some of these methods are more technically formal than others and are employed for specific areas of the analysis. For instance, the information used for the quantification of costs in the R&D area was obtained through direct interviews as data on individual SKUs and Platform costs are not readily available. On the other hand, in estimating the inventory-driven costs (IDC) related to complexity, a more formal technical modeling of holding, underage and overage costs was performed. In this model, we consider variables such as demand variation and component part fulfillment lead times.
We first concentrate on identifying the cost areas and subsequently describe the steps required to quantify their complexity-related impact.
4.2 Impacted cost areas
Complexity affects virtually all the functional areas of a company. The associated costs manifest themselves in unpredictable ways which makes it such a difficult task to undertake. During initial meetings, the goal was to hone in the major areas impacted by complexity during the product life cycle and to develop hypotheses that would explain the drivers of such costs.
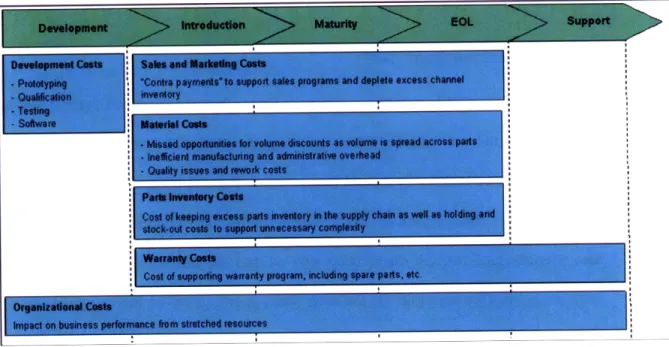
Figure 8 - Complexity cost areas throughout the product life cycle
After several meetings with ISS project team members who were well aware of the symptoms of complexity, the team was able to redraw the complexity map depicted in Raphel, 20055, with affected areas specific to ISS. Figure 8 shows this map along with the specific timing of the complexity effects throughout the lifetime of a product. The product lifetime includes all stages that a product needs to undergo before and after its market availability. That is, it involves development, introduction, maturity, end-of-life, and support phases.
Development
Virtually every product must go through a technical development phase in its infancy where features are defined and a prototype is built and tested. During this phase, a manufacturing process also needs to be developed as well as identifying suppliers for the basic components. SKUs that are fully developed and manufactured by its supplier
partners don't have to go through this phase. Such third-party accessories may include software packages and add-on storage drives. Furthermore, aside from the technical development, a new product typically requires certain level of business development. Distributors for the product need to be identified and pre-sale deals must be arranged with potential high volume customers.
Introduction
During the market introduction, a product is assigned a SKU number, recorded in a planning database and made available for sale. In addition, initial inventory of raw materials must be built up while other manufacturing costs start appearing such as change-over costs. Some employees may need to be trained on the new products which include members of marketing, sales, manufacturing and technical support teams. The distribution and sales channels also need to be setup in order to achieve the optimal time-to-market for the product being introduced. Also during this phase some engineering work may be required to fix product problems that can only be found after market introduction.
Maturity
A product reaches maturity when the manufacturing facilities have reached the
full capacity expected for the product. The sales groups are mostly focused on moving as much product out of the factories and into the distribution channel. A great deal of supply chain activity happens during this phase as well. For instance, the company needs to lower production and procurement costs as soon as possible on the new product to stay
competitive. For this, some effort needs to be invested in capturing economies of scale as volumes grow and in inventory policy monitoring. Furthermore, during this stage of the
product life, the company experiences an increase in the customer service and warranty costs since the products have been out in the market for some time by now and are being fully utilized by customers.
End-of-Life (EOL)
The end of a product's maturity, and the beginning of its EOL phase, is typically characterized by a sharp decrease in demand volume. At HP, this decline in volumes occurs when it introduces new products which incorporate new technologies which then cannibalize the demand for the product in the EOL stage. Of course, HP needs to
introduce these new products constantly to keep the pace of competition and meet customer demands. At this phase of the product life, inventory monitoring becomes important as the volumes may become unpredictable; e.g. some customers may refrain from placing regular orders in favor of waiting for a new product while others may build up their stock of the EOL product on news of its discontinuation. After this phase ends, the product is not available for purchase by customers.
Support
The support phase of the product lifetime consists mainly of customer support to clients. That is, HP is held liable for its products beyond the sale date until the warranty has expired. Aside from the inherent labor costs of processing warranty claims, there are costs related to reconditioning the returned product as well as holding spare parts in
warehouses around the world. In addition, although sometimes overlooked, the cost of keeping product data around even after the product is definitely discontinued could become significant and translate into stressed labor resources or increased IT expense. After this phase, the product is terminated but could be revived in the future for strategic reasons.
It should be apparent that the areas of the company that are affected by complexity depend on the phase of the product lifetime being considered. Figure 8 illustrates the specific phases of the product lifetime when complexity is active for these areas. Also of importance is the way in which complexity manifests itself in these functional areas. Some complexity costs depend on the volume of products sold as it is the case in inventory considerations. In other areas, this cost depends on the number of unique components used to manufacture the final product or even on the profit margin of a product since it affects inventory underage costs.q
Finally, we must emphasize that the effort to quantify these tradeoffs has the objective of enabling decision makers to have better information about the real costs of offering a new product. In the following sections, more detail about each complexity area as well as the main drivers of complexity within them is provided.
4.3 Development costs
The costs of Research and Development (R&D) in technology companies can be very high since they compete on innovation. Furthermore, the development of new
q Inventory underage costs or "shortage" costs are those incurred by the company when it is not able to
fulfill customer demand. The affected customers may decide to purchase the product from a competitor or choose to delay the purchase until HP is able to fulfill it.
products can vary widely in cost, making it very difficult to gauge the effect of supporting too many products in this area. We begin by examining our first hypothesis.
Hypothesis 1:
Product proliferation causes inefficiencies in the labor, prototyping materials and testing costs for the organization during product development.
First, the labor resources used in R&D tend to be less efficient when employees are shared across several different products. The origin of this inefficiency could be the difficulty of switching tasks continuously or even the higher probability of making mistakes. Thus, the incremental cost of adding a new product to be designed does not scale up linearly and the difference between the linear and non-linear growth in costs is a cost of complexity. Furthermore, most of the work performed in the R&D function is ground-breaking in nature; thus, it is used for new products that define a new platform or do not fit into previously existing platforms. Even though it is difficult to separate the complexity effects of offering individual SKUs and new platforms, an estimate can be generated through interviews. In HP's ISS, 10% of the R&D work is invested in incremental product development which is the total percentage of the budget spent on all SKU-related activities.
In addition, the prototyping material cost is typically unaccounted. Even though the R&D function typically works within a budget used to fund all product development ideasr, the budget is actually distributed across the different specific products. For
rR&D is considered an administrative overhead function whose costs are mostly fixed to a budget rather than variable on demand volumes.
example, product A may utilize a bigger part of this budget than product B; therefore, product A will need to be "responsible" for a larger portion of the budget. Furthermore, if the attributes of product A are similar to a new product that we want to introduce, say product C, we could estimate how much product C will spend in R&D before making the decision to offer it.
The testing costs of complexity can be tricky to quantify because they don't scale up linearly with the number of SKUs. For some products, it is necessary to test the new accessory against both new and existing products (or existing accessories against the new server SKU.) If server SKUs are not discontinued at the same rate as new products are introduced, testing efforts could grow exponentially. That is, keeping older accessories and servers in a product line causes expenses such as those incurred in locating old data, diagnostic routines, circuit boards and maintaining information longer than one would like. These costs can grow exponentially since HP has a policy of having parts that work with all older models (i.e. backwards-compatibility.)
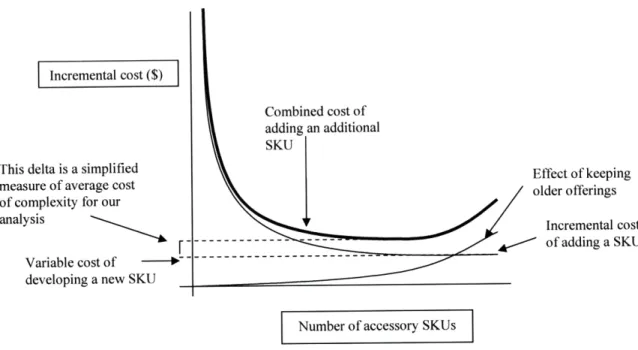
When offering a new electronic card as an accessory to a server, the added cost of developing and testing this new card with the existing systems is typically included in cost accounting. However, the cost of maintaining an older card model in conjunction with the new card is not. These costs are incurred when new software routines need to be added to the testing code, time is spent in validating their interoperation, and in documentation efforts. Of course, this is an example of complexity at the feature, rather than SKU, level. However, this example helps to motivate the dynamics of the analysis needed for quantification of complexity costs. Figure 9 illustrates these dynamics.
I Incremental cost($)
This delta is a simplified measure of average cost of complexity for our analysis
Variable cost of --developing a new SKU
Combined cost of
Effect of keeping older offerings
Incremental cost of adding a SKU
I Number of accessory SKUs I
Figure 9 - An example of the dynamics of testing costs of server accessories
Figure 9 shows that as the number of SKUs increases, the incremental costs of testing initially appear to decrease. However, as depicted in the diagram, these costs reach a minimum and actually start increasing once again due to the complexity in maintaining older offerings as explained above.
Let us define the subdivisions of costs that need to be quantified in order to better understand the costs of complexity in the R&D function. In the ISS product line, the
following diagram shows appropriate subdivisions.
We divide the cost of complexity in this area into pure R&D costs and New Product Introduction (NPI) costs as depicted in Figure 10. The former costs are associated with ground-breaking product research while the latter are related to
supporting R&D activities on an ongoing basis. NPI related costs include NPI Training Support, Test Strategy/DfX, Product Data Management, Supplier Quantification, and Test & Diagnostics costs. The following provides more details on these categories.
Definitions
R&D complexity costs are related to pure research; i.e. developing ground-breaking innovations
NPI Training Support includes the generation of training material to support new products.
Test Strategy /DfX are activities related to testing procedures and manufacturability readiness.
Product Data Management involves setting up MRP and Product SKU number database.
Supplier Qualification encompasses tooling expenses, samples and travel to re-qualify suppliers.
Test & Diagnostics involve materials and labor required to test all products.
4.4 Sales & Marketing costs
The sales and marketing process, aside from being the main force behind the generation of new SKUs in the product line, also adds complexity and unaccounted costs in its own operations. These costs can be sizeable and come from channel inventory, price protection, partner discounts, and marketing collateral.
Hypothesis 2:
There are complexity costs driven by inventories in the channel as well by