HAL Id: hal-01090224
https://hal.archives-ouvertes.fr/hal-01090224
Submitted on 5 Dec 2014
HAL is a multi-disciplinary open access
archive for the deposit and dissemination of
sci-entific research documents, whether they are
pub-lished or not. The documents may come from
teaching and research institutions in France or
abroad, or from public or private research centers.
L’archive ouverte pluridisciplinaire HAL, est
destinée au dépôt et à la diffusion de documents
scientifiques de niveau recherche, publiés ou non,
émanant des établissements d’enseignement et de
recherche français ou étrangers, des laboratoires
publics ou privés.
Optical Feedback Interferometry sensor for flow
characterization inside ex-vivo vessel
Adam Quotb, Evelio Esteban Ramírez-Miquet, Clément Tronche, Julien
Perchoux
To cite this version:
Adam Quotb, Evelio Esteban Ramírez-Miquet, Clément Tronche, Julien Perchoux. Optical Feedback
Interferometry sensor for flow characterization inside ex-vivo vessel. IEEE SENSORS 2014, Nov 2014,
Valencia, Spain. pp.PP. 362-365. �hal-01090224�
Optical Feedback Interferometry sensor for flow
characterization inside ex-vivo vessel
Adam Quotb
∗, Evelio E. Ram´ırez-Miquet
∗†, Cl´ement Tronche
∗and Julien Perchoux
∗∗CNRS, LAAS, 7 Avenue du Colonel Roche, F-31077 Toulouse Cedex 4, France
Universit´e de Toulouse; UPS, INSA, INPT, ISAE, UT1, UTM, LAAS, F-31077 Toulouse Cedex 4, France
†Centro de Aplicaciones Tecnol´ogicas y Desarrollo Nuclear. Calle 30 No. 502 Miramar 11300, Havana, Cuba
Abstract—Pressure myograph systems allow the study of pharmacological effects of drugs and other vasoactive compounds on small isolated vessels by image processing. In this work, we present a new pressure myograph system based on Optical Feedback Interferometry (OFI) sensor that gives information about local velocity in fluids and enables reconstruction of a velocity profile inside a vessel.
OFI is a self-aligned interferometric technique that uses the laser as both the light source and the receiver thus offering high sensitivity, fast response, and a simple and compact optical design. The local Doppler flow velocity is directly measured inside ex-vivo rat vessel with a step of 100 µm thus avoiding the need to use complex image processing and models based profile calculation for extracting flow velocity. This technique will be useful to investigate hemodynamics in microcirculation by measuring unsteady irregular blood.
I. INTRODUCTION
The need to accurately measure physiological functions and properties of small arteries, veins and other vessels is well established [1]. Vascular smooth muscle cells, located inside vessel wall play a key role in contraction and relaxation of arteries [2].
These vasoconstriction and conversely vasodilatation ef-fects are driven, in normal conditions by the central nervous system or, in case of disease, by vasodilative or vasocontrictive drugs. In the perspective of vessel characterization, two kind of measure systems exist:
• The isometric method, which measures changes in force from dissected resistance arteries while the length (diameter) remains constant.
• The isobaric method, which measures changes in diameter while transmural pressure across the artery wall is kept constant.
This paper will be focused on isobaric or pressure myo-graph systems. On these sensors, a single vessel is isolated on two glass cannulas, pressurized and flushed by a liquid to simulate blood flow [3]. Then, the artery is imaged on a video monitor and diameter is assessed by contrast detection of the arterial wall in the dimension analyzer. Investigation on myogenic response, vasodilatative effect and endothelium behavior can be done with this kind of system [4].
In our sensor, the vessel cannulation set up is inspired from myograph systems but instead of using high resolution camera and microscope sensors, OFI is employed.
In the OFI process, the light emitted from a laser source is backscattered from a moving target and re-enters in the laser cavity. This optical feedback produces a modulation of the optical output power. At the micro scale, the maximum Doppler frequency of the interferometric signal and the relative flow velocity are correlated [5].
For biomedical sensing, OFI sensors are ideally suited for measurements of blood flow: local flow in rat brain [6] or extra corporal circulation ([7], [8]). By moving the sensor across a microfluidic channel, Campagnolo et al. ([5]) provide a system able to measure parabolic profile of velocity inside a capillarity tube.
This study proposes a new sensor for myograph systems able to measure local flow velocity with a 100 µm step and, by scanning a whole vessel section, a flow profile is extracted. Internal vessel diameter is estimated from the profile base width and a 2D vessel velocity image is computed.
II. MATERIALS AND METHODS
A. OFI theory
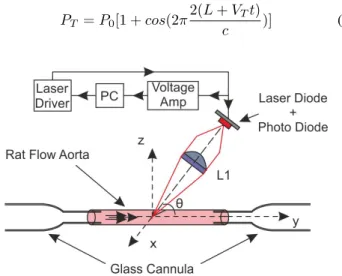
The more generalized sensing method used in laser diodes is the measurement of the optical power changes in the photodiode (PD) due to optical feedback induced by scattering targets. The relation of the emission power with target velocity is given by the formula:
PT = P0[1 + cos(2π
2(L + VTt)
c )] (1)
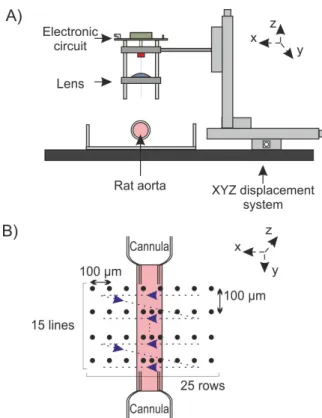
Fig. 2. OFI sensor: A) Lateral view, B) Top view of the aorta scanning
where P0is the optical power of the laser without feedback,
L is the distance between the target and the laser, c is the speed of light, t is time and VT is the target velocity.
OFI sensors are well suited as alternative optofluidic sys-tems as long as there is a minimal concentration of particles embedded in the fluid acting as scatters centers. OFI signals from fluid flow contain information on particles velocity in the fluid in a wide range. The power spectral density analysis of the Fast Fourier Transformation (FFT) of temporal signals allows the direct calculation of flow velocity, which is related to the fundamental Doppler frequency FDopplermax in the
spectrum as follows:
VT =
λ ∗ FDopplermax
2 ∗ η ∗ cos(θ) . (2) where η is the refractive index of the liquid flushed, θ the angle between the laser and the flow direction and λ the laser wavelength.
B. Aorta preparation
From frozen Wistar rat, carotid aorta is extracted and cannulated on two glass cannulas. At both extremities, the aorta is held in place with two sutures (5-0 USP).
It is then pressurized and flushed by a liquid composed by a ratio of 10:1 of Phosphate Buffered Solution and milk. The speed flow and pressure are considered as constant during all the experiment because of the use of a high precision pressure pump (Fluigent MFCS-EZ-4C). The laser sensor is focalized on the center of the vessel where the Doppler frequency reaches its maximum (figure 1).
C. OFI Sensor signal recording
Figure 2.A shows an overview of OFI sensor used for this study. It is composed by three main parts:
• XYZ displacement system. Three miniature motorized linear stages (Zaber-LSM 50A) move the laser with a resolution of 0.1905 µm and are controlled by computer.
• One plano-convex optical len (LA1951-B).
• A compact electronic system that realizes both laser driving and signal amplification functions. The proto-type fits on a 5x5 cm PCB.
The amplified photodiode signal is digitized by a National Instruments card (NI USB 6251) connected by USB to a computer. For each measurement point 4096 samples are recorded at a frequency of 1MHz.
The optical setup consists on a laser diode (HITACHI HL7851G) emitting at 785 nm and driven by an injection current of 50 mA. The laser is coupled to a single lens of 25.4 mm focal length and the collimated radiation is pointed to the vessel with angle of 86°.
The 2D automatic scanning protocol is presented in figure 2.B. The scan mechanical system and laser’s photodetector signal recording are synchronized using Labview VI. For one position, 10 succesively temporal signals are recorded and processed off-line using a Matlab script/code. The funda-mental Doppler frequency provides the information necessary to calculate the local velocity according to equation 2, thus kinematic properties of the flow can be easily determinated.
Because of the size of a rat aorta is bewteen 500 µm and 1 mm, we have selected a scan step of 100 µm which is also analog to the resolution of the camera. For each position, the
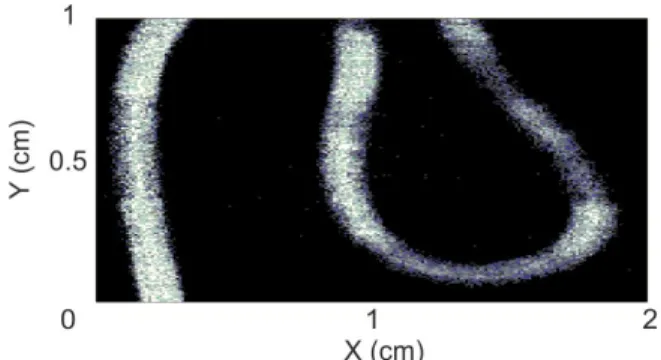
Fig. 4. 2D velocity mapping on a fluidic device
OFI sensor records 10 measurement points in order to make a FFT average. At the end of the recording process, each position data are stored in a text file with 40960 samples (4096 samples x 10 records). For an aorta scanning area of 3.75 mm2, 10 minutes and 160 Mb of memory are required.
D. OFI Sensor signal processing
In [5], the signal processing consisted in the fitting of the OFI signal spectrum by a complex exponential function.
This method, despite the excellent results obtained for the estimation of the fluid velocity, was requiring a rough calibration of several coefficients in the fitting function before running the fitting algorithm itself. Thus it was not possible to run the signal processing for the full scan in an automated way.
The signal processing approach have been changed and, by setting a threshold level in the electrical spectrum of the OFI signal, the maximum Doppler frequency is evaluated.
The signal processing block for one position is presented in figure 3. For each position, 10 FFTs of the photodiode signal are computed, averaged and smoothed. The maximum Doppler (FDopplermax) is extracted by spectrum thresholding
and, according to equation 2, maximum velocity (VT) is
measured.
Figure 4 shows an example of a 2D velocity mapping on a plastic tube (500 µm internal diameter), with a 10 µm scanning step on an area of 2 cm2.
III. RESULTS
A. Image processing diameter assessment
From the literature, internal Wistar rat carotid have been evaluating around 850 µm [2]. Figure 5 shows a 220 x 182 pixels picture of the cannulated and prezurissed carotid aorta. One pixel correspond to 100 µm and internal diameter is evaluated by taking suture thread as reference. In that context, after an image processing, the internal diameter have been computed in between 800 µm and 900 µm.
B. OFI diameter assessment
1) Sensor calibration: For the first use, a calibration proce-dure has to be done prior to aorta extraction. Indeed, because of the optical setup, the laser beam position is unknown and has to be focus in the middle of the channel.
Fig. 5. Cannulated rat aorta: Red rectangle corresponds to OFI scanned area
In that perspective, a calibration scan is done on a well known diameter tube and fluid. The sensor is calibrated with a solution of milk (1%) and distilled water (99%) flushed inside a plastic tube at a constant velocity. Then, the beam is manually adjusted along the three axis and θ angle where the OFI signal reaches its highest frequency.
When the middle of the channel is found, a scan is per-formed and base velocity profile width is evaluated. Then the result is compared to the tube diameter in order to determine the threshold level. In this study, the threshold is set to 14 dB. 2) Aorta 2D imaging: Before scanning, the laser beam is focused on the centre of the aorta in the same way for the calibration procedure. Then it is moved towards the x axis through the scan start point. As soon as the fluid velocity is stabilized the complete 2D laser scan is performed on a surface of 3.75 mm2. In figure 5, the red rectangle represents the scan
zone with a width of 2.5 mm (x axis) and a height of 1.5 mm (y axis). For each scan line (along x axis), an aorta OFI fluid velocity profile is computed from the maximum Doppler frequency extracted from spectra.
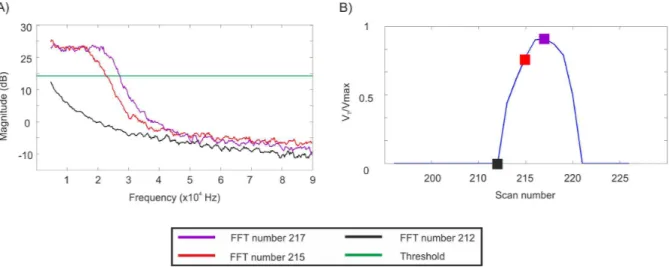
Figure 6 presents results from one line scan where three points of interest have been highlighted (outside aorta (black), 300 µm (red) and 500 µm (purple) inside the aorta). FFT spectra of these points are shown in figure 6.A and fluid velocity profile in figure 6.B. On a first hand we can notice a difference between spectrum outside the aorta (black curve) and inside (red and purple curves). In a second hand, despite the fact that there are 200 µm between the two positions, maximum Doppler frequencies are well distinguish.
The fluid velocity profile (figure 6.B) is composed by 25 measurements points and from the base profile width, an aorta diameter of 850 µm is measured. Moreover, Poiseuille’law de-scribes the fluid velocity profile inside a tube as parabolic [5]. Even without any fitting, from the experimentally measured flow velocity profile plotted in figure 6.B, a parabolic shape is observed. The complete aorta scan and the comparison with the raw image is presented in figure 7. From the OFI sensor image, the aorta is clearly visible and the fluid velocity distribution can be analyzed. High speed flow (between 0.7 and 1 normalized speed) is observed on 300 µm in the middle of the aorta. Near
Fig. 6. One line scan on rat aorta by OFI: A) Three FFT spectra: outside the aorta (black), 300 µm (red) and 500 µm (purple) inside the aorta, B) Fluid velocity profile composed by 25 scan points
aorta walls, velocity decreases drastically due to the absence of particles. OFI sensor can provide with high precision the localization of aorta walls.
Fig. 7. Rat aorta imaging: A) 2D rat aorta fluid velocity imaging captured by OFI and B) Raw image of the scanning zone captured by camera
IV. CONCLUSION
The feasibility to use an OFI sensor for flow character-ization inside ex-vivo rat aorta has been demonstrated. Two main informations are provided: internal vessel diameter is estimated from the profile base width and local velocity infor-mation is extracted from the correlation between OFI signal and position. Because OFI sensor is based on basic signal processing methods, electronics and optics, it differs from the well establish technology. In addition, with this sensor coupled to myograph systems, the investigation on hemodynamics in microcirculation by measuring unsteady irregular blood is now a reality for biomedical field and medicine.
In this study, a 100 µm scan step has been used. By accepting a compromise between precision and recording time, we will reduce this scan step to 10 µm in order to provide a high definition fluid velocity image. In that perspective, future works on OFI sensors will be focused on the mechanical
displacement system. Indeed, the scanning protocol is time consuming: on 600 seconds dedicated to the scanning, only 2 % of the time is used for OFI signal acquisition and recording. The time remaining is consumed by the mechanical system. Due to this main drawback, new displacement systems based on mirrors or continuous scanning will be further developed in our future OFI sensors.
ACKNOWLEDGMENT
This work has been supported by the National Polytechnic Institute of Toulouse (INPT) through the grant Bourse Nou-veaux Entrants 2013 and the french embassy in Havana.
REFERENCES
[1] T. Kamishima and J. M. Quayle, Small Vessel Myography, in Essential Guide to Reading Biomedical Papers, John Wiley & Sons, Ltd, 2012, p. 39-48
[2] X. Lu et G. S. Kassab, Assessment of endothelial function of large, medium, and small vessels: a unified myograph, Am J Physiol Heart Circ Physiol, vol. 300, 1, p. H94-H100, 2011.
[3] P. S. Clifford, S. R. Ella, A. J. Stupica, Z. Nourian, M. Li, L. A. Martinez-Lemus, K. A. Dora, Y. Yang, M. J. Davis, U. Pohl, G. A. Meininger, et M. A. Hill, IemphSpatial Distribution and Mechanical Function of Elastin in Resistance Arteries: A Role in Bearing Longitudinal Stress, Arteriosclerosis, Thrombosis, and Vascular Biology, vol. 31, 12, p. 2889-2896, 2011.
[4] J. G. McCarron, C. A. Crichton, P. D. Langton, A. MacKenzie, and G. L. Smith, Myogenic contraction by modulation of voltage-dependent calcium currents in isolated rat cerebral arteries , The Journal of Physiology, vol. 498,p. 371-379, 1997.
[5] L. Campagnolo, M. Nikoli´c, J. Perchoux, Y Lim, K. Bertling, K. Loubi`ere, L. Prat, A. Raki´c, et T. Bosch, Flow profile measure-ment in microchannel using the optical feedback interferometry sensing technique, Microfluid Nanofluid, vol. 14, n 1-2, p. 113-19, 2013. [6] E. Figueiras, R. Oliveira, C. Loureno, R. Campos, A. Humeau-Heurtier,
R. Barbosa, J. Laranjinha, L. Requicha Ferreira, et F. M. Mul, Self-mixing microprobe for monitoring microvascular perfusion in rat brain, Med Biol Eng Comput, vol. 51, n 1-2, p. 103-112, 2013.
[7] S. Donati et M. Norgia Self-Mixing Interferometry for Biomedical Signals Sensing, Selected Topics in Quantum Electronics, IEEE Journal of, vol. 20, 2, p. 6900108-6900108, 2014.
[8] A. Pesatori, M. Norgia, L. Rovati. Self-Mixing Laser Doppler Spectra of Extracorporeal Blood Flow: A Theoretical and Experimental Study. IEEE Sensor Journal, vol.11 (2011)