HAL Id: hal-00496888
https://hal.archives-ouvertes.fr/hal-00496888
Submitted on 1 Jul 2010
HAL is a multi-disciplinary open access
archive for the deposit and dissemination of
sci-entific research documents, whether they are
pub-lished or not. The documents may come from
teaching and research institutions in France or
abroad, or from public or private research centers.
L’archive ouverte pluridisciplinaire HAL, est
destinée au dépôt et à la diffusion de documents
scientifiques de niveau recherche, publiés ou non,
émanant des établissements d’enseignement et de
recherche français ou étrangers, des laboratoires
publics ou privés.
Theoretical and Experimental Study of the Phase Noise
of Opto-Electronic Oscillators based on High Quality
Factor Optical Resonators
Aude Bouchier, Khaldoun Saleh, Pierre-Henri Merrer, Olivier Llopis, Gilles
Cibiel
To cite this version:
Aude Bouchier, Khaldoun Saleh, Pierre-Henri Merrer, Olivier Llopis, Gilles Cibiel. Theoretical and
Experimental Study of the Phase Noise of Opto-Electronic Oscillators based on High Quality Factor
Optical Resonators. IEEE International Frequency Control Symposium, Jun 2010, Newport Beach,
United States. 5p. �hal-00496888�
Theoretical and Experimental Study of the Phase Noise
of Opto-Electronic Oscillators based on High Quality
Factor Optical Resonators
A. Bouchier, K. Saleh, P.-H. Merrer, O. Llopis
LAAS-CNRS
Université de Toulouse ; UPS, INSA, INP, ISAE ; LAAS Toulouse, France
G. Cibiel
CNES Toulouse, France
Abstract— In order to improve the phase noise of high purity
OEO based on optical resonators, like resonant fibre rings, these oscillators have been theoretically studied in terms of white frequency noise. We present here the optimization of the performances of a fibre ring resonator and the experimental phase noise results we obtained for the OEO based on an optimized very high quality factor optical resonator.
I. INTRODUCTION
The design of new compact and high performances oscillators is linked to the investigation of new resonators. A disadvantage of classical microwave (electromagnetic) resonances is that their quality factor (Q) decreases when the frequency increases, limiting their efficiency to build high purity sources at very high frequencies (millimetre wave range). The best resonators performances in terms of quality factor are today obtained using whispering gallery modes in sapphire crystal cylindrical resonators, with an unloaded
quality factor close to 2 105 around 10 GHz. An increase of
this quality factor is possible with the use of cryogenic sapphire resonators, leading to unloaded quality factors higher
than 109 around 10 GHz [1]. However, this solution is bulky
and difficult to implement in practical applications.
An elegant method to reduce the oscillators’ dimensions and/or to increase the Q factor is to carry the microwaves on another wave, like acoustic or optical waves [2] for example. In this study, an optical carrier at 1.55 µm is used. This carrier is a laser developed for telecommunication applications. Thanks to this optical carrier, the microwave resonator becomes an optical resonator, with higher Q and relatively low dimensions due to the shorter wavelengths. It is thus possible to design new devices featuring better performance than classical microwave devices.
The optical resonator generates an optical frequency comb with microwave spacing. This spacing, the free spectral range (FSR), is directly related to the resonator dimensions. Such an
optical resonator features a 3 dB bandwidth which is
maintained when it is used to filter microwaves. Thus, to the
optical Qopt factor corresponds an equivalent RF quality factor
QRF. This quality factor is the product of Qopt and the RF to
optical frequencies ratio (1).
. (1)
Thanks to this relation, it is clear that the RF equivalent quality factor increases with the RF frequency for a fixed optical frequency. To reach quality factors as high as those
obtained with microwave resonators, Qopt should be higher
than 109 because of the frequency ratio, which is as high as
104 for a carrier at 1.55 µm (around 194 THz) and a
microwave signal around 20 GHz. With this challenging optical Q factor, these optical resonators can lead to an elegant alternative to microwave resonators and also to more compact devices if the optical parts can be integrated or assembled in a small volume.
The use of an optical carrier in microwave photonics domain is in fact a classical solution in the case of the optical delay lines. These lines are few-km-long optical fibres, with
equivalent RF quality factors that can reach 106 at 10 GHz.
They have been used for example to stabilize oscillators [3]. Although they are easy to use and actually well-known, they remain bulky devices and there thermal stabilization is difficult.
In the case of optical resonators, a first solution is similar to the high Q RF resonators: the use of optical WGM resonances [4,5]. These devices are spheres, torus or disks, in which the optical wave circulates on the whispering gallery modes. These structures have to be transparent at 1.55 µm, and are constituted generally from silica, quartz, calcium
(CaF2) or magnesium fluoride (MgF2) and so on... These
demonstrated values from 108 to 1011 at 1.55 µm [4,5], but
their use in a system is delicate, particularly the coupling of the optical carrier is really difficult with the use of tapered fibres or prisms, for example.
A last approach is the use of the ability of fibered optics, which has been developed for telecommunications around 1.55 µm, and we present here the principle and use of fibre ring resonators. To predict their efficiency in terms of quality factors and phase noise when they are included in an optoelectronic oscillator (OEO) scheme, a simulation tool is presented here. The results are compared with experimental data, which have been fully described in [6]. The optimization approach of the white frequency noise contribution we propose is an extension to the OEO case of a classical method used for microwave oscillators [7]. The experimental results obtained with a new optimized resonator are also presented.
II. RESONANT FIBRE RINGS
Optical telecommunications leaded to the development of optical fibres, pigtailed lasers emitting around 1.55 µm, and passive or active optoelectronic components. They allow us to build easily at this wavelength an optical resonator using two fibered couplers linked with single-mode fibres at 1.55 µm like Corning SMF28 fibres (Fig. 1). This resonator will thus generate a transverse single frequency comb. Thanks to the compatibility with pigtailed lasers, the coupling of the optical carrier in the optical resonator is stable and the system is potentially integrated in a compact device.
The ring we study here has a total length of 10 m and is constituted by two optical couplers with coupling ratios T/κ close to 90/10 % (Fig. 1). The connection between the fibres is made through splices. This ring generates a frequency comb with a FSR of 20 MHz.
Figure 1. Scheme of the fibre ring resonator and resonant modes in transmission and absorption.
Figure 2. Resonance of the stabilized 10m-long fibre ring.
The characterization of the fibre ring thanks to the stabilization of the laser on a ring resonance [6] leads to the
determination of a quality factor of 2x10⁸ at 1.55 µm (Fig. 2).
III. OPTOELECTRONIC OSCILLATORS
The OEO we have built thanks to this fibre ring is schematically described on Fig. 3 and has been fully described in [6].
Figure 3. Principle of the optoelectronic oscillator at 10 GHz. The phase noise spectrum of this OEO and its spectrum have been measured with an Agilent E5052B signal analyzer (Fig. 4).
Figure 4. Phase noise measurement and spectrum (in inset) for the optoelectronic oscillator at 10 GHz.
This phase noise spectrum presents four different areas. In the first one, between 10 Hz and 1 kHz, the noise slope of -30 dB/dec corresponds to an important 1/f frequency noise contribution. The spurious peaks that are visible between 0.1 and 1 kHz can be due to thermal or mechanical fluctuations of the fibre ring resonator or another noise linked to the optical amplifier. The white frequency noise contribution dominates the spectrum between 1 and 400 kHz, as we can see it through the -20 dB/dec slope of the phase noise. The phase noise floor appears after 400 kHz with a value of about -120 dBc/Hz. The final decrease of the noise above 3 MHz is linked to the filter effect of the dielectric resonator.
The knee frequency fc at the frontier between the white
frequency noise and the phase noise floor is linked to the
loaded microwave quality factor (QRF) by the relation (2)
(2) frequency transmission frequency absorption coupler 1 coupler 2 T T κ κ p p splices losses α -85 -80 -75 -70 -65 9,998 10,000 10,002 10,004 10,006 10,008 10,010 A m p lit u d e ( d B) Frequency (GHz) δν = 1 MHz PDH retroaction
Laser @ 1.55µm MZM resonatorOptical photodiode
characterization phase shifter MZM : laser modulation at OEO frequency oscillation frequency selection dielectric resonator
ϕ
101 102 103 104 105 106 107 -140 -120 -100 -80 -60 -40 -20 0 20 40 Phas e n o is e (d Bc /H z) Frequency (Hz) 10,1876 10,1878 10,1880 10,1882 10,1884 -100 -80 -60 -40 -20 0 Po w e r ( d Bm ) Frequency (GHz)with fRF the microwave frequency [8]. With a frequency fc at
this limit of 400 kHz, the loaded microwave quality factor is
1.2 104 at 10 GHz, which is in good agreement with an optical
quality factor of 2 108 at 1.55 µm for the resonator.
In spite of the relatively good loaded quality factor of the fibre ring, the OEO presents a high phase noise level. Effectively, the carrier to noise ratio due to this resonator is not optimized and the transmission losses of the ring are important. These losses are mainly due to the coupling ratio of its couplers. They directly influence the white frequency noise of the oscillator.
The phase noise induced by the optical and electrical amplifiers can have an effect on the 1/f noise. We have thus studied their influence thanks to residual phase noise measurements. The measured residual phase noise can then be introduced in a simplified model of the OEO, following Leeson’s approach [8]. Taking into account the OEO Q factor, we can see that their contribution to the OEO phase noise is not high enough to really influence the oscillator behaviour, with a level about 15 to 30 dB lower than the measured OEO phase noise (Fig. 5).
Figure 5. Contribution of the amplifiers phase noise to the OEO noise and comparison with the measured OEO spectrum at 10 GHz. The excess noise may be induced by the laser stabilization loop, the laser noise and/or an optical resonator that are not completely optimized and may present some thermal, mechanical and electronic instabilities at low frequencies. However, for the white frequency noise part of the spectrum, the noise contributions can be more easily calculated as they are related to the optical carrier to the noise ratio. A theoretical study of the contribution of the white frequency noise of the optical resonator has thus been performed.
IV. WHITE FREQUENCY NOISE SIMULATION OF THE OEO
The theoretical study of the OEO occurs in two steps : we have first to model the resonator itself and then its influence on the oscillator phase noise.
A. Fibre Ring Resonator modeling
The fibre ring is modelled in terms of electrical fields [9]. With this model, we can predict the FSR, the mode width and thus the optical quality factor of the resonator.
The ring is described through its length, the characteristics of the couplers in terms of transmission (T), coupling (κ) and
losses (p) coefficients. We also take into account the intrinsic losses (α) of the ring such as splicing losses (Fig. 1).
B. White Frequency Noise modeling
The OEO white frequency noise contribution, resulting from the optical carrier to noise ratio is then evaluated. Inside the OEO loop bandwidth, it depends on the offset frequency fm, the optical quality factor Qopt and the noise to carrier ratio
(NCR) as shown in relation (3).
20. log .√ . . 10. log (3)
The NCR (4) depends on the measured optical power Pm, the
sensitivity of the photodetector σ, the modulation ratio m, and on the different noise contributions:
. . (4)
with the thermal noise Sth (5), including the temperature T, the
Boltzman constant k, and the photodiode load resistance R . .
(5)
the shot noise Sshot (6), with the elementary charge q
2. . . (6)
the laser noise SRIN (7), taking into account the relative
intensity noise (RIN) of the laser.
. . (7)
C. Comparison with the experimental phase noise
With this model, we can completely determine the couplers characteristics and the ring losses. In this aim, we compare the experimental measurement of the OEO phase noise to the simulated result. By adjusting the couplers coefficients and losses and the ring losses, we can fit the experimental data. The uniqueness of the solution is guaranteed when we add to this fit the comparison between
the theoretical Qopt and the experimental value.
Figure 6. Simulated phase noise spectrum (in blue) for the white frequency noise contribution area (1 to 400 kHz) and experimental results (in red).
-140 -120 -100 -80 -60 -40 -20 0 20
1E+1 1E+2 1E+3 1E+4 1E+5 1E+6 1E+7
Ph ase n o ise (d B c/ H z) Frequency (Hz)
OEO phase noise Amplifiers contribution -140 -120 -100 -80 -60 -40 -20 0 20
1,E+01 1,E+02 1,E+03 1,E+04 1,E+05 1,E+06 1,E+07
P h ase n o ise (d B c /H z) Frequency (Hz)
The comparison between the experimental and the theoretical data is shown in Fig. 6. The model of white
frequency noise is valid only from 1 to 400 kHz (fc),
frequency range on which the phase noise is dominated by the white frequency noise contribution. With a good agreement between the model and these data (phase noise spectrum and
Qopt value), we can determine that the transmission T of the
couplers is 0.86 ± 0.04, corresponding to a coupler ratio T/κ of 86/14 % with couplers losses p around 0.59 dB. The splices losses α are determined to be close to 0.005 dB.
V. OPTIMIZATION OF THE FIBRE RING RESONATOR
The Qopt factor of the fibre ring and its contribution to the
OEO phase noise are closely linked to the fibre length, the characteristics of the couplers and the losses in the ring. The decrease of the fibre ring losses and of the coupling factors of
the couplers increases Qopt. However the decrease of the
coupling factors degrades also the carrier to noise ratio. We thus should find a trade-off between low coupling coefficients,
and thus high Qopt, and high NCR to obtain the best results in
terms of OEO phase noise (3). For this analysis of the influence of the ring parameters, we suppose that the both couplers are identical.
A. Influence of the fibre ring length
The fibre ring length has a direct influence on the resonator quality factor. Effectively the quality factor increases with the fibre length. For example, a fibre ring
resonator built on ideal 99/1 % couplers presents a Qopt of
2x10⁸ at 1.55 µm for a length of 1 m, and a Q
opt of 5x10⁹ for a
length of 20 m. In our case, we limit the total ring length at 20 m. This limitation is due to our OEO experimental set-up that includes a dielectric filter with a full-width at half-maximum of 3 MHz, which aim is to select one RF resonance. To guarantee a single frequency behaviour of the OEO, the side mode suppression ratio has to be high enough and the resonator FSR higher than 10 MHz. We will thus investigate on a 20 m-long fibre ring resonator for the study of the influence of the other parameters.
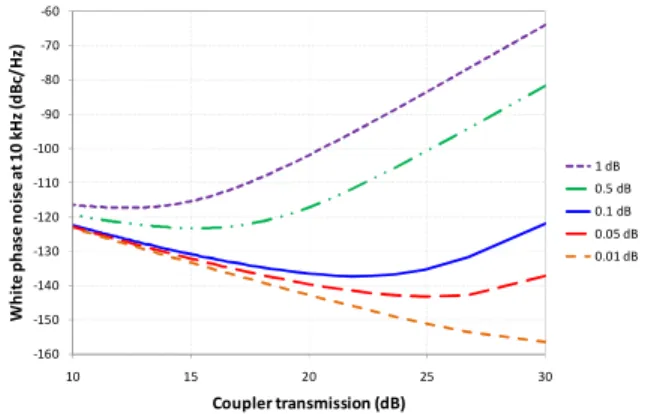
B. Influence of the coupling factor and losses of the couplers
To study the influence of the couplers losses on the choice of coupler transmission, we consider that the intrinsic losses of the ring are fixed to the splices losses value (0.02 dB). Fig. 7 shows the presence of an optimum value of coupler transmission for each value of couplers losses.
For example, a couplers losses value of 0.05 dB needs the use of 99.2/0.8 % (21.1 dB) couplers and for couplers losses of 0.5 dB, we should use 94.3/1.3 % (12.5 dB) couplers.
In the same time, the quality factor of the resonator strongly decreases with the increase of the losses, from a value
of 5x10⁹ without losses to 0.1x10⁹ for 1 dB losses in the case
of couplers ratio of 99/1% (20 dB).
Figure 7. Influence on the coupler transmission T on the computed OEO phase noise for different values of couplers losses p from 0 to 1 dB. The
coupler transmission is corrected from the losses on this curve.
C. Influence of the intrinsic losses of the ring
The couplers are now considered as ideal (without losses). Fig. 8 presents the influence of splices losses, for example, on the OEO phase noise (white frequency noise only).
Figure 8. Influence on the coupler transmission T on the computed OEO phase noise for different values of intrinsic losses α from 0.01 to 1 dB.
As with excess losses in the couplers, when the losses increase, the quality factor decreases and the phase noise present an optimum value in terms of couplers transmission. For losses of 0.05 dB, the optimal coupler ratio is 99.7/0.3 % (24.9 dB).
For a coupler ratio of 99/1% (20 dB), the quality factor
decreases from a value of 5.1x10⁹ with 0.01 dB losses to
0.1x10⁹ for 1 dB losses.
D. Optimization of the fibre ring resonator
With this analysis, a fibre ring constituted on two 10m-long fibres, with total splices losses of 0.05 dB and on couplers with typical losses of 0.1 dB, the optimum of phase noise should be obtained for a ratio of 98.7/1.3 % (19 dB). In this case, we can expect an optical quality factor close to
1.6x10⁹ at 1.55 µm and a phase noise level of -130 dBc/Hz at
10 kHz from the carrier. We can thus notice that the best performances in terms of phase noise do not correspond to the best quality factors for the resonators. We thus have to respect a trade-off between these two parameters.
-160 -140 -120 -100 -80 -60 -40 10 15 20 25 30 Wh it e p h as e n o ise a t 10 kH z (d B c/ H z)
Corrected coupler transmission (dB)
1 dB 0.5 dB 0.1 dB 0.05 dB 0.01 dB 0 dB -160 -150 -140 -130 -120 -110 -100 -90 -80 -70 -60 10 15 20 25 30 W h it e pha se noi se a t 1 0 k H z (d B c/ H z) Coupler transmission (dB) 1 dB 0.5 dB 0.1 dB 0.05 dB 0.01 dB
VI. NEW OEO BASED ON AN OPTIMIZED FIBRE RING RESONATOR
Thanks to this analysis, we have designed a new fibre ring of 20m, with couplers ratio of 99/1 %. The stabilization of the laser on a resonance peak of this resonator leads to a measurement of a mode width of 38 kHz (Fig. 9), and thus to
an optical quality factor of 5.1x10⁹ at 1.55 µm. With this
measurement, we have been able to estimate the splice losses to 0.01 dB and the couplers losses to 0.04 dB. For these characteristics of the ring, the contribution of the white frequency noise is expected to be at a level of -120 dBc/Hz at 10 kHz from the carrier, taking in consideration that a relatively low laser power has been used in this experiment.
Figure 9. Resonance of the stabilized 20m-long fibre ring. This fibre ring has been used to build an OEO at 10 GHz, which phase noise has been measured (Fig. 10).
Figure 10. Phase noise measurements for the 10m-long ring based OEO (in red) and the new 20m-long ring based OEO (in blue). The green dashed curve shows the contribution of the white frequency noise of the 20m-long
ring on the OEO phase noise.
We can observe that the phase noise level has effectively been improved with a level of -110 dBc/Hz at 10 kHz from the
carrier, and about -30 dBc/Hz at 10 Hz offset. The corner
frequency confirms a RF quality factor of 2.5x10⁵ at 10 GHz
for the OEO.
Nevertheless, the white frequency noise contribution is not predominant any more, as we can see on the comparison between the simulation and the experimental data. The 1/f noise contribution seems now to be more important in this resonator. We thus have to carefully study it to understand its origins in order to further improve this phase noise result.
VII. CONCLUSION
Optical resonators allow the achievement of really high quality factors in the microwave frequency range, while they guarantee low dimensions. Fibered resonators, like fibre ring resonators, are easy to integrate and use. However, the OEO is a complex system in which the Q factor is not the only parameter to optimise in order to get a good phase noise performance. We have studied in this paper the white frequency noise contribution to the OEO phase noise, and we have shown that there is a trade-off to find between the resonator loaded Q and the optical signal to noise ratio. An important improvement of the phase noise performance has been demonstrated. However, a close to 1/f type noise limits now the performance of the system. Further investigations have now to be performed for a better understanding and reduction of this noise contribution.
REFERENCES
[1] A.N. Luiten, A.G. Mann and D.G. Blair, “Ultrahigh Q-factor cryogenic sapphire resonator”, Electron. Letters, vol. 29 (10), pp 879-881 (1993) [2] L. Maleki, S. Yao, Y. Ji and V. Ilchenko, “New schemes for improved
opto-electronic oscillator,” in International Topical Meeting on Microwave Photonics, vol. 1, pp. 177–180, 1999.
[3] X.S. Yao and L. Maleki, “Progress in the optoelectronic oscillator - a ten year anniversary review,” 2004 IEEE Microwave Theory and Tech. Symp. Digest, pp. 287-290, 2004.
[4] M.L. Gorodetsky, A.A. Savchenkov and S.V. Ilchenko, “Ultimate Q of optical microsphere resonator,” Opt. Letters, vol.21 (7), pp. 453-455, 1996.
[5] D.K. Armani, T.J. Kippenberg, S.M. Spillane and K.J. Vahala, “Ultra-high-Q toroid microcavity on a chip,” Nature, vol.421, pp. 925-928, 2003.
[6] P. H. Merrer, A. Bouchier, H. Brahimi, O. Llopis, and G. Cibiel, “High-Q Optical Resonators for Stabilization of High Spectral Purity Microwave Oscillators,” in proc. of the 2009 IEEE EFTF-IFCS, pp. 866–869, 2009.
[7] J. Everard, “Low noise oscillators,” in Microwave Symposium Digest,1992., IEEE MTT-S International, pp. 1077–1080 vol.2, 1992. [8] D.B. Leeson, “A simple model of feedback oscillator noise spectrum,”
Proc. of the IEEE, vol. 54, no. 2, pp. 329-330, 1966.
[9] A. Yariv, ‘‘Critical coupling and its control in optical waveguide-ring resonator systems,’’ IEEE Photon. Technol. Lett., vol. 14, no. 4, pp 483---485, Apr. 2002 -30 -25 -20 -15 -10 10,00415 10,00425 10,00435 10,00445 10,00455 10,00465 A m p lit u d e ( d B ) Frequency (GHz) δν = 38 kHz -140 -120 -100 -80 -60 -40 -20 0 20
1,E+1 1,E+2 1,E+3 1,E+4 1,E+5 1,E+6 1,E+7
Ph ase n o ise (d B c/ H z) Frequency (Hz)