HAL Id: hal-01203067
https://hal.archives-ouvertes.fr/hal-01203067
Submitted on 21 Dec 2016HAL is a multi-disciplinary open access archive for the deposit and dissemination of sci-entific research documents, whether they are pub-lished or not. The documents may come from teaching and research institutions in France or abroad, or from public or private research centers.
L’archive ouverte pluridisciplinaire HAL, est destinée au dépôt et à la diffusion de documents scientifiques de niveau recherche, publiés ou non, émanant des établissements d’enseignement et de recherche français ou étrangers, des laboratoires publics ou privés.
Highly Stable PEMFC Electrodes Based on Electrospun
Antimony-Doped SnO 2
Sara Cavaliere, Ignacio Jiménez-Morales, Giorgio Ercolano, Iuliia Savych,
Deborah Jones, Jacques Rozière
To cite this version:
Sara Cavaliere, Ignacio Jiménez-Morales, Giorgio Ercolano, Iuliia Savych, Deborah Jones, et al.. Highly Stable PEMFC Electrodes Based on Electrospun Antimony-Doped SnO 2. ChemElectroChem, Weinheim : Wiley-VCH, 2015, 2 (12), pp.1966 - 1973. �10.1002/celc.201500330�. �hal-01203067�
Highly stable PEMFC electrodes based on electrospun antimony doped SnO2
Sara Cavaliere*[a], Ignacio Jiménez-Morales[a], Giorgio Ercolano[a], Iuliia Savych[a], Deborah Jones[a], Jacques Rozière[a]
[a] Institut Charles Gerhardt Montpellier, UMR UM CNRS 5253 Laboratoire des Agrégats Interfaces et Matériaux pour l'Energie Université de Montpellier
34095 Montpellier Cedex 5 France) E-mail: [email protected]
Supporting Information for this article is available on the WWW under http://dx.doi.org/10.1002/celc.201500330
Abstract
High durability and activity for the oxygen reduction reaction (ORR) was demonstrated for oxide-supported platinum catalysts. The supports were antimony doped SnO2 (ATO) fibres-in-tubes obtained by electrospinning and subsequent calcination. The doping with antimony instead of the already reported niobium, allowed the preparation of tin oxide with electrical conductivity similar to carbon, as well as an increased electrocatalyst loading. Platinum nanoparticles supported on electrospun ATO demonstrated higher electrochemical stability and comparable mass activity to commercial Pt/C during ex situ potential cycling. The in situ fuel cell tests also revealed an improved corrosion resistance with no noticeable degradation of the oxide based membrane electrode assembly (MEA), but a slightly lower performance compared to the MEA with carbon-supported catalysts.
Introduction
Proton exchange membrane fuel cells (PEMFCs) play an important role in the sustainable economic growth through transportation, but also for stationary power and portable applications[1]. Extensive research and development in the last two decades have led to remarkable progress, nevertheless, some challenges still need to be overcome for the widespread market commercialisation of this technology. One of the most crucial issues is the electrode degradation over time[2,3]. State-of-the-art PEMFC cathodes are based on platinum nanopState-of-the-articles supported onto high surface area carbons, which at the high potential reached e.g. during start-up cycles lead to PEMFC major failure due to carbon support corrosion and to the catalyst particles dissolution and sintering[4,5].
Alternative catalyst supports must present high electronic conductivity, porous structure, dissolution stability, reasonable surface area and low cost[6]. Among them graphitised carbons, electronically conducting polymers, metal nitrides, carbides, borides, and oxides have been widely studied[7]. The latter, with their high corrosion resistance and strong interaction with the metal catalyst[8], have shown great electrochemical stability combined with good electrocatalytic performance[9–13]. Since the end of the 70’s[14,15] SnO2-based supports have been investigated as both cathode[8,16– 23] and anode supports[24–27]. In order to increase their electrical conductivity, recent studies have demonstrated two effective strategies: the preparation of composite materials with carbon[19,20,22,28–34] and the doping with heteroatoms including niobium, tantalum, ruthenium and antimony[17,23,35–40].
Antimony doped tin oxide (ATO) is one of the most investigated electrocatalyst supports due to its electrical conductivity similar to that of carbon[35,38,41–46]. Microporous antimony doped SnO2 supports synthesised by hydrazine reduction and catalysed with Platinum nanoparticles showed improved stability at high potential (only 5 % loss of surface area after 300 cycles at 1.45 V), but lower electrocatalytic activity than Pt/C catalysts [17]. Platinum nanoparticles supported on ATO high surface area powders prepared by a modified sol-gel synthesis have also demonstrated a high corrosion resistance, presenting an oxygen reduction reaction (ORR) activity decrease of 26 % after 1,000 cycles between 0.5 and 1.5 V against the 65 % of platinum on acetylene black[47]. However, the electrocatalytic activity was still lower than conventional Pt/C electrodes. Similar results were obtained on platinum deposited on ATO nanoparticles, where the low mass activity was attributed to the low electrochemical surface area (ECSA) and electrical conductivity of the pure oxide support[38]. In the case of aggregated oxide structures, the obtained ORR activity and fuel cell performance was even superior to that of platinum on carbon black electrodes[48,49].
It has been already demonstrated that the stability of the antimony doped SnO2 is not an intrinsic characteristic of the material, but instead strongly depends on the synthesis conditions, being related to the antimony ion concentration at the surface[47]. This explains a certain instability of ATO based electrodes (Sn or Sb dissolution) reported by some research groups[49–51], while in other cases potentials as high as 1.8 V could be reached without degradation[52].
In this work SnO2 loose-tubes with different antimony at.% were obtained by electrospinning and calcination. After the determination of the optimal doping amount, samples with the highest surface area and electrical conductivity were functionalised with Pt nanoparticles synthesised by a microwave-assisted polyol method[10]. Morphological, structural, textural and electrical properties of the obtained ATO fibre-in-tubes as well as in situ and ex situ electrochemical properties of the platinum catalysed materials are reported. Great improvements in terms of electrical conductivity, long term stability, ORR mass activity and fuel cell performance compared to Nb doped SnO2 loose-tube based electrodes also prepared by electrospinning and described in previous publications[40,53] and the better electrochemical stability of these systems compared to conventional Pt/C electrodes are here described.
Results and Discussion
The ATO based materials have been prepared by electrospinning, a physical method allowing the controlled synthesis of nanofibre mats with surface area and porosity well adapted for PEMFC electrodes[55,56]. The morphology of the prepared SnO2 materials containing different amounts of antimony has been evaluated after calcination by FE-SEM. The micrographs of 5 and 10 at.% antimony doped tin oxide are shown in Figure 1 (low magnification image available in Supporting Information, SI). Similarly to Nb doping[53], the presence of antimony induces the formation of hollow 1D structures rather than solid fibres by single-needle electrospinning independently of the SnCl2 precursor concentration. As in the case of niobium, the formation of fibre-in-tube morphology could be ascribed to the inhibition effect of the particle growth also produced by antimony[57,58]. More pronounced fibre-in-tube structures and with lower average tube diameters were obtained when the antimony concentration increased from 5 (~ 230 nm) to 10 at.% (~ 180 nm).
Figure 1. SEM images of 5 (a) and 10 (b) Sb at.% doped SnO2 and corresponding fibre diameter distribution histograms (c and d).
Structural analysis has been performed on non-doped and antimony containing SnO2 samples to investigate their crystallinity and the success of the doping. Figure 2 presents the corresponding XRD patterns. They reveal that all diffraction peaks correspond to polycrystalline tin oxide, which can be indexed as tetragonal P42/mnm cassiterite structure (JCPDS 41-1445). No supplementary diffraction peaks related to separate phases containing antimony were detected. Therefore, given their comparable ionic radii (0.69, 0.74 and 0.9 Ǻ for Sn4+, Sb5+ and Sb3+, respectively)[37], it may be concluded that antimony ions replace the tin ions in the SnO2 lattice without significant cell volume variations. Moreover, due to the similar outer shell electronic configurations the substitutional doping is utterly possible. The XRD peak broadening with increasing antimony concentration indicates a decrease in the grain size of SnO2 doped with antimony. Indeed, the crystallite sizes calculated using the Scherrer equation were ca 31, 22 and 18 nm for undoped, 5 and 10 at.% Antimony doped SnO2, respectively. As already pointed out, this can be attributed to grain growth inhibition induced by antimony[57,58].
Figure 2: XRD diffractogramms of electrospun SnO2 with different antimony doping levels. The electrical conductivity at RT increases significantly from ca 0.001 S cm-1 for undoped electrospun SnO2 to 0.7 S cm-1 and 1 S cm-1 for 5 and 10 at.% antimony doped SnO2, respectively (50 times the value obtained for Nb doped tin oxide loose-tubes)[53]. Antimony can be incorporated into the tin oxide lattice as Sb5+ or as Sb3+. It has been reported that for low doping level, antimony is present mainly as Sb5+ (donor-doping) and the conductivity increases with the antimony content[59]. By further adding antimony, Sb3+ (acceptor-doping) amount increases resulting in the compensation of
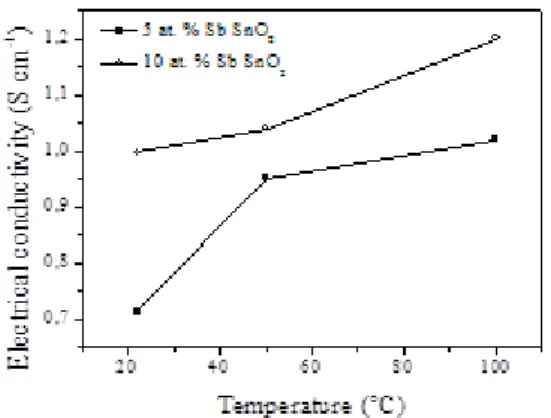
donor levels with a consequent decrease in electrical conductivity. Electrical conductivity of ATO electrospun loose-tubes increases with temperature (Figure 3) demonstrating the semiconductor behaviour of the oxide. Similar values (0.99 S cm-1 at 80 °C)[38] or even higher approaching carbon (40 S cm-1 at RT)[48] have been reported for ATO nanoparticles.
Figure 3. Electrical conductivity of 5 and 10 at. % Sb-SnO2 loose-tubes as a function of temperature. The nitrogen adsorption/desorption isotherms of 5 and 10 at. % antimony doped SnO2 loose-tubes showed hysteresis in the relative pressure range between 0.7-1.0 (type-IV isotherms), which is typical of mesoporous materials (Figure SI2 in SI). The specific surface areas calculated by the BET method were 26, 27 and 35 m2 g-1 for undoped, 5 and 10 at. % Sb doped SnO2, respectively. 10 at.% ATO exhibits enhanced surface area which can be attributed to smaller grain size. This sample, combining the highest electrical conductivity and the highest surface area has been thus chosen for platinum deposition and further electrochemical characterisation.
Platinum particles prepared by the microwave-assisted polyol method[10] have been deposited onto ATO loose-tubes. TEM micrographs of Figure 4 show that their average diameter is 2.4 nm and that they are homogeneously dispersed on the hollow fibres without aggregation. A theoretical study reported that the presence of antimony in SnO2 can contribute to better dispersion and anchorage of the platinum particles[58].
Figure 4. TEM image of Pt/Sb-SnO2 (a) and the corresponding platinum nanoparticle size distribution (b).
The XRD pattern of the Pt/Sb-SnO2 material (Figure SI3) together with diffraction peaks assigned to tetragonal cassiterite SnO2 shows those corresponding to the face-centred cubic structure of platinum (2θ = 39.7, 46.2 and 67.4º, JCPDS 004-0802). The average diameter of the platinum crystallites, estimated applying the Scherrer equation to the Pt (111) peak, was 2.9 nm, in agreement with TEM results. X-ray fluorescence indicated a platinum loading of 40 wt.%.
CV measurements were performed in nitrogen saturated HClO4 on Pt/Sb-SnO2 and on commercial Pt/C for comparison (Figure SI4). The hydrogen adsorption/desorption peaks and platinum oxide formation and reduction were clearly evident. The ECSA values, based on the hydrogen desorption process, reached 31 m2 g-1. This value is slightly higher than that obtained for Nb doped tin oxide synthesised with the same electrospinning method (27 m2 g-1)[60] and on other ATO materials (20 m2 g-1), attributed to the relative low electrical conductivity and the small surface area of the support[38]. Other groups reported higher ECSA values for platinum nanoparticles deposited onto an antimony doped tin oxide aggregated particle supports (ca 40 m2 g-1[50], 60 m2 g-1 after electrochemical cycling[48] and 69 m2 g-1[49]). During the prolonged cycling between 0.6 and 1.2 V, the ECSA value decreased and that was used as a stability probe for the tested electrodes (Figure 5). The surface area loss over time was lower for the oxide based electrode than for the carbon based electrode. Indeed, after 10,000 cycles the Pt/C ECSA decreased by 55 %, while the Pt/ATO sample only lost 40 % of its electroactive area (Figure 5).
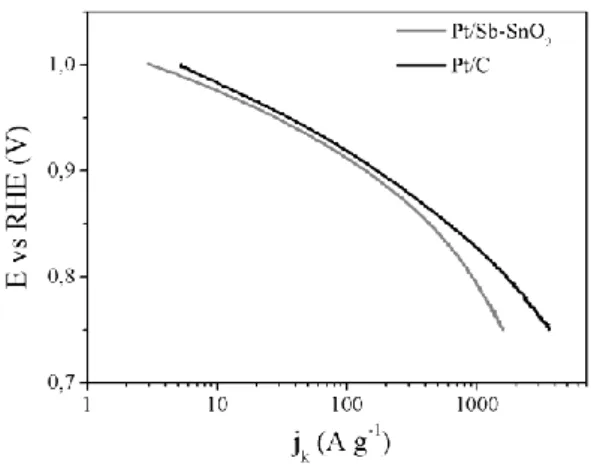
Figure 5. ECSA variation upon electrochemical cycling for Pt/ATO loose-tubes and Pt/C and corresponding exponential fitting curves obtained with OriginPro8 software (OriginLab). The ORR activity of Pt deposited on the ATO loose-tubes was evaluated and compared to that obtained using the carbon based electrocatalyst. The corresponding mass activities have been calculated by dividing the kinetic currents obtained applying the Koutecky-Levich equation by the mass of loaded Pt onto the RDE. The ORR Tafel plot for the SnO2 based electrode and the reference are presented in Figure 6. The mass activity values calculated at 0.9 V were 0.14 and 0.17 A mgPt-1, and at 0.85 V 0.430 and 0.60 A mgPt-1 for Pt/Sb-SnO2 and Pt/C, respectively. In any case the activity of the tin oxide based catalyst is almost as high as that of the carbon based one. A great improvement is observed compared to the Nb doped SnO2 prepared in similar conditions, which presented an activity of only 0.034 A mgPt-1 at 0.9 V[40]. That might be ascribed to the significantly increased electrical conductivity of the antimony doped support as well as to the higher Pt loading achieved with the hollow fibres of Sb-SnO2. Also in comparison with other Pt/Sb-SnO2 materials, the electrocatalytic activity of this electrospun catalyst is similar (0.515 A 1 at 0.85 V)[49] or even higher (0.094 A 1 at 0.85 , 0.015 A mgPt-1 at 0.9 V[47], in agreement with the obtained Pt active areas.
To further investigate the performance and the durability of Pt/ATO loose-tubes, in situ H2/O2fuel cell tests have been performed on MEA prepared using them at the cathode side. The corresponding polarisation curve is depicted in Figure 7 with those of Pt/Nb-SnO2 and Pt/C based cathodes[40]. At low current densities, the behaviour is similar for the two tin oxide based MEAs, despite the better ORR activity of the ATO. There is a markedly improved performance in the ohmic region for the MEA with the Pt/Sb-SnO2 cathode, which can be attributed to the higher electrical conductivity of the support.
Figure 6. ORR Tafel plot for Pt/ATO loose-tubes and Pt/C.
The maximum power density increased from 0.41 to 0.61 W cm-2 by changing the support doping agent from Nb to Sb. This value is quite promising considering that a MEA with Pt/ATO hollow spheres at the cathode exhibited a peak power density of 62 mW cm-2 (factor 100 lower than reported here) and a maximum current density around 250 mA cm-2. [41]. In addition, high platinum loading on Sb-SnO2 (40 wt.%) allows the fabrication of thinner catalyst layers, which may lead to lower ohmic and mass transport losses. Although the performance of the Pt/Sb-SnO2-MEA is still lower than Pt/C based MEA (maximum power density of 0.96 W cm-2), this result clearly identifies the support conductivity as one of the main factors driving MEA performance. Another possible reason for the reduced activity compared to the Pt/C based MEA could be dissolution of antimony, which could poison the surface of platinum as observed by Suchsland et al.[51] Nevertheless, the results obtained after AST (Figure 8 described lower) seem to exclude this scenario.
Figure 7. Polarisation curves of MEA with Pt/Nb-SnO2, Pt/Sb-SnO2 and Pt/C cathodes at 80 °C and 100 % RH.
Kakinuma et al. found lower performance in H2/air for an MEA based on Sb doped than Nb doped tin oxide and carbon black (CB) based cathodes, and attributed this result to a poisoning of the catalyst layer by impurities originating from the oxide components, namely Sn dissolution and reprecipitation onto platinum[49]. These authors observed that in acidic and reducing medium Sn ions could be detected in solution to a higher extent when the oxide was doped with Sb than with Nb.
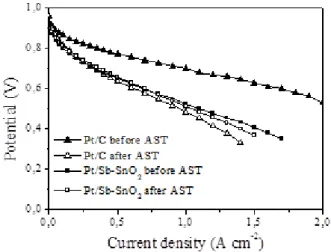
In order to evaluate the relative stability of the MEAs, an accelerated stress test was performed and the i/V characteristics redetermined. The comparison of the polarisation curves obtained before and after the AST test for Pt/Sb-SnO2 and Pt/C based MEAs is shown in Figure 8.
The initial open circuit voltages (OCV), around 0.96 V for both MEAs are practically unchanged after potential cycling. At higher current densities the performance of the Pt/C based MEA underwent a strong decrease, while negligible decrease was observed for the ATO based MEA resulting in slightly higher final currents compared to the carbon based MEA (Figure 8).The performance degradation is related to detachment and migration of platinum nanocatalysts as a result of carbon corrosion as well as platinum dissolution and migration into the ionomer membrane[40]. The tin oxide based MEA resulted in a higher durability due to electrochemical stability of the support.
Figure 8. Polarisation curves of Pt/Sb-SnO2 and Pt/C based MEAs before and after the accelerated stress test at 80 °C and 100 % RH.
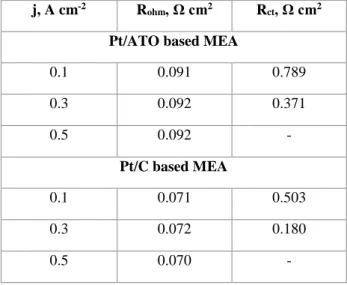
The charge transfer properties of the ATO loose-tubes and the carbon based electrocatalyst in fuel cell electrodes were evaluated by performing electrochemical impedance spectroscopy (EIS) at different current densities (0.1 to 0.5 A cm-2) before and after the AST. For both samples, Nyquist plots presented a single impedance arc (Figure SI5), whose diameter is related to the electrode charge transfer resistance (Rct), mainly due to the sluggish ORR, but probably related to the intrinsic resistance of the electrocatalyst support. A Randles model has been used to describe the single semicircle loop, where double-layer capacitance is replaced by a constant phase element due to the porous structure of the electrode[61]. The ohmic (Rohm) and charge transfer resistances obtained from impedance spectra in figure SI3 are listed in Table 1. The Rct for the ATO based electrode were greater than that for the carbon-based cathode, but lower than that of Pt/Nb-SnO2-MEA[40], probably due to the different electrical conductivities of the support materials, in agreement with the PEMFC performance of Figure 6. Their values decrease with increasing current density. The ohmic resistances, mainly related to the ionomer membrane, are lower for the Pt/C based MEA than for the Pt/ATO based one. The contribution of the support resistance may be taken into account.
Table1. Ohmic and charge transfer resistances obtained by fitting EIS spectra obtained at several current density.
j, A cm-2 R
ohm, Ω cm2 Rct, Ω cm2
Pt/ATO based MEA
0.1 0.091 0.789 0.3 0.092 0.371 0.5 0.092 - Pt/C based MEA 0.1 0.071 0.503 0.3 0.072 0.180 0.5 0.070 -
EIS analysis performed after the in situ voltage cycling (Figure SI6) showed that the ohmic resistances remained almost unchanged for all MEAs. Pt/Sb-SnO2-MEA showed a lower increase of charge transfer resistance (from 0.789 to 0.888 Ω cm2) than Pt/C-MEA (from 0.503 to 0.900 Ω cm2), in agreement with the i/V curve after AST (Figure 7). The stability of the ATO support seems not to be compromised as reported elsewhere[49–51].
As a result of the improved conductivity of the catalyst layer, MEAs integrating ATO based cathodes provide significantly higher performance than Nb-SnO2 based MEA. Although the lower maximum power density compared to Pt/C-MEA, these results clearly show that Sb-SnO2 holds promise as cathode catalyst support for PEMFC applications.
Table 2. Ohmic and charge transfer resistances obtained by fitting EIS spectra before and after 1200 AST cycles.
Cycle number Rohm, Ω cm2 Rct, Ω cm2
Pt/ATO based MEA
0 0.091 0.789 1200 0.092 0.888 Pt/C based MEA 0 0.071 0.503 1200 0.070 0.900 Conclusions
Antimony doped SnO2 (ATO) fibres-in-tube prepared by electrospinning and loaded with platinum nanoparticles show ORR mass activity almost as high as for commercial Pt/C and their stability evaluated by ECSA retention was superior. The oxide based electrode has significantly higher stability in fuel cell accelerated stress tests up to 1.4 V.
Electrocativity and stability over time are greatly improved compared to other electrospun oxide based electrodes [10,40,53,62]. The challenge remaining to overcome is to increase fuel cell performance, still lower than that obtained for Pt/C MEAs. Further studies are in progress to verify the stability of ATO in PEMFC operating conditions, already suggested as possible issue for this reduced activity[49– 51], and definitely meet this challenge and propose a real alternative to carbon supports.
Experimental Section
The synthesis protocol for antimony doped SnO2 fibre-in-tubes is similar to the previously reported niobium doped materials[53]. 0.05-0.1 g of SbCl3 (99 %, Sigma-Aldrich), corresponding to doping levels between 5 and 10 at.%, were added to a solution of 0.78 g of SnCl2 (98 %, Sigma-Aldrich) and 0.8 g of polyvinylpyrrolidone (PVP, average Mw ~ 1,300,000, Sigma-Aldrich) solution in ethanol (99.8%, Fluka)/ N,N-dimethylformamide (DMF, 98 % min., Fluka) = 1.8. The obtained mixture was stirred overnight and electrospun at room temperature on a rotating drum (Linari Biomedical) using an applied voltage of 15 kV, a needle-collector distance of 10 cm and a flow rate of 0.3 mL h-1. The as-prepared SnCl2/PVP fibres were calcined at 600 °C for 4 h in air with a heating rate of 5 °C min-1 in order to remove the carrier polymer and to allow formation of the hollow inorganic fibres.
A microwave-assisted polyol method[10] was used to prepare platinum nanocatalyst particles. 133 mg of hexachloroplatinic acid (H2PtCl6 6H2O, 99.9 % Alfa Aesar) were dissolved in 95 mL of ethylene glycol (99.8 %, Sigma Aldrich) and the pH was adjusted to pH 11.4 using 1 M NaOH solution (98 %, Sigma Aldrich) in ethylene glycol. The resulting solution was heated at 120 °C for 6 minutes at 200 W in a microwave reactor (MiniFlow 200SS Sairem). 60 mg of the Sb-SnO2 fibre-in-tubes were added to the as-synthesised platinum nanoparticle suspension with the pH adjusted to 2 using 1 M H2SO4 (95-98 %, Sigma Aldrich) in ethylene glycol. After gentle stirring for 24 hours the product, Pt/Sb-SnO2, was recovered by filtration, washed with milli-Q water and ethanol and dried at 80 °C for 24 h. A further thermal treatment at 160 °C for one hour was performed to remove any ethylene glycol traces from the noble metal surface[54].
The morphology of the electrospun materials and of the loaded platinum particles was analysed by field emission-scanning electron microscopy (FE-SEM) using a Hitachi S-4800 microscope and by transmission electron microscopy (TEM) using a JEOL 1200 EXII microscope operating at 120 kV equipped with a CCD camera SIS Olympus Quemesa (11 million pixels). For TEM analyses, the samples were suspended in ethanol and sonicated before deposition onto carbon-coated copper grids. The average diameters of platinum nanoparticles and of the loose-tubes were determined by measuring 200 selected objects using the ImageJ software.
Powder X-ray diffraction (XRD) patterns were recorded at room temperature in Bragg-Brentano configuration using a PANAlytical X’pert diffractometer, equipped with a hybrid monochromator, operating with CuKα radiation (λ = 1.541 Å), and using a step size of 0.1° 2θ within the 2θ domain from 20 to 80°.
The Pt loading on Sb-SnO2 was determined by X-ray fluorescence (XRF). The samples were prepared by grinding 50 mg of Pt/Sb-SnO2 with 25 mg of cellulose. This mixture was then placed in a H3BO3 matrix and pressed, in order to obtain a pellet of 32 mm diameter with scanned surface of ca. 12 mm. The same protocol was used to prepare seven standards using 15, 20, 25, 30, 35, 40 and 45 wt.% of platinum black (Alfa Aesar) and Sb-SnO2 to obtain a calibration line. The XRF analyses were performed with a PANalytical Axios Max spectrometer fitted with a Rh (4 kW) tube, and equipped with a LiF200 crystal and Omnian software.
Nitrogen adsorption/desorption isotherms on ATO loose-tubes were determined at 77 K by means of a Micromeritics ASAP 2020 apparatus after outgassing overnight at 200 ºC under vacuum (10-5 Torr). The specific surface area (SBET) was calculated using the BET equation and taking 0.162 nm2 as the cross-sectional area of one N2 molecule.
The electronic conductivity of Sb doped SnO2 was determined in the temperature range 22-100 °C from resistance measurements carried out using an in-house conductivity cell equipped with four gold electrodes and using the Van der Pauw calculation. Samples were analysed as flat pellets by pressing them at 5 tons for 10 min.
The ex situ electrochemical analyses were carried out in a three-electrode cell consisting of a glassy carbon rotating disk electrode (RDE) (working electrode, geometric area of 0.196 cm2), a reversible hydrogen electrode (reference electrode, RHE) and a platinum wire (counter electrode). A Pine bipotentiostat model AFCBP1 was used. All the potential values are referred to the RHE and the current densities are reported as current per geometric electrode area. To prepare the catalyst ink, 5 mg of the Pt/Sb-SnO2 electrocatalyst were dispersed in 670 µL milli-Q water, 2.7 mL of ethanol (Aldrich) and 23 µL 5 wt.% Nafion® solution in alcohols (Aldrich). For the reference, 5 mg of 57 wt.% Pt/C (HiSPEC 9100 from Johnson Matthey) were dispersed with 1 mL of milli-Q water, 4 mL of ethanol (Aldrich) and 35 µL of the 5 wt.% Nafion® solution in alcohols (Aldrich). The catalyst inks were sonicated (VWR Ultrasonic Cleaner) for 15 min. Aliquots of 7 µL of the inks were then deposited onto the RDE surface with a micropipette and dried in air. The platinum loading was 21 µg cm-2 for both electrocatalysts. Cyclic voltammetry (CV) was performed in N2 saturated 0.1 M HClO4. For experiments assessing catalyst and support stability, 10,000 cycles were performed between 0.6 V and 1.2 V with a scan rate of 500 mV s-1; every 100th cycle was performed between 0.025 V and 1.2 V with a scan rate of 20 mV s-1 to determine the ECSA. Its calculation was based on hydrogen desorption peaks in the range 0.05 V to 0.4 V vs RHE after double-layer correction, assuming a monolayer hydrogen adsorption charge of 210 µC cm-2 for the Pt surface. The ORR curves were recorded using linear sweep voltammetry at 1600 rpm in O2 saturated 0.1 M HClO4. The potential was varied from 0.1 V to 1.2 V vs RHE at a scan rate of 20 mV s-1, these were later background and IR corrected.
Gas diffusion electrodes for the anode were purchased from Alfa Aesar. Platinum loading was 0.4 mg cm-2. Nafion® 212 membranes (Ion Power) were treated before assembly with the electrodes using a procedure detailed elsewhere[40]. Pt/Sb-SnO2 and Pt/C based cathodes loaded with 0.5 mg cm-2 Pt were prepared with the following method: a mixture of 9.5 mg of Pt/Sb-SnO2 or 4 mg Pt/C catalyst, 46 µL of a 5 wt.% Nafion® solution (Sigma-Aldrich), 400 µL of water and 2 mL of ethanol was sonicated for at least 30 min and sprayed-coated on a gas diffusion layer (4 cm2, Sigracet 10 BC). The membrane electrode assembly (MEA) was assembled by pressing the electrodes and membrane at 140 °C for 2 min at 25 MPa. The MEA was then incorporated in the fuel cell fixture using fluorinated ethylene propylene gaskets at 10-15 % compression. The MEA conditioning step was performed at 0.5 A cm-2 overnight at 100 % RH and 80 °C. Polarisation curves were recorded under H2/O2 (stoichiometry 1.5/2) by setting the current density and measuring the cell potential. A back-pressure of 1 bar was applied (2 bar absolute pressure).
An accelerated stress test (AST), applied in the fuel cell at 80 °C, consisted of a square-wave type voltage cycle, holding at 0.9 V for 3 sec and at 1.4 V for 3 sec, and repeating 1200 times[49]. Electrochemical impedance spectroscopy (EIS) measurements in the range 20 kHz to 100 mHz were performed at 0.1, 0.3 and 0.5 A cm-2 to measure the resistance in the MEAs before and after the voltage cycling.
Acknowledgements
The research leading to these results has received funding from the European Research Council under the European Union's Seventh Framework Programme (FP/2007-2013) / ERC Grant Agreement n. 306682.
I. J.-M. and I.S. acknowledge the financial support from the French National Research Agency (ANR-12-PRGE-0007).
Keywords: electrospinning, antimony tin oxide, alternative supports, fuel cell cathode, PEMFC
References
[1] A. Rabis, P. Rodriguez, T. Schmidt, ACS Catal. 2012, 2, 864–890.
[2] J. Peron, Y. Nedellec, D. Jones, J. Rozière, J. Power Sources 2008, 185, 1209–1217. [3] Y. Shao, G. Yin, Y. Gao, J. Power Sources 2007, 171, 558–566.
[4] J. C. Meier, C. Galeano, I. Katsounaros, A. a. Topalov, A. Kostka, F. Schüth, K. J. J. Mayrhofer, ACS Catal. 2012, 2, 832–843.
[5] Y. Yu, H. Li, H. Wang, X.-Z. Yuan, G. Wang, M. Pan, J. Power Sources 2012, 205, 10–23. [6] T. J. Schmidt, ECS Trans. 2012, 45, 3–14.
[7] Y.-J. Wang, D. P. Wilkinson, J. Zhang, Chem. Rev. 2011, 111, 7625–51. [8] P. Zhang, S.-Y. Huang, B. N. Popov, J. Electrochem. Soc. 2010, 157, B1163. [9] H. Chhina, S. Campbell, O. Kesler, J. Electrochem. Soc. 2007, 154, B533.
[10] I. Savych, J. Bernard d’Arbigny, S. Subianto, S. Cavaliere, D. J. Jones, J. Rozière, J. Power Sources 2014, 257, 147–155.
[11] L. Chevallier, A. Bauer, S. Cavaliere, R. Hui, J. Rozière, D. J. Jones, ACS Appl. Mater. Interfaces 2012, 4, 1752–1759.
[12] S.-Y. Huang, P. Ganesan, B. N. Popov, Appl. Catal. B Environ. 2010, 96, 224–231.
[13] N. Elezović, B. Babić, L. Gajić-Krstajić, V. Radmilović, N. V Krstajić, L. J. Vračar J. Power Sources 2010, 195, 3961-3968.
[14] V. B. Hughes, B. D. McNicol, J. Chem. Soc. Faraday Trans. 1 1979, 75, 2165. [15] M. Watanabe, S. Venkatesan, H. Laitinen, J. … 1983, 59–64.
[16] W. S. Baker, J. J. Pietron, M. E. Teliska, P. J. Bouwman, D. E. Ramaker, K. E. Swider-Lyons, J. Electrochem. Soc. 2006, 153, A1702.
[17] N. R. Elezovic, B. M. Babic, V. R. Radmilovic, N. V. Krstajic, J. Electrochem. Soc. 2013, 160, F1151–F1158.
[18] T. Higashi, ECS Trans. 2013, 58, 1293–1299.
[20] K. Kanda, Z. Noda, Y. Nagamatsu, T. Higashi, S. Taniguchi, S. M. Lyth, a. Hayashi, K. Sasaki, ECS Electrochem. Lett. 2014, 3, F15–F18.
[21] A. Masao, S. Noda, F. Takasaki, K. Ito, K. Sasaki, Electrochem. Solid-State Lett. 2009, 12, B119– B122.
[22] M. Sudan Saha, R. Li, M. Cai, X. Sun, Electrochem. Solid-State Lett. 2007, 10, B130.
[23] F. Takasaki, S. Matsuie, Y. Takabatake, Z. Noda, a. Hayashi, Y. Shiratori, K. Ito, K. Sasaki, J. Electrochem. Soc. 2011, 158, B1270.
[24] M. Dou, M. Hou, D. Liang, W. Lu, Z. Shao, B. Yi, Electrochim. Acta 2013, 92, 468–473. [25] A. Martyla, M. Kopczyk, P. Marciniak, R. Przekop, Chem. Cent. J. 2014, 8, 49.
[26] H. Lu, Y. Fan, P. Huang, D. Xu, J. Power Sources 2012, 215, 48–52.
[27] H. Zhang, C. Hu, X. He, L. Hong, G. Du, Y. Zhang, J. Power Sources 2011, 196, 4499–4505. [28] H. L. Pang, J. P. Lu, J. H. Chen, C. T. Huang, B. Liu, X. H. Zhang, Electrochim. Acta 2009, 54, 2610– 2615.
[29] C. Du, M. Chen, X. Cao, G. Yin, P. Shi, Electrochem. Commun. 2009, 11, 496–498. [30] Z. Yang, G. Du, Z. Guo, X. Yu, S. Li, Z. Chen, P. Zhang, H. Liu, Nanoscale 2010, 2, 1011–7. [31] J. Parrondo, F. Mijangos, B. Rambabu, J. Power Sources 2010, 195, 3977–3983.
[32] B. Ruiz-Camacho, H. H. R. Santoyo, J. M. Medina-Flores, O. Álvarez-Martínez, Electrochim. Acta 2014, 120, 344–349.
[33] N. Zhang, S. Zhang, C. Du, Z. Wang, Y. Shao, F. Kong, Y. Lin, G. Yin, Electrochim. Acta 2014, 117, 413–419.
[34] Y. S. Kim, H. S. Jang, W. B. Kim, J. Mater. Chem. 2010, 20, 7859.
[35] K. Lee, I. Park, Y. Cho, D. Jung, N. Jung, H. Park, Y. Sung, J. Catal. 2008, 258, 143–152. [36] L. A. Frolova, Y. A. Dobrovolsky, N. G. Bukun, Russ. J. Electrochem. 2011, 47, 697–708. [37] Y. Senoo, K. Kakinuma, M. Uchida, H. Uchida, S. Deki, M. Watanabe, RSC Adv. 2014, 4, 32180. [38] M. Yin, J. Xu, Q. Li, J. O. Jensen, Y. Huang, L. N. Cleemann, N. J. Bjerrum, W. Xing, Appl. Catal. B Environ. 2014, 144, 112–120.
[39] T. Binninger, E. Fabbri, R. Kotz, T. J. Schmidt, J. Electrochem. Soc. 2013, 161, H121–H128. [40] I. Savych, S. Subianto, Y. Nabil, S. Cavaliere, D. Jones, J. Rozière, Phys. Chem. Chem. Phys. 2015, 17, 16970–16976.
[41] J. Suffner, S. Kaserer, H. Hahn, C. Roth, F. Ettingshausen, Adv. Energy Mater. 2011, 1, 648–654. [42] D. J. Guo, J. Power Sources 2011, 196, 679–682.
[43] V. Ávila-Vázquez, J.^^C. Cruz, M. Galván-Valencia, J.^^L.- edesma- García, L.^^G. Arriaga, C. Guzmán, S. M. Durón-Torres, Int. J. Electrochem. Sci. 2013, 8, 10586-10600.
[44] N. R. Elezovic, V. R. Radmilovic, J. Kovac, B. M. Babic, L. M. Gaijic-Krstajic, N. V. Krstajic, RSC Adv. 2015, 5, 15923–15929.
[45] D. J. You, K. Kwon, C. Pak, H. Chang, Catal. Today 2009, 146, 15–19.
[46] M. P. Gurrola, M. Guerra-Balcázar, L. Álvarez-Contreras, R. Nava, J. Ledesma-García, L. G. Arriaga, J. Power Sources 2013, 243, 826–830.
[47] E. Fabbri, A. Rabis, R. Kötz, T. J. Schmidt, Phys. Chem. Chem. Phys. 2014, 16, 13672–81. [48] K. Kakinuma, M. Uchida, T. Kamino, H. Uchida, M. Watanabe, Electrochim. Acta 2011, 56, 2881–2887.
[49] K. Kakinuma, Y. Chino, Y. Senoo, M. Uchida, T. Kamino, H. Uchida, S. Deki, M. Watanabe, Electrochim. Acta 2013, 110, 316–324.
[50] K. Sasaki, F. Takasaki, Z. Noda, ECS Trans. 2010, 33, 473–482.
[51] J. P. Suchsland, B. Klose-Schubert, D. Herein, T. Martin, C. Eickes, M. Lennartz, ECS Trans. 2012, 50, 1659–1667.
[52] M. P. Gurrola, J. Gutiérrez, S. Rivas, M. Guerra-Balcázar, J. Ledesma-García, L. G. Arriaga, Int. J. Hydrogen Energy 2014, 939, 16763-1677.
[53] S. Cavaliere, S. Subianto, I. Savych, M. Tillard, D. J. Jones, J. Rozière, D. J. Jones, J. Phys. Chem. C 2013, 117, 18298–18307.
[54] E. Lebègue, S. Baranton, C. Coutanceau, J. Power Sources 2011, 196, 920–927.
[55] S. Cavaliere, S. Subianto, I. Savych, D. J. Jones, J. Rozière, Energy Environ. Sci. 2011, 4, 4761– 4785.
[56] S. Cavaliere, Ed., Electrospinning for Advanced Energy and Environmental Applications, CRC Press, 2015.
[57] V. Senthilkumar, P. Vickraman, M. Jayachandran, C. Sanjeeviraja, J. Mater. Sci. Mater. Electron. 2009, 21, 343–348.
[58] A. S. Zyubin, T. S. Zyubina, Y. A. Dobrovol’skii, L. A. Frolova, V. M. Volokhov, Russ. J. Inorg. Chem. 2013, 58, 1489–1495.
[59] C. Terrier, J. P. Chatelon, R. Berjoan, J. A. Roger, Thin Solid Films 1995, 263, 37–41.
[60] I. Savych, S. Subianto, Y. Nabil, S. Cavaliere, D. Jones, J. Rozière, Phys. Chem. Chem. Phys. 2015, 17, 23–27.
[61] X. Yuan, H. Wang, J. Colinsun, J. Zhang, Int. J. Hydrogen Energy 2007, 32, 4365–4380.
[62] S. Cavaliere, S. Subianto, L. Chevallier, D. J. Jones, J. Rozière, Chem. Commun. (Camb). 2011, 47, 6834–6836.