HAL Id: hal-03018974
https://hal.archives-ouvertes.fr/hal-03018974
Submitted on 16 Dec 2020HAL is a multi-disciplinary open access archive for the deposit and dissemination of sci-entific research documents, whether they are pub-lished or not. The documents may come from teaching and research institutions in France or abroad, or from public or private research centers.
L’archive ouverte pluridisciplinaire HAL, est destinée au dépôt et à la diffusion de documents scientifiques de niveau recherche, publiés ou non, émanant des établissements d’enseignement et de recherche français ou étrangers, des laboratoires publics ou privés.
Trace element distribution in marine microplastics using
laser ablation-ICPMS
Hind El Hadri, Julien Gigault, Sandra Mounicou, Bruno Grassl, Stephanie
Reynaud
To cite this version:
Hind El Hadri, Julien Gigault, Sandra Mounicou, Bruno Grassl, Stephanie Reynaud. Trace element distribution in marine microplastics using laser ablation-ICPMS. Marine Pollution Bulletin, Elsevier, 2020, 160, pp.111716. �10.1016/j.marpolbul.2020.111716�. �hal-03018974�
1
Trace element distribution in marine microplastics using laser ablation-ICP-MS
Hind El Hadri1, Julien Gigault2, Sandra Mounicou1, Bruno Grassl1*, Stéphanie Reynaud1
1
E2S UPPA, CNRS, IPREM, Université de Pau et des Pays de l’Adour, Pau, France
2
Géosciences Rennes, UMR 6118, CNRS – Université de Rennes 1, Av. Général Leclerc, Campus de Beaulieu, 35000 Rennes France
Electronic supplementary information (ESI) available.
Abstract:
Due to the dramatic quantity of plastic debris released into our environment, one of the biggest challenges of the next decades is to trace and quantify microplastics (MPs) in our environments, especially to better evaluate their capacity to transport other contaminants such as trace metals. In this study, trace elements (Fe, Cu, Zn, As, Cd, Sn, Sb, Pb, and U) were analyzed in the microplastic subsurface (200 µm) using laser ablation inductively coupled plasma mass spectrometry (LA-ICP-MS). Microplastics subjected to the marine environment were collected on beaches (Guadeloupe) exposed to the north Atlantic gyre. We established a strategy to discriminate sorbed contaminants from additives based on the metal concentration profiles in MP subsurface using qualitative and quantitative approaches. A spatiotemporal correlation of the sorption pattern was proposed to compare MPs in terms of relative exposure time and time-weighted average concentrations in the exposure media.
2
1. Introduction
Tracing and quantifying microplastic (MP) debris in our environment is one of the most important concerns of politics, public and scientific communities, especially relating to the impact of these debris.1 One of the major impacts is indirect and probably due to the organic and inorganic species that can be carried with microplastics.2–4 As associated inorganic species, two possibilities are considered:
(i) The adsorbed species. The plastic composition (hydrophobicity, polymer type,
surface oxidation, and biofilm coating) may increase its reactivity toward the trace metals already present in the environment and facilitate their sorption at the particle surface;
(ii) The release of additives. The incorporation of inorganic additives for coloring and
heat stabilization (e.g., oxides of Ti, Zn, Co, and Pb), flame retardant synergic species (e.g., Sb2O3) or other stabilizing purposes (e.g., organometallic
compounds of Ba, Sn, and Zn) is common in the plastic industry. The release of additives occurs during plastic degradation and/or simple diffusion.5
Several studies assessed metal sorption on MPs.6–9 It was demonstrated that the sorption of inorganic contaminants on MPs is greater on aged pellets than pristine pellets10,11, confirming the impact of environmental fate on MP reactivity. The marine environment is generally characterized by extreme conditions inducing severe MP weathering. MP properties (size, shape, and surface area) are therefore considerably modified, and they are transformed into superreactive species.12 As this reactivity will influence the final impact of the MPs13, their surface characterization is essential.
Traditional methods used for characterizing material surfaces include Auger electron spectroscopy (AES), X-ray photoelectron spectroscopy (XPS), time of flight secondary ion mass spectrometry (TOF-SIMS), atomic force microscopy (AFM), or energy-dispersive X-ray (EDX) analysis.14 Plastic debris surface analysis was recently performed using electron microscopy coupled with EDX spectroscopy.15,16 All these techniques can produce quantitative and/or semiquantitative depth distribution profiles at the extreme surface (< 10
m). Nevertheless, these techniques are limited in terms of spatial resolution, especially across the material structure, and do not allow characterization of the subsurface layers. Indeed, the first surface layers must be ablated to characterize the material core. It was recently demonstrated that laser ablation can be used to breakdown and ablate plastic
3 materials.17 Depending on the optical setup and laser power, the quantity of ablated matter can be controlled. From an analytical point of view, laser ablation can be coupled to different mass detectors, allowing the composition of the ablated matter to be determined. Concerning the large quantity and variety of metals used as additives or adsorbed in the life cycle of MPs, the coupling of laser ablation with inductively coupled plasma mass spectrometry (LA-ICP-MS) offers several advantages as a method for the element- and isotope-selective trace analysis of solid materials.18 Nevertheless, to our knowledge, LA has not been employed to evaluate the distribution of inorganic elements from the surface to the core of MPs (> 10 m).
Therefore, the objective of this work is to provide a new strategy for mapping sorption or additive profiles according to qualitative and quantitative approaches based on the metal distribution in the MP subsurface. LA-ICP-MS was used on degraded MPs collected on northern Guadeloupe beaches (Caribbean Island). They are exposed to the North Atlantic gyre, which is known to concentrate plastic debris. The discrimination between the inorganic contaminants and additives initially present in the plastic was achieved by acquiring depth profiles (surface to bulk) of the MPs. A spatiotemporal correlation of the sorption pattern was proposed to compare MPs in terms of relative exposure time and time-weighted average concentrations (of arsenic) in the exposure media.
2- Materials and methods 2.1 Materials
Fragments and pellets of plastic were collected on Guadeloupe beaches (16°23'43.6"N 61°24'21.9"W) in November 2018 and named MPG (Figure S1). Guadeloupe (France) is a Caribbean island directly exposed to the North Atlantic gyre, which is known to be an area of plastic accumulation.19 The sampling was performed along the wrack line (50-200 m). All plastic-like materials visually detected were collected by hand regardless of the size. For small plastic pieces, natural debris (seagrass, shells…) and sand were collected at the same time for a further sorting. The samples were then sieved at 5 mm and 1 mm. Below 1 mm, plastics were retrieved from the sand and seagrass using plastic tweezers. The obtained microplastics were finally analyzed by IR-ATR and classified by category and size: polyolefin, polystyrene and others. For the main analyses no washing was performed on the MPs to avoid any loss of elements of interest. To test the effect of a pre-treatment, two samples (MPG-E and MPG-F) were also analyzed after an incubation of 24 hours at 60 °C in 10 % (w/w) potassium hydroxide (KOH) solution. Reference materials (ERM-EC 680 and
4 ERM-EC 681) were purchased from JRC-Geel (Belgium). The matrix is composed of polyethylene (PE) supplemented with various concentrations of inorganic additives (As, Br, Cd, Cr, Hg, Pb, S, Sb, Sn and Zn).
2.2 Instruments
The laser ablation system used for this study was an ESI NWR-213 equipped with a Nd:YAG laser at 213 nm wavelength (ESI, Freemont, CA, USA) and a TV2 ablation cell. The ICP-MS detector was an Agilent 7700s (Agilent Technologies, Japan) mounted with Pt cones. Before coupling the laser, ICP-MS was tuned into liquid mode using a 1 µg L-1 Y, Li, Tl, Ce, and Ba in 2% HNO3 to meet specification and mass calibration. The nature of the MPG and
the carbonyl index were determined using an attenuated total reflectance infrared (ATR-IR) spectrometer (Nicolet iS50 from Thermo Scientific, Waltham, MA, USA). The spectra were acquired at a resolution of 4 cm-1 from 400 to 4000 cm-1, and 32 acquisitions were performed on several spots (>4).
2.3 Laser ablation-ICP MS methods
The laser aerosol was transported toward ICP-MS by means of a 800 mL min-1 of He. The LA-ICP-MS conditions were optimized using a NIST 612 glass material in order to maximize the element signal intensity and to obtain an acceptable signal stability (RSD < 10%). Carbon (13C) was used as an internal standard to correct for any sample heterogeneity since all the MPG and references contain carbon in their polymer chains. A triplicate of four ablations were performed on the same line (constant x, y position) starting from the surface and moving by 50 µm in-depth (z, moving). In this case, the laser scanned the MP to a depth of 200 µm in 50 µm steps. A spot size of 100 µm, fluency =13 J cm-² (energy delivery of 45 %) with a scan rate at 80 µm s-1 during 50 s (length of line = 4 mm) and a 20 Hz pulse frequency were used. ICP-MS was operated in collision cell mode with 11 mL min-1. 13C was monitored at 0.01 s as integration time, 57Fe and 75As at 0.05 s while 63Cu, 64Zn, 111Cd, 118Sn,
121
Sb, 206Pb, 207Pb, 208Pb, 238U at 0.08 s. Reference materials (ERM-EC 680 and ERM-EC 681) were used for external calibration for quantification purposes.
2.4 Metal diffusion calculation through microplastics
To a first approximation, Fick’s first and second law can describe the diffusion of metals in a substrate. The metal flux, J, is proportional to the concentration gradient as given by Fick’s first law:
5
eq. 1
where D is the diffusion coefficient (m2/s), and C(x,t)/x is the concentration gradient of the
metal. The concentration C is a function of depth x and time t, and in this expression, D is assumed to be constant, which is a reasonable assumption when the concentration of the metal is low. Equation 1 has a negative sign, and C(x,t)/x is negative, corresponding to decreasing
concentration with depth; consequently, the flux into the sample is positive. The flux gradient
dJ/dx is proportional to the change in the concentration with time:
eq. 2
This is also called the continuity equation or Fick’s second law. The solution for equation 2 has been obtained for various simple conditions, including diffusion with a constant surface concentration (Cs). In the case of metal doping of MPs, the initial condition at t=0 is
C(x,0)=0, which states that the dopant concentration in the host MP is initially zero. The
boundary conditions are that the dopant concentration at the external MP surface is constant (C(0,t)=Cs), whereas in the bulk (core) of the MP, the concentration remains zero (C(,t)=0)
during the whole doping process, resulting in the following solution for differential equation 2.
eq. 3
where erfc is the complementary error function and (Dt)0.5 is the diffusion length.
The total amount of metal atoms per unit area of the MP, or the dose, Q(t), is given by integration of C(x,t) from x =0 to x=:
6
3. Results and discussion
3.1 In-depth profiles in MPs: additives or adsorbed contaminants?
Figure 1 presents the m/z counts of elements of interest normalized to the carbon m/z counts. For this illustration, we chose a polypropylene (PP) microplastic noted MPG-C (see Figure S1 and Figure 2). While several ion isotopes were monitored (57Fe, 63Cu, 64Zn, 75As, 111Cd, 118Sn,
121
Sb, 208Pb, and 238U), to simplify the representation, five elements were selected: M= Zn, As, Sb, Pb and U.
For all elements, a signal was detected in the first 200 µm by four successive scans of 50 µm, which is considered as the MP subsurface. Two different patterns were obtained according to the elements monitored:
(i) As and Zn were identified in the first 50 µm and 100 µm, respectively. Compared to As and Zn, U slightly decreases according to the laser ablation scan (see supplemental information, Figure S2). Such a U concentration gradient through the microplastic depths seems to indicate a deeper diffusion of U in the plastic matrices.
(ii) Pb and Sb present constant distributions throughout the microplastic depth. Such patterns can be attributed to additives used in the plastic formulation, or contamination during the manufacture. Sb is generally associated with flame retardants (brominated materials) as a synergistic agent during their formulation, while Pb is generally used as a heat stabilizer.5
7
Figure 1: Representative results of the LA-ICP-MS analysis of MPG-C polypropylene (PP)
microplastic m/z counts (signal intensity) of trace elements (64Zn, 75As, 121Sb, 208Pb and 238U) relative to the carbon m/z counts for four successive 50 m depth scans.
Figure 2 summarizes the different characteristics of the MPG samples. MPGs were composed of fragments and pellets of polypropylene (PP, 6 samples) and polyethylene (PE, 4 samples). As generally used in the literature, the carbonyl index (CI) was calculated to assess the degree of oxidation, which is correlated to the relative residence time in the environment.20 CI varies from 0.12 to 0.62 compared to approximately 0.02 for pristine PE (high-density and low-density PE) and PP (Figure S3), confirming the degradation of the MPG surfaces.16
8
Figure 2: Fingerprints of the metal distributions in the MPs (PP: polypropylene and PE:
polyethylene) and sample images in ascending order of their carbonyl index (CI). The y-axis corresponds to the relative proportions of the different metals according to the MPs depth ablated: 0-50, 50-100, 100-150 and 150-200 m.
9 The colors in Figure 2 illustrate the relative proportions of the different metals as a function of the ablated MP depth: 0-50, 50-100, 100-150 and 150-200 m. Two different color patterns were identified. The first one, namely, PA (additive profile), is a constant relative distribution
of the metal regardless plastic depth. The second one, namely, PS (sorption profile), is
characterized by a rapid decrease in the metal relative distribution from the surface (0-50 m) to the core (150-200 m) in the MP ablated areas. This latter pattern (PS) can be principally
caused by the diffusion of metals adsorbed onto the MP surface. Such diffusion from the surface to the core of the MPs occurs during their environmental transport and accumulation. As suggested above, the PA pattern can only be explained by the presence of metallic
additives. Indeed, considering the range of MP sizes and the recent age of the plastic industry, complete and equal metal distribution throughout the MP structure based solely on diffusion is unlikely. Using plastic standards (ERM-EC 680 and 681), the concentration distributions of Zn, As, Cd, Sn, Sb and Pb were quantitatively determined. Based on these standards (Figure S4), concentrations ranging from 5 to 4400 mg kg-1 and less than 29 mg kg-1 were determined for the PA and PS patterns, respectively (see SI, Figure S5).
For PP MPs, Pb, Sb, Cd and Zn were identified as additives (PA) but at quite different
concentrations: for instance in MPG-A and MPG-E; < 25 mg kg-1 for Sb and > 1000 mg kg-1 for Pb. MPG-F (PE) presents a PA profile for Zn with a concentration of approximately 20 mg
kg-1. On the other side, Sb and Pb can also be sorbed to PE MP surfaces (MPG-F, MPG-H, MPG-I) and therefore cannot be referred to as additives. Concerning specific PE MPs, Cd is present as an additive for three samples (MPG-H, MPG-I, and MPG-J) at concentrations ranging from 5 to 8 mg kg-1.
Cu is also used as a coloring additive and is found in blue and green microplastics (MPG-E and MPG-A). Note that for MPG-D, the Cu distribution does not refer to PA or PS. In this
particular case, it is difficult to interpret the diffusivity of the additive nature of this metal. A possible explanation could be the heterogeneous distribution of copper as an additive in native plastics.
Based on the results obtained on the quantitative analysis of the 4 PE and 6 PP MPs, none of these MPs present similar origins and metal distributions. Therefore, LA-ICP-MS analysis of a limited number of metals appears to be an innovative method to differentiate the origin of plastic samples, providing a “metal identity card” for microplastics.
Notably, the analysis was also performed on MPs previously rinsed with KOH (MPG-E and MPG-F) according to a protocol described in the literature21,22. This cleaning procedure is
10 applied to remove biofilms and other organic matter on surface of the microplastic. Our results (Figure S6) show no difference in the metal distribution by LA-ICP-MS, demonstrating that biofilm thickness on the microplastic surface generally ranges from 0.3 to 0.8 m. Based on the depth of each laser ablation step (i.e. 50 m), their contribution to the metal distribution is negligible.23 These similar results between treated and untreated MPs illustrate the advantage of directly analyzing MPs after sampling, reducing the pretreatment time. A rapid analysis of the MP subsurface with sizes over 400 m and for 6 metals (Zn, As, Cd, Sn, Sb and Pb) seems to be a sufficient and easy strategy to obtain a reliable fingerprint of the metal distribution in the MPs, opening new opportunities to investigate the life-cycle of plastic debris.
3.2 Spatiotemporal correlations
To investigate the metal distribution to trace the life-cycle of the microplastics, we choose As due to its abundance and presence in the subsurface in all samples. The interactions of arsenic with the microplastic surface can be due to the presence of organic matter or biological materials (ecocorona) or other inorganic molecules such as iron oxides. In the present work, we can consider that the trace elements were sorbed into the microplastics in seawater through a biological interface. It is also well known that sargassum algae, which was present where the microplastics were sampled, contains a large quantity of As, probably in its organic forms, which was not investigated here. Direct complexation of As(III) by organic matter or by analogy to the microplastic surface groups could be essentially due to the phenolic groups losing an OH- from As(OH)3. However, phenolic groups are relatively rare in OM and on the
11
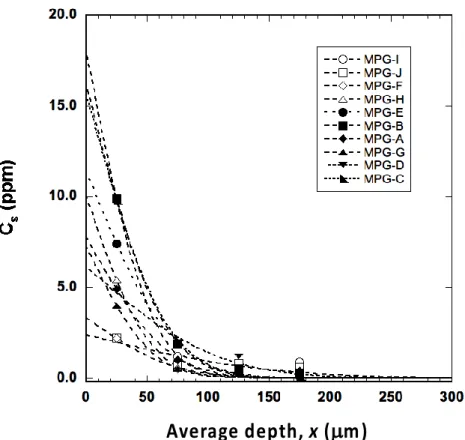
Figure 3: As concentration variation (Cs) according to the MP depth ablated (x). Dashed lines
are curve fits calculated using an iterative procedure following equation 3.
Figure 3 illustrates the As concentration variation according to the MP depth ablated. To express the depth, we determined the half-distance (x) to the surface at each ablation step: 25, 75, 125 and 175 µm. The curve fits based on the Levenberg-Marquardt algorithm were calculated using an iterative procedure based on equation 3. The iteration results in terms of As concentration at the MP surface (Cs), diffusion length ((Dt)0.5) and regression coefficient (R2) are reported in Table 1. The surface coating rate (Qs) in As on the surface of the MP is also indicated. Qs was calculated from equation 4 considering the atomic radius of arsenic at 115 pm.
Figure 3:
12
Table 1: Iteration results of all samples in terms of As concentration at the MP surface (Cs),
diffusion length ((Dt)0.5) and regression coefficient (R2). Relative exposure time (tR) and
surface coating rate (Qs) in As on the surface of the MP.
PE PP MPG-# I J F H E B A G D C CI 0.22 0.30 0.58 0.61 0.12 0.18 0.30 0.42 0.43 0.61 Cs (g.g-1) 183 2.40.6 3.30.5 101 11.50.2 161 81 7.30.7 6.10.6 15.80.4 (Dt)0.5 (m) 295 813 397 294 381 342 366 293 597 361 R2 0.9834 0.7457 0.9645 0.9901 0.9997 0.9966 0.9770 0.9929 0.9756 0.9992 tR 1 8.1 1.9 1 1.7 1.4 1.5 1 4 1.5 Qs (%) 19.6 7.1 4.9 10.6 16.3 20.7 10.5 7.9 13.4 20.8
For a constant diffusion coefficient, as a first approximation, it is possible to determine a relative exposure time (tR) for each sample for comparison. The reference time was taken
arbitrarily for the PE or PP sample having the smallest diffusion length. To the best of our knowledge, the diffusion coefficients of As and other metals in plastics have not yet been reported. However, considering diffusion lengths between 28 and 81 m and given the diffusion coefficient of arsenic in polyolefins on the order of 10-13 to 10-14 cm2 s-1, exposure times would be on the order of 2-200 years. The As surface concentration (Cs) represents the time-weighted average concentration of the exposure medium. In our study, Cs ranged from 2.4 to 16.3 mg kg-1. These values are relatively high compared to the average arsenic concentration in seawater, which is generally approximately 1.7 g L-1. 25 We attribute these values to the average concentration contained in the biofilm coating the MPs during their exposure phase in seawater, and it cannot be compared with works in the literature on the analysis of metals, arsenic and others, present in macro- or microplastics. Indeed, we have demonstrated that the quantities depend on the subsurface sorption layer and therefore on the ratio of this layer to the size of the microplastic analyzed. In these studies, the values were, to the best of our knowledge, expressed as a function of the mass of plastic recovered and digested without considering this ratio.
13 They are useful in qualitative analysis to give an order of magnitude but do not reflect the effective content per collected object. As a result, any comparison is erroneous if it concerns adsorbed metal, which is not the case for either additives or microplastics that are small relative to the sorption layer, on the order of a hundred micrometers. In our work, however, microplastics that would be fragmented at the subsurface level after a sufficiently long sorption period remain unclear. In this case, the profiles presented previously (Figure 2) for all the metals characterized would correspond to a singular mapping to be considered as such. Thus, Cs can be considered as an indicator of the exposure zone of the plastic waste. In our case, it was possible to differentiate the samples into four distinct families: 2-4 mg kg-1 for MPG-J and MPG-F; 6-8 g.g-1 for MPG-A, MPG-G and MPG-D; 10-12 g.g-1 for MPG- H and MPG-E; and 16-18 g.g-1 for MPG-I, MPG-B and MPG-C. Each family of MPs stayed in a similar environment regarding the average As concentration, which must be considered as a time-weighted average concentration because the sample was transported through areas with more or less As. This approach is quite interesting for establishing a spatiotemporal map of the samples collected on the beach as in our study or in marine and river systems. If we consider a diffusion coefficient of 10-13 cm2 s-1 for As, we can estimate an average exposure time (texp) and report it as a function of the average As concentration at the MP surface on an
iso-intensity curve as a function of the number of samples. Even if our study is subjective in terms of the number of MPs sampled, Figure 4 gives an example of a representation that can be obtained. This proof-of-concept opens the door to new possibilities for tracing the location and stay duration of MPs from different collection sites. In a representative way (large MP sampling), we would clearly see that a large portion of MPs have exposure times of a few years and come from As-rich areas. In contrast, a minor proportion of MPs present longer exposure times (a few tens of years) in As-poor locations.
14
Figure 4: Iso-intensity curve of MP sampling on the beach (Guadeloupe, France),
time-weighted average concentration of As and exposition time calculated with D=10-13 cm2.s-1.
4. Conclusion
The characterization of the microplastic subsurface, defined as greater than 25% of the sample thickness, i.e., more than half the surface-to-core distance, is highly challenging, but it is necessary to obtain information on the fate, transport and reactivity and finally impact of MPs on living organisms. In the present study, we demonstrated that this challenge can be addressed by LA-ICP-MS-based methods. We can easily and rapidly discriminate the presence of additives such as Pb, Cu or Sb, but we can also determine the presence of adsorbed metals (Fe, Cu, Zn, As, Cd, Sn, Sb, Pb and U). In this study, the LA-ICP-MS methodology allowed the establishment of a mapping of the sorption or additive profiles according to qualitative and quantitative approaches, which can be considered a fingerprint or identity card of the microplastic in relation to its life cycle. A spatiotemporal correlation of the sorption process in the subsurface of As is proposed as a proof of concept to compare
ti m e -w e ig h te d a v e ra ge c o n ce n tr a ti o n o f A s (p p m )
15 microplastics in terms of the relative time of exposure and the time-weighted average As concentration in seawater.
Conflicts of Interest
The authors declare that they have no conflicts of interest.
Acknowledgments
We acknowledge funding and support from the French Agency for Research - ANR (Agence Nationale de le Recherche, France) PRC program through the PEPSEA project (ANR-17-CE34-0008) coordinated by Julien Gigault and the Nouvelle-Aquitaine Region (En-Pi and AQUITRACE projects).
References
(1) Andrady, A. L. Microplastics in the Marine Environment. Mar. Pollut. Bull. 2011, 62 (8), 1596–1605. https://doi.org/10.1016/j.marpolbul.2011.05.030.
(2) Trevisan, R.; Voy, C.; Chen, S.; Di Giulio, R. T. Nanoplastics Decrease the Toxicity of a Complex PAH Mixture but Impair Mitochondrial Energy Production in Developing
Zebrafish. Environ. Sci. Technol. 2019, 53 (14), 8405–8415.
https://doi.org/10.1021/acs.est.9b02003.
(3) Pessoni, L.; Veclin, C.; El Hadri, H.; Cugnet, C.; Davranche, M.; Pierson-Wickmann, A.-C.; Gigault, J.; Grassl, B.; Reynaud, S. Soap- and Metal-Free Polystyrene Latex Particles as a Nanoplastic Model. Environ. Sci. Nano 2019, 6 (7), 2253–2258. https://doi.org/10.1039/C9EN00384C.
(4) Avio, C. G.; Gorbi, S.; Regoli, F. Plastics and Microplastics in the Oceans: From Emerging Pollutants to Emerged Threat. Mar. Environ. Res. 2017, 128, 2–11. https://doi.org/10.1016/j.marenvres.2016.05.012.
(5) Hahladakis, J. N.; Velis, C. A.; Weber, R.; Iacovidou, E.; Purnell, P. An Overview of Chemical Additives Present in Plastics: Migration, Release, Fate and Environmental Impact during Their Use, Disposal and Recycling. J. Hazard. Mater. 2018, 344, 179–199. https://doi.org/10.1016/j.jhazmat.2017.10.014.
(6) Holmes, L. A.; Turner, A.; Thompson, R. C. Adsorption of Trace Metals to Plastic Resin Pellets in the Marine Environment. Environ. Pollut. 2012, 160, 42–48. https://doi.org/10.1016/j.envpol.2011.08.052.
16 among Plastic Types: Implications for Plastic Debris in Aquatic Environments. PLoS ONE
2014, 9 (1), e85433. https://doi.org/10.1371/journal.pone.0085433.
(8) Brennecke, D.; Duarte, B.; Paiva, F.; Caçador, I.; Canning-Clode, J. Microplastics as Vector for Heavy Metal Contamination from the Marine Environment. Estuar. Coast. Shelf
Sci. 2016, 178, 189–195. https://doi.org/10.1016/j.ecss.2015.12.003.
(9) Gao, F.; Li, J.; Sun, C.; Zhang, L.; Jiang, F.; Cao, W.; Zheng, L. Study on the Capability and Characteristics of Heavy Metals Enriched on Microplastics in Marine
Environment. Mar. Pollut. Bull. 2019, 144, 61–67.
https://doi.org/10.1016/j.marpolbul.2019.04.039.
(10) Holmes, L. A.; Turner, A.; Thompson, R. C. Interactions between Trace Metals and Plastic Production Pellets under Estuarine Conditions. Mar. Chem. 2014, 167, 25–32. https://doi.org/10.1016/j.marchem.2014.06.001.
(11) Vedolin, M. C.; Teophilo, C. Y. S.; Turra, A.; Figueira, R. C. L. Spatial Variability in the Concentrations of Metals in Beached Microplastics. Mar. Pollut. Bull. 2018, 129 (2), 487– 493. https://doi.org/10.1016/j.marpolbul.2017.10.019.
(12) Galloway, T. S.; Cole, M.; Lewis, C. Interactions of Microplastic Debris throughout the Marine Ecosystem. Nat. Ecol. Evol. 2017, 1 (5), 1–8. https://doi.org/10.1038/s41559-017-0116.
(13) Nguyen, B.; Claveau-Mallet, D.; Hernandez, L. M.; Xu, E. G.; Farner, J. M.; Tufenkji, N. Separation and Analysis of Microplastics and Nanoplastics in Complex Environmental
Samples. Acc. Chem. Res. 2019, 52 (4), 858–866.
https://doi.org/10.1021/acs.accounts.8b00602.
(14) Baer, D. R.; Gaspar, D. J.; Nachimuthu, P.; Techane, S. D.; Castner, D. G. Application of Surface Chemical Analysis Tools for Characterization of Nanoparticles. Anal. Bioanal.
Chem. 2010, 396 (3), 983–1002. https://doi.org/10.1007/s00216-009-3360-1.
(15) Ashton, K.; Holmes, L.; Turner, A. Association of Metals with Plastic Production Pellets in the Marine Environment. Mar. Pollut. Bull. 2010, 60 (11), 2050–2055. https://doi.org/10.1016/j.marpolbul.2010.07.014.
(16) Prunier, J.; Maurice, L.; Perez, E.; Gigault, J.; Pierson Wickmann, A.-C.; Davranche, M.; Halle, A. ter. Trace Metals in Polyethylene Debris from the North Atlantic Subtropical Gyre. Environ. Pollut. 2019, 245, 371–379. https://doi.org/10.1016/j.envpol.2018.10.043. (17) Magrì, D.; Sánchez-Moreno, P.; Caputo, G.; Gatto, F.; Veronesi, M.; Bardi, G.; Catelani, T.; Guarnieri, D.; Athanassiou, A.; Pompa, P. P.; Fragouli, D. Laser Ablation as a Versatile Tool To Mimic Polyethylene Terephthalate Nanoplastic Pollutants: Characterization
17
and Toxicology Assessment. ACS Nano 2018, 12 (8), 7690–7700.
https://doi.org/10.1021/acsnano.8b01331.
(18) Koch, J.; Günther, D. Review of the State-of- The-Art of Laser Ablation Inductively Coupled Plasma Mass Spectrometry. Appl. Spectrosc. 2011, 65 (5), 155A-162A. https://doi.org/10.1366/11-06255.
(19) Eriksen, M.; Thiel, M.; Lebreton, L. Nature of Plastic Marine Pollution in the Subtropical Gyres. In Hazardous Chemicals Associated with Plastics in the Marine
Environment; Takada, H., Karapanagioti, H. K., Eds.; Springer International Publishing:
Cham, 2016; Vol. 78, pp 135–162. https://doi.org/10.1007/698_2016_123.
(20) ter Halle, A.; Ladirat, L.; Martignac, M.; Mingotaud, A. F.; Boyron, O.; Perez, E. To What Extent Are Microplastics from the Open Ocean Weathered? Environ. Pollut. 2017, 227, 167–174. https://doi.org/10.1016/j.envpol.2017.04.051.
(21) Dehaut, A.; Cassone, A.-L.; Frère, L.; Hermabessiere, L.; Himber, C.; Rinnert, E.; Rivière, G.; Lambert, C.; Soudant, P.; Huvet, A.; Duflos, G.; Paul-Pont, I. Microplastics in Seafood: Benchmark Protocol for Their Extraction and Characterization. Environ. Pollut.
2016, 215, 223–233. https://doi.org/10.1016/j.envpol.2016.05.018.
(22) Karami, A.; Golieskardi, A.; Choo, C. K.; Romano, N.; Ho, Y. B.; Salamatinia, B. A High-Performance Protocol for Extraction of Microplastics in Fish. Sci. Total Environ. 2017,
578, 485–494. https://doi.org/10.1016/j.scitotenv.2016.10.213.
(23) Rummel, C. D.; Jahnke, A.; Gorokhova, E.; Kühnel, D.; Schmitt-Jansen, M. Impacts of Biofilm Formation on the Fate and Potential Effects of Microplastic in the Aquatic
Environment. Environ. Sci. Technol. Lett. 2017, 4 (7), 258–267.
https://doi.org/10.1021/acs.estlett.7b00164.
(24) Buschmann, J.; Kappeler, A.; Lindauer, U.; Kistler, D.; Berg, M.; Sigg, L. Arsenite and Arsenate Binding to Dissolved Humic Acids: Influence of PH, Type of Humic Acid, and
Aluminum. Environ. Sci. Technol. 2006, 40 (19), 6015–6020.
https://doi.org/10.1021/es061057+.
(25) Neff, J. M. Chapter 3 - Arsenic in the Ocean. In Bioaccumulation in Marine
Organisms; Neff, J. M., Ed.; Elsevier: Oxford, 2002; pp 57–78.