XV. COMMUNICATIONS BIOPHYSICS
Prof. W. A. Rosenblith Dr. N. Y. S. Kiang R. M. Brown Dr. J. S. Barlow* Dr. T. T. Sandel C. D. Geisler
Dr. M. A. B. Brazier A. E. Albert M. H. Goldstein, Jr.
Dr. L. S. Frishkopf R. Koehler
A. BIFREQUENCY ANALYSIS OF REPETITIVE AUDITORY STIMULI
Psychophysical experiments show that certain acoustic signals are described by listeners as having a low-pitched quality, although they contain no Fourier components in the corresponding portion of the spectrum (1, 2, 3, 4, 5). These results contradict the usual statement of Ohm's acoustic law, according to which a complex stimulus is ana-lyzed with respect to its Fourier components during the listening process. Experimental
evidence indicates that there is nonlinear action of the auditory system. Since these results are obtainable at near-threshold intensities, it is likely that at least some of the nonlinearity is neural in origin rather than mechanical.
A mathematical transform was developed which gives a simple representation of the aforementioned signals. The transform is a function of two variables, both of which have the dimension of frequency. The usefulness of this bifrequency transform for representing auditory signals derives from the close relation of one coordinate to Fourier frequency and of the other to the time-varying envelope of the signal.
A signal of special interest in auditory experiments is formed by gating (modulating) wideband noise with an electronic switch to form bursts of noise. Judgments can be obtained for changes in burst rate that are just noticeable. The spectral density of the bursts-of-noise signal remains identical to the spectral density of the unmodulated noise, independent of burst rate. If, however, the modulated signal is treated as a time-varying statistical signal, following the representation used by Booton (6), its periodic nature becomes evident. Booton's analysis includes a correlation function based on ensemble averages, rather than on averages over time, yielding the function of two variables
4(r,
t)
= x(t) x(t+T)
where the bar indicates an average over the ensemble of the statistical function.
There is sufficient difference between the psychophysical and the physical situations with statistical inputs to indicate that the concept of taking an average over the statisti-cal ensemble must be carefully examined. There is evidence that a listener's judg-ments are influenced both by past experience and instructional constraints. This psychophysical ensemble in which the stimulus appears may differ widely from the
,From the Neurophysiological Laboratory of the Neurology Service of the Mass-achusetts General Hospital.
(XV. COMMUNICATIONS BIOPHYSICS)
statistical ensemble from which the stimulus is drawn. Furthermore, the subject has for his stimulus only one member function of the statistical ensemble, so that use of a representation based on an average over the total ensemble loses validity. For statisti-cally described signals of a periodic nature the average can be taken in a special manner, with the result that we have the correlation function,
(T, t) = x(t) x(t+T)
where the T indicates the operation of averaging products that are formed from pairs of samples spaced by intervals equal to the period, T, of the time variation. Thus, 1(T, t) could also be written
K
(T, t) = lim x(t + KT) x(t + T + KT)
K-oo -K
where K takes on integral values.
The Fourier transform of the correlation function results in a spectral density
00
S(D , t) =
;
e (T, t) drthat varies in time. Since (T, t) is periodic in t, (P(w, t) is also periodic in t.
T (W.k)
Fig. XV-1.
4(w,
4) for interrupted white noise
(sound-time fraction
=
0. 5).
(XV. COMMUNICATIONS BIOPHYSICS)
A further Fourier transformation results in the bifrequency transform 00 e Jt (,t)dt
-00
For a fixed w, \(w, p.) is a series of delta impulses at evenly spaced intervals in ., owing to the periodic nature of D(, t).
The steps involved in obtaining the bifrequency transform for a statistically described signal can be extended to the case of a signal which is a known function of
time whose Fourier transform is F(w). Now, no averaging is necessary and the resulting functions are
(7, t) = f(t) f(t+T)
00
(w, t) = e -J T (T, t) dT = f(t) ejwt F(w) (W, p) = f e- t 1(w,t) dt = F(w) F(-w)The second function is similar to one obtained by Ville (7). If f(t) is periodic, F(w) is a series of delta impulses, and (w, p ) contains impulses in both variables. The form
of the bifrequency representation is best demonstrated by a few simple examples.
The bifrequency transform of periodically gated white noise is shown in Fig. XV. 1. The sound-time fraction refers to the ratio of the length of a burst to the gating cycle. The transform takes the form of a number of "fences" parallel to the w-axis. For a
fixed w, the function of p is a series of impulses occurring at pLp = 0 and all odd multiples of p , the gating frequency. The flat characteristic of white
100% Amplitude Modulation noise in the w (Fourier frequency) dimension
Suppressed-Carrier Modulation is retained, while the periodic nature of the
"Missing Fundamental" modulation is manifest in the structure of
/
Chopped Noise
in the
4
(periodicity) dimension.
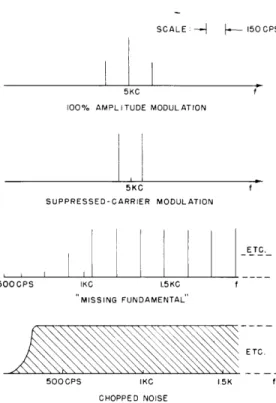
In Fig. XV-2 oscillographic traces of four 150-cps sinusoid
signals are shown: a 100 per cent amplitude-modulated 5-kc signal, a suppressed-carrier-Fig. XV-2. Signal waveforms. modulated 5-kc signal, the "missing fundamental"
--A-- 150 CPS 5KC 100% AMPLITUDE MODULATION 5KC f SUPPRESSED-CARRIER MODULATION ETC. 500CPS IKC 1.5KC MISSING FUNDAMENTAL SETC. 500CPS 15K f CHOPPED NOISE
Fig. XV-3. Spectral representation of signals.
SCALE-- -50CPS . 0 5KC FREQUENCY 100% AMPLITUDE MODULATION ETC. 600 - * * • • 450 * * * • 300 * * * • ETC 150- * * * * * * * 0 v -- - . . . _ IKC 15KC FREQUENCY MISSING FUNDAMENTAL' 450-300 u150 - 150 O C 5KC 500CPS IKC FREQUENCY FREQUENCY
SUPPRESSED-CARRIER MODULATION CHOPPED NOISE
Fig. XV-4. Bifrequency representation of signals.
o 030( S151 -U
-
U SCALE:-.(XV. COMMUNICATIONS BIOPHYSICS)
signal of Schouten (1), and bursts of wideband noise. These signals have some quality of low pitch, although, as is evident in Fig. XV-3, their spectra contain no components in the low-frequency range. A representation of the signals in the bifrequency plane is presented in Fig. XV-4. A two-dimensional plot in only one quadrant of the 1 -0w plane is used. The dots represent "impulses" in both the [ and w variables, and the bars indicate impulse fences, with the thickness of the dot or bar corresponding roughly to the size of the impulse. In each case, the bifrequency transform has components with a periodicity coordinate of 150 cps.
The bifrequency transform is one of several possible mathematical representations of repetitive auditory signals that predict the results of psychophysical tests when con-ventional spectral representation fails to do so. Bifrequency transformation retains
the conventional spectral picture, adding at the same time some temporal aspects that are so important in understanding the functioning of the auditory system.
M. H. Goldstein, Jr.
References
1. J. F. Schouten, Philips Tech. Rev. 5, 286 (Oct. 1940).
2. R. C. Mathes and R. L. Miller, J. Acoust. Soc. Am. 19, 780 (Sept. 1947).
3. G. A. Miller and W. G. Taylor, J. Acoust. Soc. Am. 20, 171-182 (March 1948).
4. H. Davis, S. R. Silverman, and D. R. McAuliffe, J. Acoust. Soc. Am. 23, 40-42
(Jan. 1951).
5. A. M. Small, Jr., J. Acoust. Soc. Am. 27, 751-760 (July 1955).
6. R. C. Booton, Jr., Proc. IRE 40, 977 (Aug. 1952).
7. J. Ville, Theorie et applications de la notion de signal analytique, Cables et
Trans-missions 2, 61-74 (1948).
B. RESPONSES TO CLICKS RECORDED FROM THE ANTERIOR SUPRASYLVIAN GYRUS
Merlis and Lombroso (1) reported that in cats anesthetized with Dial, responses to clicks are recorded from a large portion of the anterior suprasylvian gyrus (Fig. XV-5). In their experiments, clicks delivered to one ear evoke comparable responses from anterior suprasylvian gyri on both sides. Later (2) they found that destruction of the cochlea opposite the stimulated ear resulted in a marked decrease in the size of the
response on the side contralateral to the destroyed cochlea, as well as a slight increase on the side ipsilateral to the destroyed cochlea.
We have corroborated these findings and have attempted to elucidate the mechanisms underlying these rather surprising phenomena. For click stimuli of high intensities, it
(XV. COMMUNICATIONS BIOPHYSICS)
ANT SUPRASYLVIAN^ SUDRASYLVIAN SULCUS
ECTOSYLVIAN SULCUS
Fig. XV-5.
Map of
a
cat's brain (left
side); the stippled arearepresents the anterior
suprasylvian gyrus.
is possible that an airborne click stimulates the "unstimulated" ear. The bulla on
the unstimulated side was opened in an acute preparation. The responses that were
recorded resembled those observed after destruction of the "unstimulated" cochlea.
When the hole in the bulla was resealed with bonewax, the response at both cortices
became similar again.
When the bonewax was removed, the response at the
contra-lateral cortex was again greatly reduced.
This procedure was repeated several times,
and the results were identical.
These same procedures, including destruction of one
cochlea, have essentially no effect on auditory responses recorded from the ectosylvian
gyrus on either side.
It seems reasonable, therefore, to suppose that there is a
path-way from each cochlea to the contralateral anterior suprasylvian gyrus with a much
smaller, if any, projection to the ipsilateral anterior suprasylvian gyrus and that
most of the response recorded from the ipsilateral anterior suprasylvian gyrus is
attributable to cross-stimulation (acoustic leakage) of the other ear.
We have used both monopolar and vertically-oriented, concentric, penetrating
electrodes in an effort to check whether or not the potentials recorded at the anterior
suprasylvian gyrus are local in origin. Although we did not make an exhaustive
exami-nation, for the numerous points that we did examine, the monopolar electrodes do not
show reversals of polarity as they penetrate the anterior suprasylvian gyrus and the
bipolar electrodes do not essentially demonstrate potential differences at any pair of
points when they are pushed through the cortex. These results indicate that most of the
responses recorded at the anterior suprasylvian gyrus are not locally generated but
represent electrical spread from elsewhere.
The potentials may originate in some
small part of the anterior suprasylvian gyrus that has not yet been tested, or they may
come from areas that lie entirely outside the anterior suprasylvian gyrus.
Experiments involving the use of strychnine, or chronic preparations in which one
cochlea was destroyed, have given equivocal results.
N. Y. S. Kiang
References
1.
J. K. Merlis and C. Lombroso, Third International Congress of
EEG
and Clinical
Neurophysiology, August 17-22, 1953. Abstract No. 54, Suppl. III,
EEG
Jour., p. 70.
2.
J. K. Merlis, Personal communication.
DELAY (SEC) 0 0.1 0.2 0.3 0.4 0.5 0.6 0.7 0.8 0.9 4 _ --- -DELAY (SEC) 0 0.1 0.2 0.3 0.4 0.5 0.6 0.7 0.8 0.9 DELAY (SEC) 0 0.1 0.2 0.3 0.4 0.5 0.6 0.7 0.8 0.9 S / / / / /
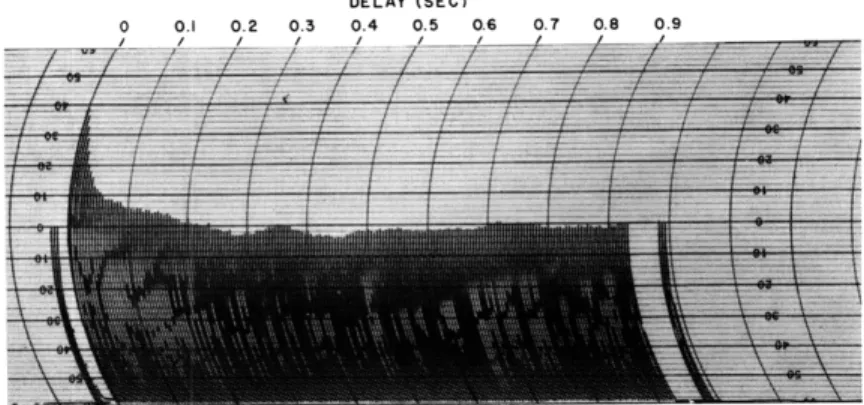
Fig. XV-6.
Autocorrelations from an anterior location on the lateral gyrus:
(a) without stroboscopic stimulation; (b) with stroboscopic
lation, flash rate about 1 per second; (c) with stroboscopic
stimu-lation, flash rate about 9 per second. Length of sample, 1 minute;
steps of delay aT, 5 msec.103
DELAY (SEC) 0 0.1 0.2 0.3 0.4 0.5 0.6 0.7 0.8 0.9 DELAY (SEC) 0 0.1 0.2. 0.3 0.4 0.5 0.6 0.7 0.8 0.9 .J J I / / DELAY (SEC) 0 0.1 0.2 0.3 0.4 0.5 ,/0.6 0.7 0.8 0.9
Fig. XV-7.
Autocorrelations from lateral geniculate body.
(a) without
strobo-scopic stimulation; (b) with strobostrobo-scopic stimulation, flash rate
about 1 per second; (c) with stroboscopic stimulation, flash rate
about 10 per second.
Length of sample, 1 minute; steps of delay
AT, 5 msec.(XV.
COMMUNICATIONS BIOPHYSICS)
C. CORRELATION STUDIES OF EFFECTS OF VISUAL STIMULATION UPON ANESTHETIZED CATS
Simultaneous recordings with and without stroboscopic stimulation were made from the lateral geniculate nuclei, and from several points on the lateral gyrus (visual cortex) of cats under nembutal anesthesia. Autocorrelations of depth and surface recordings and crosscorrelations of depth with surface recordings were obtained. Crosscorrelation of stimuli with recorded activity by the method described previously (1,2) was used to obtain averages of responses evoked by visual stimulation at these two-way stations of the visual pathway. Examples of results obtained with unipolar recordings are shown in Figs. XV-6, 7, 8, and 9. Figure XV-6 shows how the autocorrelation from an anterior position on the lateral gyrus is altered as a result of stroboscopic stimulation
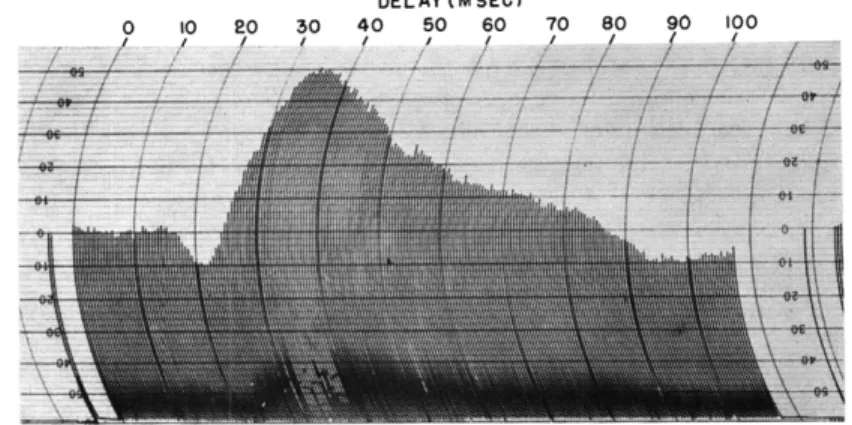
DELAY (M SEC)
0 10 20 30 40 50 60 70 80 90 100
Fig. XV-8.
Averaged response from anterior lateral gyrus to 180
strobo-scopic stimuli at a rate of 1 per second.
Steps of delay
AT,0. 5 msec.
(Same cat as in Fig. XV-6.)
DELAY (M SEC)
0 20 40 60 80 100 120 140 160 180 200 220 240 260
Fig. XV-9.
Averaged response from lateral geniculate nucleus to 60
strobo-scopic stimuli at a rate of 1 per second. Steps of delay
AT,1 msec.
105
_
(XV. COMMUNICATIONS BIOPHYSICS)
at approximately 1 and 9 flashes per second, respectively. With a stimulation rate of 9 per second, a new rhythm of the same frequency as the stimulus appears in the cor-relogram; there is also present a rhythm of three times the stimulus frequency.
Figure XV-7 shows, for another cat, the alteration of the autocorrelation from the lat-eral geniculate nucleus, by the imposition of stimuli of about 1 and 10 flashes, respec-tively. At a flash rate of 10 per second, there is a rhythm of twice the stimulus rate, in addition to the rhythm at the same frequency as the stimulus. (For an example of the autocorrelation of a mixture of a sine wave and its second harmonic, see Fig. XIX-6a, Quarterly Progress Report, January 15, 1956, p. 144.)
Figure XV-8 indicates the averaged response obtained from 180 successive photic stimuli at 1 flash per second, from an anterior position on the lateral gyrus for the same cat from which the results of Fig. XV-6 were obtained. The steps of delay AT are 0. 5 msec. The latency of onset of the surface positivity is 17 msec, the peak of surface positivity occurs at 22 msec, and the peak of the surface negativity occurs at 36 msec. Figure XV-9 shows the averaged response from 60 flashes, at a rate of 1 flash per second from the lateral geniculate nucleus of another cat, at a different level of anesthesia. The steps of delay AT are 1 msec. Latencies in this case are as follows: onset of positivity, 18 msec; peak of positivity, 26 msec; and peak of nega-tivity, 75 msec.
In cooperation with the Medical Acoustics Research Group at the Massachusetts General Hospital, recordings for correlation analysis similar to those described above are being made in anesthetized cats in which a lesion has been previously made by ultrasonic radiation in the lateral geniculate nucleus on one side, the second, unirradi-ated side being used as the control (3). Correlograms obtained from these recordings will be discussed at a later time.
M. A. B. Brazier, J. S. Barlow
References
1. J. S. Barlow and M. A. B. Brazier, Quarterly Progress Report, Research Labora-tory of Electronics, M.I.T. , April 15, 1955, p. 79.
2. J. S. Barlow and R. M. Brown, Technical Report 300, Research Laboratory of Electronics, M.I.T., July 14, 1955.
3. M. A. B. Brazier, J. S. Barlow, T. F. Hueter, and H. T. Ballentine, Alteration of brain function by focused ultrasound, Quarterly Progress Report, Acoustics Laboratory, M.I.T., Jan. -March, 1956.
Fig. XV-10a.
Autocorrelation of brain potential (between electrodes at left temporal location and chin) recorded while clicks were presented (at 1 per second) to the right ear. Correlation is plotted against delayof the sample with respect to itself. The analyzed sample was 4 minutes long; the delay step
(between successive lines of the record) is 4 msec. Zero correlation is shown by the three lines
at the beginning and end of the record.
Fig. XV-10b.
The result of crosscorrelating the same sample with pulses occurring at the times of the stimuli.
The delay step is again 4 msec.
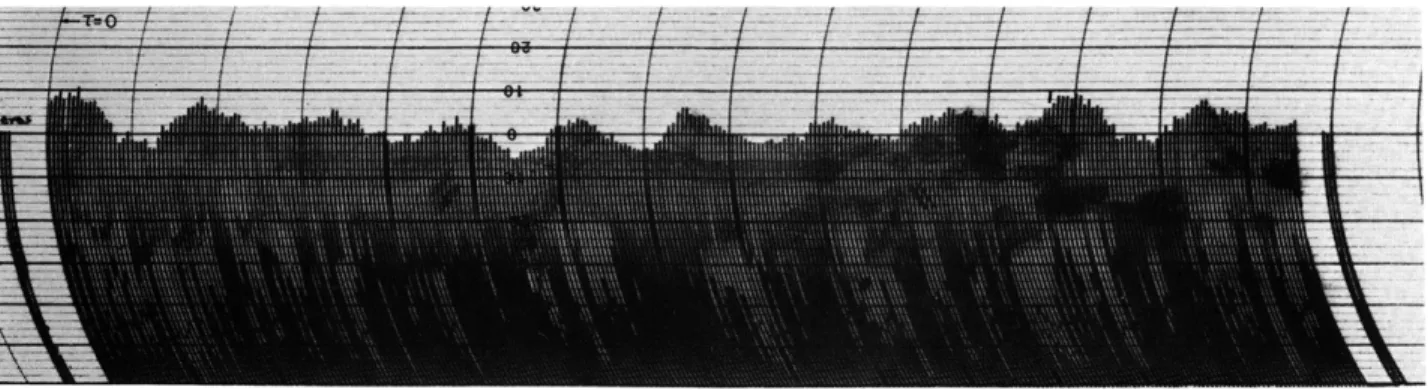
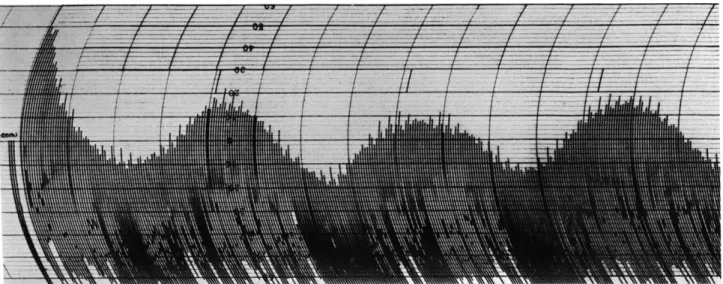
Fig. XV-11.
Autocorrelation of brain potential (electrodes at left temporal location and chin) recorded while
clicks were presented to the right ear at the rate of about 3 per second.
The analyzed sample
was 4 minutes long; the delay step is 4 msec.
(Compare this autocorrelation function with
Fig. XV-10a; the time scale and electrode locations are the same.)
The vertical lines above
the correlation indicate the repetition rate of the stimulus.
The fast component that is
super-imposed on the record represents the autocorrelation of line-voltage pickup (60 cps).
(XV. COMMUNICATIONS BIOPHYSICS)