Publisher’s version / Version de l'éditeur:
Vous avez des questions? Nous pouvons vous aider. Pour communiquer directement avec un auteur, consultez la
première page de la revue dans laquelle son article a été publié afin de trouver ses coordonnées. Si vous n’arrivez pas à les repérer, communiquez avec nous à [email protected].
Questions? Contact the NRC Publications Archive team at
[email protected]. If you wish to email the authors directly, please see the first page of the publication for their contact information.
https://publications-cnrc.canada.ca/fra/droits
L’accès à ce site Web et l’utilisation de son contenu sont assujettis aux conditions présentées dans le site
LISEZ CES CONDITIONS ATTENTIVEMENT AVANT D’UTILISER CE SITE WEB.
Technical Memorandum (National Research Council of Canada. Division of
Building Research); no. DBR-TM-98, 1969-10-23
READ THESE TERMS AND CONDITIONS CAREFULLY BEFORE USING THIS WEBSITE.
https://nrc-publications.canada.ca/eng/copyright
NRC Publications Archive Record / Notice des Archives des publications du CNRC :
https://nrc-publications.canada.ca/eng/view/object/?id=50c4a1f1-0608-4db2-9ccd-74b038ef41bb https://publications-cnrc.canada.ca/fra/voir/objet/?id=50c4a1f1-0608-4db2-9ccd-74b038ef41bb
Archives des publications du CNRC
This publication could be one of several versions: author’s original, accepted manuscript or the publisher’s version. / La version de cette publication peut être l’une des suivantes : la version prépublication de l’auteur, la version acceptée du manuscrit ou la version de l’éditeur.
Access and use of this website and the material on it are subject to the Terms and Conditions set forth at
Ice engineering and avalanche forecasting and control
ASSOCIATE COMMITTEE ON GEOTECHNICAL RESEARCH
ICE ENGINEERING AND
A VALANCHE FORECASTING AND CONTROL
PROCEEDINGS OF A CONFERENCE HELD AT THE UNIVERSITY OF CALGARY
23-24 OCTOBER 1969
SPONSORED BY THE SUBCOMMITTEE ON SNOW AND ICE
TECHNICAL MEMORANDUM NO. 98
COMPILED BY L. W.. GOLD AND G. P .. WILLIAMS
OTTAWA NOVEMBER 1970
Avalanche research and ice pressures against structures were the topics chosen for discussion at the Sixth Conference on Snow and Ice sponsored by the Snow and Ice Subconunittee of the NRC Associate
Committee on Geotechnical Research. These topics were very suitable
for the first of the Subcommittee's conferences to be held in Western Canada.
The need for information concerning avalanches, avalanche hazard forecasting and avalanche defence is increasing due to develop-ment acti vity and growth in winter sports in the mountains of Western
Canada. The papers presented to the Conference provide a good review
of the principal avalanche problems and the current state of avalanche research in Canada and United States.
The forces that ice can exert against structures were the subject
of the Committee's Fifth Conference on Snow and Ice.
*
Recent interestin the possibility of Arctic sea routes, and the need to review the de s i gn criteria for ice pressures for bridge piers, has brought about a rapid
development of this subject. Much of the interest and acti vity has been
in the West, a nd so it was appropriate to spend one day of the Conference on reports and discussions of work that had been done since the Fifth Conference.
Fi ve of the papers presented to the Conference are to be published
in the Canadian Geotechnical Journal. Extended abstracts only of these
papers are presented in these Proceedings.
The Associate Committee wishes to express its appreciation to the authors of papers, discussors, and all others who participated in the
Conference. It wishes also to express its appreciation to Miss J. Butler
for her assistance to Messrs. Gold and Williams in the preparation of this Technical Memorandum.
C. B. Crawford, Chairman,
Associate Committee on Geotechnical Research
*
Ice Pressures Against Structures,T. M. 92, Associate Committee on Geotechnical Research, National Research Council of Canada,
ICE ENGINEERING SESSIONS OCTOBER 23
SESSION I: - Chairman: Dr. R. F. Legget, Past-Chairman, Associate Committee on
Geotechnical Research
1. 1. Classification of Ri ver and Lake Ice Based on Its Genesis,
Structure and Texture. {Abstract}. - Professor B. Michel
and R. O. Ramseier, Laval University, Quebec City.. . . 1
1. 2. A Tentative Field Classification of Lake and River Ice.
-G. P. Williams, National Research Council, Ottawa. . . 5
1. 3. The Process of Failure in Ice. {Abstract}. - L. W. Gold,
National Research Council, Ottawa. . . 12
Discussion {Written} - H. R. Kivisild, Foundation of
Canada Engineering Corporation, Toronto. . . 13
SESSION II: - Chairman: Professor G. S. H. Lock,
Department of Mechanical Engineering, University of Alberta
II. 1. Movements in Continuous Lake Ice Sheets and Temperature Gradients in an Ice Sheet. - Professor S. S. Lazier and
F.A. MacLachlan, Queen's University, Kingston... 17
II. 2. Observations on Break-Up of River Ice in North Central Alberta. {Abstract}. - Professor J. Nuttall, University
of Alberta, Edmonton, Alberta... . . . 36
II. 3. Alberta Studies of Ice Pressure on Bridge Piers.
{Abstract}. - C. R. Neill, Research Council of Alberta,
Edmonton. . . 38 II. 4. Effective Force of Floating Ice On Structures.
-J. L. Allen, Monti, Lavoie and Nadon, Montreal, P. Q. 41
II. 5. Analysis of Forces in a Pile - Up of Ice. - J. L. Allen,
II. 6. Vibration of a Floating Ice Sheet. - D. E. Nevel,
U. S. Army Terrestrial Science Center, Hanover, N. H.
57
II. 7. The Flexural Strength of Sea Ice as Determined from Salinity and Temperature Profiles. - G. E. Frankenstein, U. S. Army Cold Regions Research and Engineering
Laboratory, Hanover, N. H. . . 66
A VALANCHE SESSIONS OCTOBER 24
SESSION III: - Chairman: G. Hattersley-Smith, Defence Research Board
III. 1. Problems in A valanche Forecasting and Control on the Trans Canada Highway in Glacier National Park. -W. E. Bottomley, National and Historic Parks Branch, Department of Indian Affairs and Northern Development,
Calgary, Alberta. ... . . 74
III. 2. Mining vs . Avalanches - British Columbia. - J. W. Peck,
Chief Inspector of Mines, British Columbia Department
of Mines and Petroleum Resources, Victoria, B. C. . . 79
III. 4. A valanche Problems in Canadian Recreation.
-C. B. Geisler, Canadian Ski Patrol System, Calgary, Alta. 91
III. 5. Planning Defences Against Avalanches. (Abstract).
-P. Schaerer, National Research Council, Vancouver, B. C. 97
III. 6. Avalanche Problems at Mine Sites. - M. M. Atwater,
A valanche Consultant, Olympic Valley, California. . . 99
SESSION IV: - Chairman: P.A. Schaerer,
National Research Council
IV. 1. Principles of Avalanche Forecasting. - E. R. LaChapelle,
University of Washington, Seattle, Washington. . . 106
IV. 2. On Contributory Factors in Avalanche Hazard Forecasting. (Abstract). - R.1. Perla; Forest Service, U. S. Department
IV. 3. Avalanche Hazard Evaluation and Forecast, Rogers Pass, Glacier National Park. - V. G. Schleiss and W. E. Schl e is s , National and Historic Parks Branch, Department of Indian
Affairs and Northern Development, Rogers Pass, B. C. . . . 115
IV. 4. A Pilot Study of Weather, Snow, and Avalanche Reporting for Western United States. - A. Judson, Forest Service,
U. S. Department of Agriculture, Fort Collins, Colorado. 123
IV. 5. A Process-Oriented Classification for Snow on the Ground. - R. Sommerfeld, Forest Service, U. S.
Depart-ment of Agriculture, Fort Collins, Colorado. .... . . 135
IV. 6. A TwoDimensional Approach to Avalanche Problems. -Professor H. W. Shen, Colorado State University,
Fort Collins, Colorado. . . 140
Conference Summary -- Dr. R. F. Legget 153
ITS GENESIS, STRUCTURE AND TEXTURE Bernard Michel* and Rene O. Ramseier Depa r tern ent de Genie Civil, Urri ve r s it e Laval
Quebec, P. Que.
**
(Abstract)
There is no classification of river and lake ice that takes into account simultaneously the history of ice formation, the structure of the
ice cover and the texture of the various types of ice. The classification
presented in this paper is an expanded version of that prepared by Michel (1).
The classification has three main aspects:
(1) definition of river and lake ice terms in a natural genetic scheme;
(2) description of the formation and physical properties of the three
important ice layers;
(3) description of the textures of the various ice types found in ice
covers.
GROWTH PROCESS AND FORMS OF ICE
Any genetic classification of ice must be based on a recognition of the dynamic, physical and mechanical factors which interact in the forma-tion of the ice cover.
There are two modes of ice co ver formation. The first one occurs
in an undisturbed body of water such as a lake or river with laminar flow. Under these conditions, a solid continuous ice sheet is formed with a
uniform structure in the horizontal plane. This ice sheet may originate
from border ice or plate ice formed on the water body. In rivers where
there is turbulent flow the formation is more dynamic and comes mainly
from the accumulation of frazil slush, pancake ice and ice floes. Wind and
wave action may also cause a similar process in lakes and coastal regions. An ice cover may be in the form of a continuous ice sheet or it may
be made up of unconsolidated ice accumulations. If the accumulation is
major it is called an ice jam. If it refreezes, it is a hummocked ice cover.
In certain cases great amounts of slush accumulate under an ice cover in zones of low flow velocity and form underhanging dams.
* Some of the material presented is part of a D. Sc. thesis by R. O. Ramseier at the Urri ve r s i.te Laval.
**
To be published in The Canadian Geotechnical Journal, Vol. 8, No.1,STRUCTURE AND TEXTURE OF ICE SHEETS AND ICE COVERS
The mechanical properties of ice depend to a large extent on crystal
size, shape and orientation. Gross features of the structure, which usually
appea r as horizontal layers in the ice cover, can be determined to some
extent in the field from a core or block taken from the cover. More
infor-mation concerning structure and texture can be obtained by cutting a thin slice from an ice block parallel to the direction of growth, and. viewing with polarized light if necessary.
In the classification, the vertical profile of the ice cover is
sub-divided into primary, secondary and snow ice. These terms have the
following definitions:
PriInary Ice: It is the first type of ice of uniform structure and texture
which forms on a water body. On a calm water body the primary
ice is in the form of an ice skim which grows horizontally in the
supercooled layer. In rough and turbulent waters the primary ice
consists of congealed frazil slush. Ifnucleation occurred by snow,
the resulting congealed snow slush would also be part of the primary ice.
Secondary Ice: The secondary ice forms parallel to the heat flow which
is perpendicular to the primary ice. Its structure is different from
the primary ice. It may be in the form of columnar ice whose
texture is entirely controlled by the primary ice. It also can be in
the form of deposited frazil slush or snow slush which after some time becomes an integral part of the ice cover.
Snow Ice: This type of ice always forms on top of the primary ice due
to snow deposits which lie on the ice cover. Snow ice may form
due to variations in discharge of water, by melt or rain, or by the depression of the ice cover due to a heavy snow load.
The types of ice in each layer and their grain size orientation and
shape can be determined by thin section analysis. It is recommended that
grain size be classified as fine grain (less than 1 mm); medium (1 to 5 mm);
large (5 to 20 mm); extra large (greater than 20 mm), and grand (dimensions
in meters). Two aspects of grain shape are important: the ratio of the
principal axes of the grains and the angularity of the crystal boundaries. Primary ice can be further subdivided according to the conditions of formation (e.g., calm surface, large or small temperature gradient,
agitated surface). Secondary ice can be composed of columnar grains with
the axis of crystal symmetry tending to be parallel or perpendicular to the direction of growth, depending on the condition of formation, or granular,
in distinct horizontal layers, but unstratified composite ice types can develop, particularly in rivers.
The structure and texture of ice covers are intimately related to the hydrodynamical and meteorological conditions that occurred during formation
and growth. Examples of various types of ice profiles, and discussions of
their dependence on formation and growth conditions, are given in the paper. REFERENCES
1. Michel, B. River Ice Engineering: - Winter Regime of Ri vers and
Lakes. U. S. Army Cold Regions Research and Engineering Laboratory,
Cold Science and Engineering, Monograph III, (in press).
* * * * *
DiscussionW. P. Langleben: Drs. Michel and Ramseier are to be congratulated
for the importance attached in their classification of lake and ri ver ice to the clear distinction between frazil ice, ice which has undergone natural
growth and snow-ice. Each of these types have different physical properties.
Some twelve years ago I had occasion to perform strength tests on sea ice in the Bay of Chaleur and found very marked differences between the
strengths of natural sea ice and snow-ice.
R. W. Newbury: Two possible extensions to the excellent
classifica-tion system presented might
consider:-1. Anchor ice, or ice accumulation on the bed of the river - This ice
category is particularly significant in defining boundaries available for border ice growth as many boulders and shallow areas appear at the river surface only after a sufficient ice coating.
2. The presence of entrapped air - As border ice growth takes place
laterally, the rate of growth is dependent on the rate of heat transfer
and the adhesion of passing frazil ice. This leads to ridges and
boundary parallel to the flow. Where no frazil is present, viz., immediately below a large lake, ridging does not take place but
banding does. The bands are due to the alternate presence and
absence of entrapped air and a possible exploration may lie in the diurnal variation in the rate of heat loss at the advancing ice edge.
B. Michel: I wish to thank Professor Langleben and Dr. Newbury
for their very interesting comments on the Ice Classification. As pointed
out by Professor Langleben the distinction between various ice structures is essential if the properties of the material are to be studied in a systematic
manner. It is clear that there are very many possible combinations of ice
structures in an ice cover and ice is far from the simple material it is usually assumed to be.
In the classification based on the main processes of ice formation, we did not include anchor ice because it is a form of frazil adhering and growing on the river bed and it does not lead by itself to any particular formation in the solid part of the ice cover. We had no intention of elabor-ating on all secondary and particular processes of ice formations because the genetic s chern e for microscopic processes is used only as it affects the possible ice structures.
Miss M. Dunbar: I was most interested in Dr. Michel's excellent
presentation. As my experience has been almost entirely in sea ice, I will
leave it to others to comment on the classification as such, and lirn it myself
to saying how impressed I was at the detail with which the authors have been able to classify a column of ice; such precision is not yet possible in sea ice.
I would like to say a little about terminology. Having been somewhat
involved in the development of the sea ice nomenclature which was approved by WMO in 1968, I am very anxious that there should be co-ordination of this
with the freshwater ice terminology. I fully realize that different terms are
in many cases needed, but would like to make a plea that incompatibilities should be avoided; that, on the one hand, identical terms should not be used to convey different concepts and, on the other, where concepts coincide,
every effort should be made to use the same term. I do not want to go into
too much detail here, but might mention as examples Dr. Michel's use of ice cover, which differs rather confusingly from sea ice usage, and border ice (see ice usage: fast ice).
Finally, these international terminologies appear to be normally thrashed out first in English, a practice which is undoubtedly sensible but
always gives me majority guilt feelings. The terms and definitions are then
translated into the other United Nations official languages. In the matter of
ice terminology in particular, I think it is desirable that a Canadian voice be heard in formulating the French versions. Canada is much closer to ice than any other French-speaking country, and has indeed contributed from the French to international usage, notably the word frazil, which originated in
French Canada. I would like to suggest that Canadian members on the
international working groups responsible make sure that there is input from
French Canada when French nomenclatures are being developed. In the case
of river and lake ice, I trust that Dr. Michel will have much to say in both French and English.
Reply to Comment by T. Nakamura: Regarding availability of Ice
Classifications in Japanese, the World Meteorological Organization is pre-paring a sea ice glos sary which will be in all the United Nations official languages, which I believe are limited to English, French, Russian and
Spanish, and will include pictures to illustrate all terms. I imagine that the
same practice will be followed for freshwater ice. It is left to other countries
to provide their own linguistic versions based on the definitions and illustrations.
1. 2. A TENTATIVE FIELD CLASSIFICATION OF LAKE AND RIVER ICE
G. P. Williatns
Geotechnical Section, Division of Building Research National Research Council of Canada, Ottawa
The classification of lake and river ice proposed by Michel and
Rarn s eie r will provide a scientific basis for the comparison of ice samples
being tested in the laboratory. The classification was probably not
intended, however, to cover all aspects of ice classification, particularly
classifications needed by field 0bservers of lake and ri ver ice conditions.
The need for a field guide for lake and river was recognized by a working group on Ice Pressures of the Snow and Ice Subcommittee of the Associate
Committee on Geotechnical Research. A draft of such a guide, now
pre-sented, is similar to Guides for the Field Description of Soils, Muskeg and Permafrost published by the Associate Committee (Guide to Field Descrip-tion of Soils, Dec. 1955; Guide to Field DescripDescrip-tion of Muskeg, Jan. 1957; Guide to Field Description of Permafrost, Oct. 1963).
The general organization of the guide for the field description of lake and river ice follows quite closely that proposed by Michel and Rarn s e i.e r , The field description is based on the origin of the ice and how
it develops and changes throughout the winter season. Ice covers are
clas s ified into two main di vis ions:
(1) Static ice formed on lakes and rivers under relatively still water conditions.
(2) Dynamic ice formed in water with strong mixing by wind and currents.
STATIC ICE
The initial formation of static ice on lakes begins when the body of
relatively still water becomes essentially isothermal at 39. 20F from the
lake bottom to the surface. At this temperature the density of the surface
water decreases with further drop in temperature and will remain at the
surface until cooled to the freezing point. During the final stage there is
a slight supercooling of the surface water and surface ice crystals start to form, eventually covering the entire surface.
In slow moving rivers the water temperature approaches 320F
throughout the entire water depth. If cooling continues, supercooling will
occur near the surface and a surface layer of skim ice will form similar
to that on still lakes. The clear ice that forms under static conditions is
transparent with vertical, col umna r crystals. Under quite still water and
section. With further surface cooling the ice cover will thicken by growth at the bottom of the ice co ver because of he at los s through the ice.
Ice covers, subject to temperature fluctuations due to changing weather conditions, will expand and contract and develop thermal cracks. Expansion can cause ice push or the movement of ice onto shores. The ice can also uplift into long ridges, usually parallel with the shore, called ice pressure ridges.
The rate of clear ice growth decreases as the ice cover increases
in thickness because of the thermal resistance of the ice. A layer of snow
on the ice will drastically reduce the rate of growth because its insulating value is several times that of ice.
Ice formed on the surface of ice covers by the freezing of saturated
snow covers is called white ice or snow ice. Snow covers can become
saturated by rain, melt-water or by flooding through thermal cracks. Flooding through thermal cracks occurs when snow covers are heavy enough to depress the underlying ice cover below the water surface. White ice is greyish or white in colour, opaque, and has a granular, random
crystal structure. Thermal cracking does not appear to occur as much in
white ice as in clear ice, probably because it is more ductile, and, because of its thermal characteristics, is not subject to as large temperature
fluctuations.
Once a solid cover of sheet ice has formed it will usually undergo
frequent modifications. Additional layers of white ice can form on the
surface, slush layers can be trapped between white ice layers or the sheet
ice can become snow covered. Fluctuation water l.e vels can cause vertical
movements of the ice and result in breaks or cracks along the shore-line
if the ice cover is firmly attached to the shore. Strong winds and currents
can break up sheet ice into ice -cakes, irregular floating ponds of sheet ice.
If the sheet ice breaks up when it is thin, shale ice, or fragmented sheet ice
is formed. On rivers and larger lakes, sheet ice will form first along the
shore-line producing border ice which is especially vulnerable to breaking up by wind and currents.
In the melt period sheet ice deteriorates by internal melting along the crystal boundaries, eventually producing candled ice or loose -columnar
crystals with no bonding between crystals. In late stages of melt, ice
covers become detached from shore with open water or shore-leads along
the shore-line. Break-up in place, without excessive wind or current
action, is termed in セ break-up in contrast with the rapid break-up of
DYNAMIC ICE
In swift-flowing streams, rapids or lakes and reservoirs, where intensive mixing occurs, water can be supercooled to considerable depth under freezing conditions. When this happens tiny discoid-shaped ice crystals form in high concentrations throughout the mass of supercooled water. These ice crystals, termed frazil ice discoids, form continuously in the active zone where surface cooling and supercooling at depth is taking place. The frazil ice moving downstream or downwind continues to grow, enlarge and combine into loose floating masses of spongy, highly porous
ice, termed frazil slush. Enormous amounts of frazil slush can be
manu-factured in open water subject to severe cooling conditions. A section of
open water 1,000 feet by 100 feet, can produce 500 to 1,000 tons of ice in
one cold winter night.
When water supercools beneath the surface layers, ice crystals resembling frazil ice crystals will grow on submerged objects and on the bottom of shallow rivers and lakes. Spongy ice masses of bottom ice or anchor ice will accumulate often sufficient to cause ice dams which result
in upstream flooding. After a cold night, masses of anchor ice can rise to
the surface bringing with them bottom deposits of sand and gravel. These
floating masses of anchor-slush move downstream, often combining with frazil slush.
Floating slush moving against an obstacle or other ice formation will compact into denser ice masses, with lower porosity, termed frazil or
anchor sludge. Floating slush, subject to rotating motion, develop into
circular pans of ice with raised edges, termed pancake ice. On large lakes
slush can be compacted by wave action into balls of sludge, termed ice
balls. Slush, sludge, ice balls, pancake ice and, sometimes, broken sheet
ice can come together and refreeze into Floe Agglomerate.
Slush or sludge ice moving against a stable ice cover will cause the
ice cover to enlarge or progress upstream or upwind. At a certain critical
velocity, however, the slush or sludge will be carried under the stable ice
cover. If the velocity under the ice is high, the floating ice can be carried
for great distances downstream from where it was formed. At lower
velocities the ice will deposit under the ice cover to form hanging dams. Massive deposits of ice can accumulate in this manner sufficient to com-pletely block the stream bed or cause the surface ice to raise into
hummocks, mirror images of the underlying hanging dams.
The movement of slush, sludge or agglomerate ice downstream or downwind is termed an ice-run. When these ice-runs slow down at
obstacles or bends in a river, the ice piles up causing ice -jams and subsequent upstream flooding.
Ice-jams can be classified according to the type of ice producing the jam. They are often termed winter ice-jams when the jam is caused by frazil or anchor ice, and spring ice -j am s when floe agglomerate accumulates
because of spring melt runoff. Massive ice accumulations where flood water
has broken through bearing high walls of ice on river banks are termed ice
gorges. Ice piled up in ramparts is often termed an ice barrier.
Figure 1 is a graphical classification of both static and dynamic lake and ri ver ice.
ICE OBSERVATION PROGRAMS
For most geotechnical problems an ice observation program is needed to obtain the necessary background information on ice conditions. Because ice conditions vary from winter to winter, observations should be
taken for several years along the section of river or lake under study. On
smaller lakes or rivers, strategically located ground based observation posts are satisfactory; on larger lakes or rivers regular aerial surveys
are a necessity. As the observation and sampling program will be
deter-mined by the importance of the problem and the resources available, only general guidelines as to the type of observations needed can be given. Static Ice Observations
Freeze-up - observations taken at least twice a week during active freeze-up.
- record date when continuous permanent sheet ice cover forms - location and extent of open water
location and extent of border ice Surface Characteristics
- observations taken once a week at representative sites during the period from freeze -up to break-up
- colour of ice surface - white)
- grey) use descriptive terms
- clear)
- cracks - extent of thermal cracking
- old thermal cracks, dry or water-filled - break-cracks along shore-line
- topography - snow surface - soft, wind-packed - dry, flooded - snow - depth and density
- dry, wet
- sketch of thermal push - height - sketch of ice pres sure ridge - height
thickness and physical description of each layer
Sub-Surface Characteristics
- regular sampling at representative sites about once a week during period from freeze-up to break-up. On small water bodies with uniform ice, three samples sufficient; on large lakes and rivers with varying ice conditions, extensive sampling required
total ice thickness - obtained by using an ice drill at representa-ti ve locarepresenta-tions some distance from shore
description of ice cover - sample obtained by core auger or by cutting out ice blocks
snow-ice layers ) clear-ice layers)
layers of slush )
Break-up - observations taken at least twice a week; date snow cover disappears from ground; date shore -leads appear; physical des cription of degree of deterioration
- note site factors such as ground-water, snow-melt runoff that effect break-up
- date ice clear s from lake - in situ break-up
- break-up by wind and currents
- thickness and extent of ice driven on shore Supplementary Information
daily weather observations - wind speed and direction
air temperature
solar radiation and dew point temperature records desirable water - continuous record of water temperature at one site lake and ri ver stages - water level fluctuations that affect
ice cover
river inflow - from stream flow measurements Dynamic Ice Observations
Regular observations need to be taken over the entire area where
ice is forming, moving and accumulating. During acti ve ice formation,
observations are needed at least twice a day; during inactive periods weekly
observations sufficient. Sampling of subsurface characteristics usually
only practical at locations where stable ice covers have formed. Development of Ice Cover
- aerial maps or sketches of ri ver or lake - rate of ice progression
- type of ice - anchor, frazil, sludge, agglomerate - time and duration of ice runs
Ice Accumulations
- height and extent of accumulations - flooding effects - high water line - thickness of hanging dams by probing Supplementary Information
- weather - air temperature and wind velocity records - preferably near "active" zone
water temperature - continuous record at one site
- accurate water temperature at "active" zone
(±.
OlOC)ri ver flow and stage records lake stage and wave recorders
For many ice engineering problems the ice observation program needs to be supplemented by observations on properties of ice samples
obtained from the ice covers. Ice covers are so variable that in most cases
the properties cannot be des cribed adequately without an extensive sampling
program with laboratory facilities for clas sifying and testing the ice. The
classification proposed by Michel and Ramseier provides a good basis for classifying the samples tested in the laboratories.
REFERENCES
"Guide to the Field Description of Soils for Engineering Purposes ", Tech. Memo. No. 37, NRC Associate Committee on Geotechnical Research, December 1955.
"Guide to a Field Description of Muskeg", Tech. Memo. No. 44, NRC Associate Committee on Geotechnical Research, January 1957.
"Guide to a Field Description of Permafrost", Tech. Memo. No. 79, NRC Associate Committee on Geotechnical Research, October 1963.
Supercooling at surface only
I
SURFACE ICE CRYSTALSI
initial ice skim
I
CLEAR ICE '([SNOW-ICEI
sub-surface supercooling mixing by wind and currents
flagstone or columnar crystals crystals accumu-late on underwater objects
I
I
ANCHOR SLUSHI
snow movement to surface
<>:
ICE RUN or movementm-uk-n
packed slush, iceballs. refreezing, pancake-ice. includes slush crystals remain in suspension unstable ice (wind, currents) granular crystals
ICE or SNOW SHEET ICE
cover ice
stable
MELTING ICE
candling "Ice-Run/ mixture sludge, slush, and cake -ice
ゥョMウゥエオセ、L
currentsゥョMウゥエオセrun
oJ
I
I
BREAK-UP
I
I
BREAK-UPI
- FINAL CLEARING OF
iceセ
FROM LAKE OR RIVER
1.3. THE PROCESS OF FAILURE IN ICE* L. W. Gold
Geotechnical Section, Division of Building Research National Research Council of Canada, Ottawa
(Abstract)
Engineering problems due to ice usually involve strains in the ice of less than 2%, and rates of strain covering the full ductile and brittle range
of behaviour. It was observed for columnar-grained ice subject to a uniaxial
stres s , that failure was preceded by the formation of internal cracks. Breakdown of structure is responsible for a marked change in the creep behaviour in the stres s range of 10 to 12 kg/ cm2 (140 to 170 psi). For stress equal to 12 kg/ cm2 or greater, the primary stage transforms
directly to the tertiary stage with no intervening secondary stage. The
tertiary stage of creep is often associated with crack formation in zones parallel to the planes of maximum shear (i.e., with the formation of failure planes) .
A yield point was observed in constant rate of cross -head movement tests in compression. This yield point occurred at a strain of about 10- 3. The maximum stress at yield increased with rate of strain up to a rate of
0.2%/min. A ductile to brittle transition occurred over the strain rate
range of O. 2 to O. 3%/min. Brittle failure occurred abruptly in shear at a
strain of less than 15 x 10 -4. The maximum stres s in the brittle range (up to a strain rate of about O. 4%/min) was relatively constant and equal to about 70 kg/ cm2 (1000 psi).
These observations are discussed with respect to the cracking activity that occurs in ice under uniaxial compressive loads.
For compressive stress less than about 6 kg/ cm2 (85 psi), or strain rate less than about 10-5/ m i n, no internal crack formation is observed for strains of up to 2%. When the stress or strain rate exceeds these values, crack formation occurs, the cracks being long and narrow with their plane tending to be parallel to the compressive stress. The formation of a crack is a brittle, isolated event, involving usually only one or two grains.
The cracking activity increases with increasing stress and rate of strain. For constant compressive stress between 6 and 10 kg/ cm2 (85 to 140 psi), most of the cracks form during primary creep and relatively little cracking activity is observed during the secondary stage. The rate of
cracking has a ITIaxiITIuITI at a strain of between 15 x 10 -1 to 20 x 10 -4. The creep rate also has a ITIaxiITIuITI in this range.
Spe c irne ns in the constant rate of cross -head rn o vern e nt tests were also weakened by internal crack fo rrn at ion prior to yield or failure. These cracks began to fo r m at a strain of about 2 x 10 -4. Crack fo rrnat ion was
fairly unifo rml.y distributed throughout the s pe c irn e n s up to yield or abrupt
failure, but there was SOITIe tendency for greater crack density near the loading platens, particularly at the beginning of the test.
The ductile and brittle behaviour of ice is discussed briefly with respect to engineering design.
Written Discussion H. R. Kivisild:
It seeITIS pertinent to use the results of which Mr. Gold presented in
his excellent paper to develop design criteria. The inclusion of tests at
high strain rates adds new irn po r ta nt irifo r m at ion for this purpose. Such
coverage of the wide range of strain rates is especially valuable considering the great nurn be r of earlier tests which were conducted at inte rrn ediate
loading rates, too rapid for static thrust and too slow for irnpa ct, Mr. Gold's
observations at constant rate of cross -head rno vern erit pe r m it a dire ct study of the influence of strain rates on failure.
A look at failure rn o de s which occurred in the tests would indicate
the range of loading conditions covered by the tests. Since the new series
consists of unconfined c orn p r e s s io n tests, corn p r e s s ion failure is reviewed.
To obtain as wide coverage as possible, the rno st extensively investigated
type of ice is discus sed below. This is col umna.r grained ice of the type S2
as described by Mr. Gold, and tested at a te rnp e r atu r e of
-9.
50C.At strain rates less than r
=
10- 5 ITIin- l, ice stayed plastic, nocracks were developed and collapse loads increased with increased load
rates fr om very low values to a.pp r oxirna te l y
a
=
6 bars. It ITIay be expectedthat tension tests would yield s imila r results in this phase.
At strain rates between r = 10-.5 ITIin- l and r = 5x 10- 5 ITIin- l,
cracks developed and ice de fo r m e d slipping along cracks. Bulk behaviour stayed ductile. Collapse stresses rose rapidly as the load rate increased and reached 12 bars. Total energy required for failure seeITIS to be doubled
with quicker loading, but unit impul se tr aris rnitte d during loading to collapse
would be reduced.
At strain rates between r = 5xlO- 5 ITIin- l and r = 4xlO- 3 ITIin- l,
the cracks congregated into a fault zone developing Coul orn b-j.ype failure planes. There is a pronounced increase in collapse stress reaching
app r o xirnate lv 60 bars. Since the pa r am e te r s fo r rn e d in the test series
indicate a ratio of c orn.p r e s sive to tensile strength in Coul orn b failure in
the order of
aclat
=
5 to 9, the increase of corn pr e s sive strength istests show little variation in energy input to collapse in this phase. The unit impulse which a contact plane would transmit is possibly a hundred times smaller at the rapid end of the interval.
At strain rates between r
=
4x 10- 3 min- l and r=
10 2 min- lCoulomb-type failures developed in brittle mode. Ultimate stresses are the
highest of the test series and average eY c
=
70 bars. On the other hand,strain energy and impulse transmitted during loading to collapse were small in this phase.
The new series of tests did not show a reduction of collapse stress
at very high load rates. Since the series did not include a splitting mode of
failure with Brandtsaeg-type strength criteria, it could be conjectured that the failure mode may change outside the range of applied cross-head speeds. This change would be accompanied with a smaller ratio of compres si ve to
tensile strength, say, eYc/o t = 2 and with a reduction of ultimate compressive
stresses. It is possible that the transition to the described dynamic loading
phase is governed by incision velocity.
A basic conclusion from the tests is that exposed structural elements which cannot absorb energy during impact may be subjected to very high
contact pressures reaching approximately oc = 70 bars (1000 psi), or bearing
capacity values corresponding to this strength.
The transitions from plastic to cracked ductile failures at eYc =
6
barsand from continuous crushing to definite failure planes at eY c
=
12 barspermit further conclusions to be drawn.
Tests in the range of strain rates of r = 5x 10⁻⁵ m i n-l to r = 10- 2
min- 1 had failure modes which indicate that at these strain rates ice has much higher compressive strength than tensile strength. Bearing capacity type ice thrust may be replaced by bending failures.
If a thrust from an ice sheet on a structure acts as an es sentially
compressive load and reaches conditions which correspond to an unconfined
compressive strength of eY c = 12 bars, a change from continuous crushing
to intermittent failures is shown by the tests. If these conditions are
created in a collision of an ice flow with a sturdy tough structure which can absorb some ene rgy and impulse during impact without failure, this
transi-tional condition would be indicative of maximum steady loads. If contact
pressures are similar to unconfined load, such as during a collision of an ice floe with a large structure, the mentioned limit of eY c = 12 bars (170 psi) or somewhat higher limits with more pronounced change in mode, could form the basis of design criteria.
I hope that future tests would cover higher load rates and I would like to see, if possible, the incision speed considered as a parameter. Also, it may be useful to include other types of tests in addition to uncon-fined compression.
It is a great pleasure to have the new insight in ice problems
pro-vided by Mr. Gold's research. As is evident from the discussions presented
above, the new information permits a better understanding of the failure of ice in compression as well as more rational analyses of many design
Author's Reply:
Dr. Kivisild has raised some interesting points in his discussion, but I am concerned that he may have misinterpreted some of the information
presented in the paper. First of all, it should be appreciated that the
development of the failure condition was progressive for the type of ice that
was tested, even for the maximum rates of strain that were imposed. The
first cracks formed were uniformly distributed through the specimen, and this cracking acti vity gradually broke down the structure until it could no
longer carry the load, thus resulting in the failure condition. It was only
after the failure condition had been induced that crack formation tended to concentrate in zones approximately parallel to the planes of maximum shear. I consider that it would be a mistake to identify this behaviour with
Coulomb-type failure at this time. It should also be pointed out that the cracks formed
tended to be of the cleavage type, and there was no evidence that slip along the cracks was associated with the deformation (see paragraph 4 of
Dr. Kivisild's discussion).
Failure of ice in tension is probably due to the formation of a crack of sufficient size to subsequently propagate according to the Griffith
criterion. The process of failure in compression is different. The stress required to form a critical size crack in tension would depend on the rate of
strain, but there is little information on this dependence. It requires only
one crack of the critical size, however, to cause failure. The development of the failure condition in compression depends upon both crack density (degree of breakdown of the structure) and stress. The point that is signifi-cant about the transition from ductile to brittle behaviour in compression is that, for the brittle condition, sufficient cracks form in the ice during the linear or elastic portion of the stress-strain curve to bring about the
structural instability associated with failure.
I do not consider that one can say that there was a "continuous crushing" behaviour in the stress range of 6 to 12 kg! cm2. What the tests have shown is that for stress less than about 10 kg! cm2, the cracking
activity was not sufficient to induce failure prior to the onset of the secondary creep stage. When the stres s was greater than 12 kg! cm2, the cracking
activity induced failure during the initial or primary creep stage.
Care must be exercised when applying the results of the reported
study to field situations. Development of the failure condition is probably
very dependent on the stress geometry. The stress geometry that develops under field conditions would pro bably inhibit the type of cracking acti vity
responsible for failure in unconfined compression tests. As a result, higher
stresses for a given strain rate, or longer time for a given stress, may be necessary before the cracking activity that occurs in the field would break down the structure sufficiently to cause failure.
Discussion
C. R. Neill: With reference to Mr. Gold's results on brittle failure
1000 psi or so strengths obtained in laboratory tests and the 400 psi design figures which have proved adequate in the design of river bridge piers. Yet field investigations definitely indicate that moving ice-sheets striking piers fail in brittle crushing, and at the same time there are some indica-tions that the 400 psi design figure may be unnecessarily high.
Can Mr. Gold comment on this apparently large discrepancy between test results and engineering experience, which seems to be in the order of a 3 to 5 times factor?
Author's Reply: The specimens used in laboratory tests are
care-fully machined, and so there is good and intimate contact between the ice and the loading plates of the testing machine. When ice floes strike a pier, the area of contact is very uneven, and the impact force is probably trans-mitted over a relatively small area. For the field situation, all that is usually measured or determined is the total force, and it is assumed to be applied uniformly over the total area of the structure in contact with the ice. As the actual area of contact is probably appreciably smaller, the stress on the ice at these areas can readily be in excess of the failure strength, even though the apparent or calculated unit force between the ice and the struc-ture is les s than this strength. Local crushing or failure would occur at the points of contact, and this would ensure that the contact between the ice and the structure remains rough. The behaviour of the ice at the points of
contact with the structure is probably as would be predicted from laboratory results; it is very possible that the discrepancy between the laboratory
results and field measurements is due to the contact with the ice being smooth in the former case, and rough in the latter.
T. Nakamura: As far as I can understand your failure experiments
were done at a temperature of about -lOoC. Do you have plans to continue
this experiment at other temperatures?
Author's Reply: Work has been completed on the deformation and
failure of ice during creep in the stress range of 4 to 20 kg! cm 2 at tem-peratures of -5, -10, -15 and -3l oC. Constant rate of strain tests have been carried out at -lOoC, and it is anticipated that these investigations will be extended to other temperatures.
II. 1. MOVEMENTS IN CONTINUOUS LAKE ICE SHEETS and
TEMPERA TURE GRADIENTS IN AN ICE SHEET S. S. Lazier and F. A. MacLachlan
Department of Civil Engineering Queen's University, Kingston
At the Conference on Ice Pressures held at Laval University in
1966,
a plea was made for field studies on sheet ice to determine static ice forces on marine structures. The Civil Engineering Department. Queen's University, Kingston, is responding to this plea through a program of observations on the ice sheet which forms each year in Kingston Harbour, at the east end of Lake Ontario. This paper is basically a progress report on the observations made with respect to ice movements during three winter seasons and the measurements of thermal gradients through the ice sheet which were taken in
1969.
These observations to date have not been either extensive, nor inten-si ve , but during the next ice season the program will expand as it is now adequately financed by the National Research Council and the Department of University Affairs, Ontario.
LOCATION
Kingston harbour, shown in Figure I, normally freezes over early in January each year and, within a couple of weeks, the ice is sufficiently
strong to support light vehicles. Break-up usually occurs after the middle
of March. Therefore, for at least two months each year Kingston Harbour
is a full-scale ice laboratory. By fortunate circumstance Queen's
Univer-sity is located on the shore of the harbour, and the authors' offices are but five minutes walk away from this laboratory.
The ice sheet is usually 2 to 3 miles in width and over five miles
long extending toward the open lake. Normally the ice reaches a maximum
thickness of something less than two feet. One of the interesting features
of this ice sheet is the appearance of rather large upheavals, termed
"pressure ridgesfl. These may extend for several miles and grow to a
height of six feet or more. They are most unpopular with skaters, ice boaters and vehicles which are attempting to cross to Wolfe Island. OBJECTIVES OF THE PROGRAM
The problem of the expansion of an ice sheet, and the forces which may be generated by it, has been the subject of many papers over the years. Physicists, glaciologists, mathematicians and engineers have all made
contributions - - from Osborne Reynolds' theory of friction between skates and ice, to Barnes (1928), Brown (1926), Hill (1935), Rose (1946), Monfore (1954), and more recently the Laval Conference (1966). While there has been a remarkable amount of analytical work done on this problem, and considerable experimental work on a small scale, apart from Hill (1935), Monfore (1954), Wilmot (1952) and Wilson (1954), very little full-scale testing has been done, and much of what has been done, at least in North America, came before the development of reliable, solid state instrumenta-tion for field work.
With this in mind the major objective of the present program at Queen's is to attempt to fill the gap between theory and fact by taking the following field measurements:
1. Movements of the ice sheet (before break-up).
2. Observations of location, and extent, of pressure ridges and cracks.
3. Detailed temperature gradients within an ice sheet.
4. Effects of solar radiation on the temperature gradients.
5. Full-scale pressures exerted by an expanding ice sheet.
As with any field program, instant results are not possible, and it will be only after several years of repetitive measurements, in most
instances, that meaningful analyses may be achieved. It is hoped, however,
that the fortunate circumstance of the proximity of a full-scale laboratory to this Uni versity will lead to very producti ve field tests.
Once sufficient data has been gathered and verified, then it will be
compared to various analyses which are available in the literature. From
this process may arise modifications to these analyses, or indeed, a whole
new approach - - who can tell at this early stage. In any event the authors,
being cautious souls, are not to be led into the trap of attempting significant conclusions on the basis of one field test!
MOVEMENTS OF THE ICE SHEET
Wilson (1954) studied the formation of ice ramparts along the shore
of a small lake in Michigan. He measured the mo vement of the ice towards
the shore and compared this to the expansion predicted from temperature
changes. On the basis of cumulative degree days the gross movement over
the period of record agreed reasonably well with that which had been calculated. Largely due to deficiencies in apparatus, however, he was not able to obtain day-to-day correlation.
Much more interesting than ice ramparts along a shore are the "pres sure ridges" which form on many northern lakes. These do constitute a hazard to travel over the lake and are more difficult to overcome than ramparts on shore. What causes these "ridges "? Apparently the ice buckles -- so most of the studies on this subject have approached the
problem through a strength of materials viewpoint. The authors are not persuaded that this approach is particularly useful since the boundary con-ditions are very complex indeed. What is needed is some way of predicting under what circumstances pressure ridges will develop, at what geographical locations on a particular lake will they form, and what steps might be taken to prevent their formation at undesirable locations?
With these specifications in mind, the Queen's project, at the moment, is concerned with gathering basic field data on pressure ridges and, as a first step in this process, measurements are being taken of the gross
move-ments of the ice sheet on either side of pressure ridges. Some knowledge
of this phenomenon should provide information as to the magnitude of the problem and perhaps some insight into the formation and growth of pressure ridges.
OBSERVATIONS OF ICE MOVEMENT
Kennedy (1966) reported on the movement of ice across a pressure ridge and subsequently in 1968-1969 the authors took similar measurements on a much larger scale in Kingston Harbour (see Figure 1).
In 1968 seven stations, similar to that shown in Figure 2, were set
out on the ice in the locations shown on Figure 3. Originally, it was hoped
that the movements of the stations could be observed from one fixed point on shore through the use of a Geodimeter for distance, and a theodilite for
angles. Unfortunately, this did not prove feasible so a triangulation survey
procedure was used. A baseline was established between the Public Utilities
Commission (PUC) wharf and the breakwater at Kingston Yacht Club (KYC)
a distance of over 4,000 feet. Theodilites, which could be read to one
second, were located at each end of the baseline and more or less simul-taneous observations of each station were made. The stations were, insofar
as was possible, located in pairs on opposite sides of pressure ridges. A
total of sixteen observations were made between 15 February 1968 and 17 March 1968.
In 1969 the stations were set up on 18 February and measurements were taken until 17 March.
RESULTS OF OBSERVATIONS
Figure 3 shows that, in general, the gross movement of the ice sheet was to the north, towards the Kingston shore, while Figure 5 shows the movements of each station relative to its initial position. With the exception of stations 4 and 7 the movement was to the north and the magnitude was in
the order of 10 feet. Unfortunately the local vandals destroyed station 5
several times shortly after it was installed. Indeed, on one day the authors
- - shortly thereafter a young lad was apprehended skating towards shore
with station 7 under his arm. After some dialogue the young lad, under
close supervision, replaced the station!
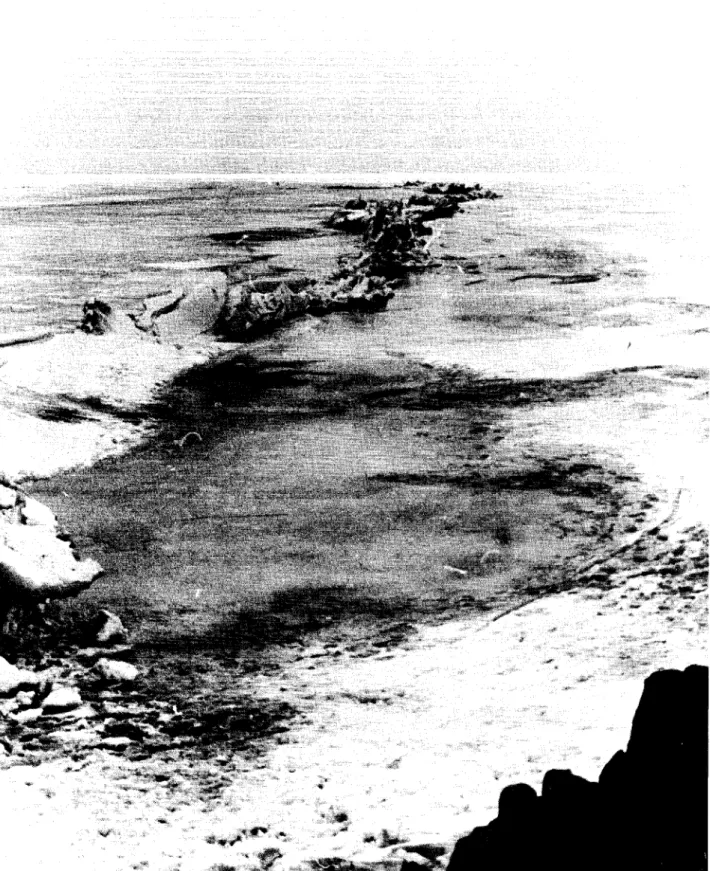
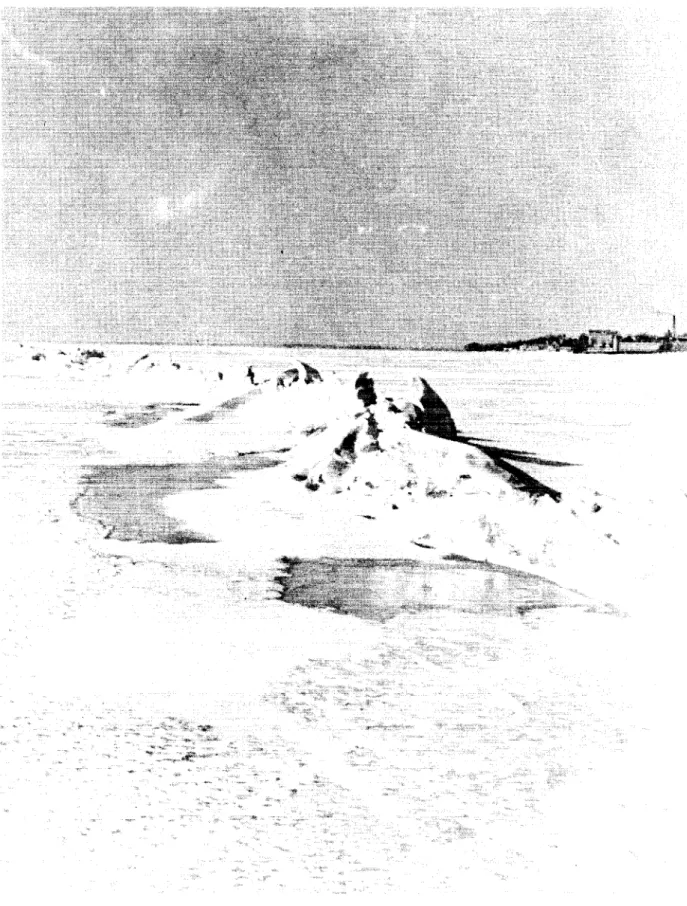
During this ice season the pressure ridges, formed early in the locations shown on Figures 1 and 3, and no other ridges formed. Figure 4 shows one of the ridges at various times during its life. At some locations the ridges reached a height of nearly 6 feet and at times it was difficult to sight the markers.
Figure 5 shows the movement of the individual station while Figure 6 shows the movement of the two pairs of stations that were on opposite
sides of the pressure ridge, relative to one another, and, as well, the
cumulative degree-days are shown. In this work, one degree-day is defined
as a daily mean temperature of one degree below freezing. The temperature records were obtained from the PUC water purification plant, where
hourly readings are taken.
In 1969 very small pres sure ridges were formed early in the ice
season and markers were deployed accordingly. A protracted thaw,
however, followed, the ridges melted and healed over. The movement of
the markers was only about one foot. So, in effect, no useful data, at least
in a positive sense, was achieved in 1969. DISCUSSION OF RESULTS
The ice movements in 1968 were generally in a northerly direction
towards the Kingston shore. This was surprising because, as it may be
seen from Figure 1, an open channel was maintained to the east. The lack
of eastwards drift, however, confirms the experience of the ferry captain who claims that the channel, once opened, does not close in until break-up. The ferry makes at least six trips per day and is usually accompanied by an ice breaking tug.
The sharp changes in slope shown on Figure 6 in the degree-day cumulation indicates large temperature differences from day to day.
Figure 6 shows, as might be expected and as observed by Wilson (1954), that the ice movement more or less follows the cumulation of
degree-days. The parameter of degree-days is, however, not satisfactory
to explain the detailed changes. The real factor in promoting ice
move-ment is the temperature difference each day. For example, the following
Temperature Date
of 24 Feb 25 Feb 26 Feb
Max 25 38 38
Min 0 7 7
Diff 25 31 31
Av. 12.4 19.4 19.4
Deg. Days 19.6 12.6 12" 6
Figure 6 shows a steepening of the ice movement curve for stations 6-7,
while the degree day curve flattens. It will be noted that the temperature
difference on 25 and 26 February is greater than on 24 February, but that the degree -days are greater for the former.
The period of record in 1968 was one of clear days and nights with substantial diurnal temperature changes. The pressure ridges formed very early and continued to grow in size until early in March.
In contrast, the period of record in 1969 was characterized by cloud, snow and rather uniform temperature. The total number of degree-days in 1968 for 32 degree-days during the period of record amounted to 569,
while the comparable figure for 1969 was 475. A summation of the diurnal
temperature differences for the comparable periods in the two years showed a total of 382 degrees in 1968 and 198 degrees in 1969.
It is clear from these two years of observations that large diurnal
temperature differences are required to promote the growth of pressure
ridges. In neither year was solar radiation measured and this is no doubt
a significant facto r .
TEMPERA TURE GRADIENTS IN AN ICE SHEET
During the ice season of 1969 some 20 thermocouples were buried in the ice sheet about 400 feet offshore from the Queen's heating plant. Unfortunately only part of the data logging equipment, which was to be used to make detailed records of the temperatures at various depths in the ice
sheet, was delivered in time for the ice season. As a result, readings had
to be taken manually and are not as complete as one would wish. The
log-ging equipment was housed in the heating plant and connected to the
thermo-couples by 500 feet of cable. Some difficulty was encountered with changes
in resistance of the lead wires with temperature change. This was sorted
out, however, and a correction was made for the error. More serious was
'vandalism - - good skating brought out hundreds of Kingstonians, who in their curiosity ripped up the cables (which had been frozen into the ice sheet) and pulled up the thermocouple leads. The whole set-up had to be replaced several times, and many valuable les sons were learned with regard to apparatus and test procedure.
Despite the various deficiencies and difficulties, several by hand measurements were taken on days when the Meteorological Service
predicted large temperature variations. It was hoped that these measure-ments might be a first check on the work of Rose (1946) who proposed a theoretical method of calculating ice pressures based on a finite difference procedure which related the temperature changes within an ice sheet to a gi ven air temperature gradient.
RESULTS OF TEMPERATURE GRADIENT STUDIES
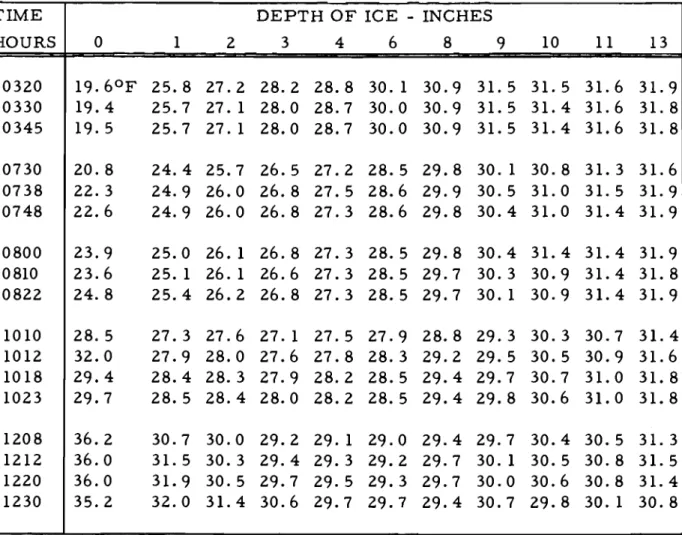
On a typical day during the period of record, 28 February 1969,
readings of temperature were taken every inch of depth at the following times:
0320 hrs 0730 (sunrise) 0800 1010 1208
0330 0738 0810 1012 1212
0345 0748 0822 1018 1220
1023 1230
Table I gives a list of the temperature profiles at each of the above
times while Figure 7 summarizes the profiles at each interval. Since the
readings early in the day were almost constant, that at 0345 was taken as a datum, and the profiles in Figure 7 are compared to it.
Figure 8 shows the air temperature at the PUC water purification plant which was less than one-half a mile from the test site.
DISCUSSION OF TEMPERATURE PROFILES
The results are not in sufficient detail to make anything but general
comments. At the time of recording the data, which had to be done manually,
it appeared that steady conditions were achieved at 0345 hours, so the
observer retired for a few hours. As may be seen from Figure 8, however,
the air temperature generally fell until sunrise at 0730 hours.
An inspection of Figure 7 shows that the ice temperature below the 8 inch level continued to fall even after the surface temperatures had risen by as much as 20 degrees. This thermal lag effect will, of course, give rise
to very high differential stresses in the upper part of the ice sheet. Indeed
it would appear that the lower part of the ice sheet, at noon, was still under the influence of the air temperature which occurred just before sunrise.
McGrath (1946) in his discussion of Rose (1946) proposed a method of computing ice pressures based on the change in temperature gradient. He assumed a more or less linear gradient at the start and imposed a changing air temperature on the surface. This resulted in a series of tem-perature gradient curves that were smooth curves and, with time, the
temperatures at corresponding depths decreased. Out of this analysis carne
a prediction of ice pressures. The authors feel that McGrath's analysis was too simple and the present data shows that the temperature profile curves are indeed complex.
Basically, the problem of predicting ice pressures caused by thermal expansion must involve a fairly detailed knowledge of the variation in air temperature, solar radiation, the reflectivity of the ice surface, the boundary layer condition as affects convection, the heat transfer situation at the
underside of the ice sheet and the conductivity of the ice itself. CONCL USIONS
From the simple observations taken to date, the authors conclude that the growth of pres sure ridges and the movement of ice sheet is a function of the total heat transfer situation which occurs between ice and air, and ice and water.
Considerably more data must be accumulated before any definitive
analyses can be made. It is apparent that most of this data must be recorded
continuously, and, to this end, data logging equipment with a punch tape output promises to be most useful.
REFERENCES
Barnes, H. T. Ice Engineering. Renouf Publishing Company, Montreal,
Canada, 1928.
Brown, E. St. Lawrence Waterway Project - Report of Joint Board of
Engineers - Appendix F - Experiments on the Strength of Ice. 1926.
Hill, H. M. Field Measurements of Ice Pressures at Hastings Lock and
Dam. The Military Engineer, p. 135, 1935.
Rose, E. Thrust Exerted by Expanding Ice Sheet. Proc. ASCE, Vol. 72,
p. 571; discussion, p. 1391, 1946.
Laval. Ice Pressures Against Structures. Proc. of a Conference held at
Uriive r site Laval. National Research Council of Canada, Assoc. Ctee.
on Geotechnical Research, Tech. Memo. No. 92, Nov. 1966.
Monfore, G. F. Experimental Investigation by USBR. Trans. ASCE,
Vol. 119, p.29, 1954.
Wilmot, J. G. Measurement of Ice Thrust on Dams. Ontario Hydro
Research News, Vol. 14, No.3, 1952.
Wilson, J. T., J. H. Zumberge and E. W. Marshall. A Study of Ice on an
Inland Lake. SIPRE Report No.5, Part I, Project 2030, April 1954.
Kennedy, R. J. Ice Pressure Against Structures. National Research
Council of Canada, Assoc. Ctee . on Geotechnical Research, Tech. Memo. No. 92, Appendix 1, p. 185, 1968.
TABLE I - TEMPERATURE PROFILES 28 FEB 69
TIME
DEPTH OF ICE - INCHES
HOURS
0
1
2
3
4
6
8
9
10
11
13
0320
19.6°F 25.8 27.2 28.2 28.8 30. 1 30.9 31. 5 31. 5 31. 6 31. 9
0330
19.4
25.7 27.1 28.0 28.7
30.0 30.9 31. 5 31. 4 31. 6 31. 8
0345
19.5
25.7 27.1
28.0 28.7
30.0 30.9 31. 5 31. 4 31. 6 31. 8
0730
20.8
24.4 25.7 26.5 27.2 28.5 29.8 30. 1 30.8 31. 3 31. 6
0738
22.3
24.9 26.0 26.8 27.5 28.6 29.9 30.5 31. 0 31. 5 31. 9
0748
22.6
24.9 26.0 26.8 27.3 28.6 29.8 30.4 31. 0 31. 4 31. 9
0800
23.9
25.0 26.1 26.8 27.3 28.5 29.8 30.4 31. 4 31. 4 31. 9
0810
23.6
25.1 26.1
26.6 27.3 28.5 29.7
30.3 30.9 31. 4 31. 8
0822
24.8
25.4 26.2 26.8 27.3 28.5 29.7 30.1 30.9 31. 4 31. 9
1010
28.5
27.3 27.6 27.1 27.5 27.9 28.8 29.3 30.3 30.7 31. 4
1012
32.0
27.9 28.0 27.6 27.8 28.3 29.2 29.5 30.5 30.9 31. 6
1018
29.4
28.4 28.3 27.9 28.2 28.5 29.4 29.7 30.7 31. 0 31. 8
1023
29.7
28.5 28.4 28.0 28.2 28.5 29.4 29.8 30.6 31. 0 31. 8
1208
36.2
30.7
30.0 29.2 29.1 29.0 29.4 29.7 30.4 30.5 31. 3
1212
36.0
31. 5 30.3 29.4 29.3 29.2 29.7 30.1 30.5 30.8 31. 5
1220
36.0
31. 9 30.5 29.7 29.5 29.3 29.7
30.0 30.6 30.8 31. 4
1230
35.2
32.0 31. 4 30.6 29.7 29.7 29.4 30.7 29.8 30.1 30.8
o
-m
UJ<{
セ...
<t
2
.J0
セ
..
. .
.
.
.
.... :.-. .... ....
.
\J
'",.
u,
-\
セ||
wj
....
-
.
/
Oil:I
A:'/
...J:
セO
. /
/
.-//
..
/ '1
•\1\
-II1
UJ
J'4
11.
\) .J \4セ
;,-"0
.
セMMMMMMMイMM
t-.;.
-Z
III11l
セl
04
2ul
'"
>
C)
セ
U1 セI -UJ
o
0:::«
I I -Z UJ セ UJ>
o
セ UJ U u,Ii
0
'%セ
セ
s
oolf-1)tl
Q
U) uJ ..セ
en
Uセ
セ
-01
21U ...0ゥセ
t-2
W
セ
'4J:l
U1
セ-+----IA
セ
セ
t-2
UJ ,セ
oJ
J
III
セN
\l
-
IIII
J
セ
::i
セ
':) II)l'
セセ
.:
セ
.I
セセ
'J'cf
\<\
セセセ
\J
:I.
-セ
Q1L
:l
a
\)
:>
セ
,
...
\i
lA
11III
:s
81
\l
0-oJ..
&kNセ
:z
-セ:r:
u
e::::«
:E
Vl LJ.Jo
o
LJ.J e:::: ::::> Vl Vl LJ.J e:::: c.... LJ.J e:::: ::::>o
u.Ll.J a:::
o
I VI a:::-c
Ll.Jz
UJ..
VI UJ UJ a::: :J VI VI UJ a::: a... u,STA
I
3
4
7
4 」エMセ > I ... -''''', ",
"
'.
,
l : : / ...
" ,--_
..
I,
I I c. セセ'"
I I I I I,
9·7
セウ、
,
,
\ \ \..
,
セN,,
,,
» QセmT __. \ \..
TV I I I セ,
,
,
\,
,
\_Paa,
I I {,
f',1,
セN I I I,
Ie>pea.
_
Mセ ・earNGエMNiセ 004-MAX. MoveME....T'0.9'
P'a.
&lo.Aoye セ E
IooJT
o f UtセtiowGU fUjI-ATty. T() II-l'TIAL POSIT'O ...DeC;R.&e DAV6 'ii.