JUVENILE DELINQUENCY IN SWITZERLAND OVER 50 YEARS: ASSESSING TRENDS BEYOND STATISTICS
ABSTRACT. The general public seems to be convinced that juvenile delinquency has massively increased over the last decades. However, this assumption is much less popular among academics and some media where doubts about the reality of this trend are often expressed. In the present paper, trends are followed using conviction statistics over 50 years, police and victimization data since the 1980s, and self-report data collected since 1992. All sources consistently point to a massive increase of offending among juveniles, particularly for violent offences during the 1990s. Given that trends were similar in most European countries, explanations should be sought at the European rather than the national level. The available evidence points to possible effects of increased opportunities for property offences since 1950, and although causality remains hard to prove, effects of increased exposure to extreme media violence since 1985.
KEY WORDS: crime trends, crime victimization surveys, juvenile delinquency, self-reported delinquency, statistics, Switzerland, TV violence, video
Over the last 20 years, scholars in many European countries debated whether or not youth criminality was increasing, as statistics usually sug-gested, or whether the public had become less tolerant toward youthful misbehavior, whereas things had remained objectively more or less the same. With statistics alone, this question is hard to decide. However, sur-veys on victimization and self-reported delinquency have been undertaken in several countries over about two decades now. Switzerland being among the countries where surveys started in the 1980s, trends can be assessed more convincingly than with statistics alone. In this paper, we shall first look at long-term trends, using conviction statistics available since 1954. Over the last 20 years, comparisons can be made with police statistics, victimization surveys and studies on self-reported delinquency. They show a surprisingly convergent picture.
CONVICTIONSTATISTICS
Convictions of minors have been counted in Switzerland since 1954. Be-tween 1954 and 1970, convictions of 14–17-year-old persons doubled per 1,000 of the same age-group. Due to changes in registration practices in 1971, this statistic was dropped from that time,1and resumed in 1988, but
1Swiss conviction statistics are based on registration in the national register of convictions. After 1971, minors were registered only in exceptional cases (Balvig 1988, p. 30).
European Journal on Criminal Policy and Research 10: 111–122, 2004.
C
Figure 1. Convictions per 1,000 minors of the same age (1954–2001). Source: Database of convictions (Federal Office of Statistics).
using a somewhat different approach. In 1999, this second series was aban-doned and replaced from 2000 by a more systematic count which includes all misdemeanors2which were not counted at all before 1970 and only par-tially after 1988. The inclusion of misdemeanors may have affected rates of violent offenders quite considerably, since about half of all convictions of minors for violent offences are for minor assault (a misdemeanor). On the other hand, other changes in the way the published data are presented lower considerably the rates of minors convicted of violent offences. In-deed, the data for the period ending with 1970 is for minors aged 14–17, whereas those for the period 1988 to 2001 are for all minors (7–17).3Since delinquency rates are far higher for older minors, the inclusion of children below 15 means that recent rates are much lower than if only those aged 15–17 were included.
It is difficult to assess the effect of the several changes in counting procedures with precision. Convictions for violent offences have, according to the trends given in Figure 1, increased by approximately a factor of 10. Assuming that 1 in 2 convictions has been for a misdemeanor in recent years (which certainly would be an overstatement), the “net” increase would still be in the range of 500% over the entire period. On the other hand, the inclusion of children aged 7–14 in the recent period has lowered the increase
2Under Swiss law, misdemeanors (contraventions, Uebertretungen) are offences punish-able by jail of up to 3 months, or a fine up to CHF 5,000 (approx. 3,000).
3Under Swiss law, children are liable to criminal punishment (although only educational sanctions are available before 15) from age 7. “Adolescents” are those aged 15–17 (since 1971), whereas the lower age limit before 1971 was 14. See Federal Office of Statistics (2002, pp. 3–7) for the statistical changes.
in convictions for violent offences by at least half, as the lower increase of total convictions using the same age-groups (by about 400%) compared to the trend in overall convictions using only “adolescents” (which increased by factor of 12) illustrates. Taking these two contradictory changes in the statistical counting rules together, it may be fair to conclude that the real increase in the convictions of minors for violent offences may be in the range of a factor of 10 between 1954 and 2001.
Beyond possible effects of counting rules, it should be noted that much of the increase occurred during and not between the three separate time-series. In other words, most of the change in trends cannot have been affected by changing counting rules. Further, the increase in convictions for violent offences started much later than the increase of overall convictions which is made up mostly of property offences.4 This is consistent with observations in other countries where property offences (Von Hofer 1997; Pfeiffer 1998) increased during the 1950s and 1960s, along with the steady increase in stealable consumer goods, whereas violent offences started to increase mostly during the 1990s.
POLICEDATA
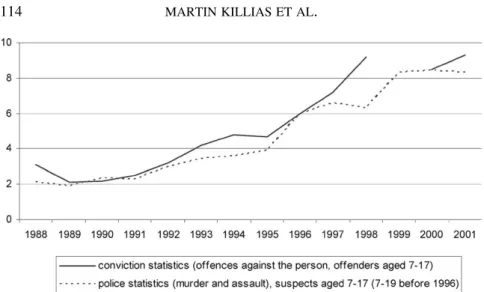
Conviction data give, of course, a very remote picture of “real” trends, although it is difficult to attribute a tenfold increase only to some technical changes in the processing of juveniles. Figure 2 compares trends in police and conviction data for violent offences of minors over the entire period for which both data sources are available (1988–2001).
The two sources count essentially the same offences, namely those in-cluded in the criminal code section on offences against the person.5 The age-brackets, however, were defined somewhat differently in police statis-tics before 1996, since the age of civil majority was set at 20 before that year. Despite these minor discrepancies, the two series match almost per-fectly, suggesting that the increase in convictions of minors has not been produced by changes in the way juveniles are being processed between the police and the court stage. Both series indicate an increase by roughly
4Contrary to adults where about 1 conviction in 2 is related to Road Traffic Act violations, this category makes up only about 10% of convictions of minors. It does not therefore, account for the increase in overall trends.
5Labelled “offences against life and bodily integrity”: Conviction statistics include negli-gent manslaughter and bodily injury (e.g., in connection with road traffic accidents) whereas police statistics count only intentional offences. The difference should not produce major distortions since road accidents involving minor offenders are rare, the minimum age for a driver’s licence being set at 18 as well. Both statistics do not include under “violent offences”, robbery and other violent property offences.
Figure 2. Convictions of minors aged 7–17 for violent offences per 10,000 persons of the same age, and minors known to the police as suspects of violent offences aged 7–19 (before 1996) and 7–17 (1996 and thereafter), per 10,000 persons of the same age (1988–2001).
400% since 1990, despite minor temporary changes in trends (Federal Of-fice of Statistics 2003). Of course, this does not rule out the possibility that police and conviction data may have increased because reporting to and recording by the police may have changed (Qu´eloz and B¨utikofer-Repond 2002). Whereas it is hard to document any changes in the way reported offences have been recorded by the police, changes in reporting to the po-lice are easier to assess thanks to victimization surveys. We shall look at these sources in a later paragraph, and assess first trends in self-reported delinquency.
TRENDS INSELF-REPORTEDDELINQUENCY
As part of the first international self-reported delinquency study (ISRD-1), a national sample of 970 juveniles aged 14–20 has been interviewed on self-reported delinquency in 1992. Since that time, no other national study of this kind was conducted, but studies using similar questionnaires have been realized recently among students in the cantons of Zurich (1998, 9th grade, Eisner et al. 2000), Zug (grades 7–9, 2000, Willi and Hornung 2002) and Vaud (Lake Geneva districts, grades 8 and 9, 2003; Lucia et al. 2004). The samples in the three cantons were 3121 in Zurich, 1107 in Zug and 2’502 in Vaud. Using the methodology developed by the Criminological Research Institute of Lower Saxony at Hanover (Wetzels et al. 2000), the recent surveys all took place in the classroom, whereas the 1992 interviews were conducted face to face.
TABLE I
Prevalence rate of self-reported offending over the last 12 months among boys and girls aged 14–16.a
Deviant/delinquent behavior Switzerland Zurich Zug Vaud
1992 1998 2000 2003
Skipping school 13.4 – – 26.2
Not returning home overnight 1.7 – – 6.5
Driving without a license 31.5 – – 45.9
Shoplifting (value stolen>50 CHF) 16.1 36.6 23.5 9.8 Shoplifting (value stolen<50 CHF) – – 38
Theft of a vehicle 1.5 – 9.6 4.6
Theft of an objet on a vehicle 4.4 – – 7.6
Breaking into a car 1.2 1.1 1.5
Bodily injury by beating up 1.7 14.5 – 11.3
Threat with a weapon (dangerous object) – 2.0 – 3.3
Vandalism 25.2 16.0 14.4 16.8
Theft of personal item 0.9 – – 18.4
Blackmail/extortion – 0.8 – 2.0
Harassment of a person in the streets – 8.3 5.1 6.1
Robbery/mugging 0.0 2.4 1.4 2.9
Theft at school 20.5 26.0 15.4 31.0
Theft at home 10.5 19.7 17.7 19.6
Riding on public transport without a ticket 40.9 63.0 48.3 69.4
Sale of cannabis 0.5 13.0 7.0 8.5
Sale of hard drugs 0.0 – – 1.8
Arson – – – 3.8
Spraying graffitis 5.1 11.5 – 14.2
aAccording to the national survey of 1992 and the recent studies in Zurich (1998), Zug (2000, juveniles aged 13–16) and Vaud (2003).
Sources: Eisner et al. 2000, unpublished data; Willi and Hornung 2002; unpublished data from own data bases (Swiss SRD of 1992, SRD in Vaud); Killias et al. 2004.
Table I gives an account of the main trends observed since 1992. In order to make the data as comparable as possible, the 1992 rates are for juveniles aged 14–16 only.
By comparing the rates for 1992 with those observed in the recent sur-veys, the increase is substantial (i.e., over 100% for 10 among 16 de-viant/delinquent behaviors compared) and consistent (15 out of 16 rates increased). This makes it difficult to attribute the increase simply to changes in the methodology, and especially to changed definitions of SRD items. No doubt, such changes exist and may have affected certain rates, such as the lower rates of vandalism in the recent surveys. The 1992 question on
vandalism was subdivided into 14 items, asking specifically about destroy-ing/damaging any window, car, bicycle, trees, flowers, etc., whereas in the recent surveys, all these cases were collapsed into one general item (“did you destroy/damage windows, telephone boxes, street lamps, benches, road signs or something else?”). A contrary example is the 1992 question on bodily injury which specified that only events should be indicated where the injured party needed some sort of medical attention, whereas the recent version asked about injuring any other person by beating him/her up. On the other hand, the increase is roughly the same even where no change in the questionnaire can be blamed for, as in the case of shoplifting, all other categories of theft, robbery and sale of hard and soft drugs. Experi-ments comparing different ways of administering self-report questionnaires among juveniles (Oberwittler et al. 2001) never have shown massive dif-ferences. It is, therefore, most unlikely that the change from face-to-face interviews (in 1992) to written questionnaires (in the classroom, in the later surveys) could have produced such a massive increase on such a broad range of offences and deviant behaviors. Neither can the geographic scope of the surveys compared explain the differences. Although the recent data are limited to several regions, whereas in 1992, data were collected at the national level, the increase is virtually the same in the more urban region of Zurich as in wealthy, suburban and rural areas like Zug and Vaud, suggesting that the difference with 1992 cannot be explained away by an urbanization factor. In 1992, rates of offending were very similar across language regions (Killias et al. 1994, p. 195). Thus, there is no reason to believe that trends might have been significantly different in a new national self-reported delinquency study.
TRENDS INVICTIMIZATION OFYOUNGPEOPLE
Switzerland is among the few European countries with national victimiza-tion surveys starting in 1984.6Although low frequencies do not allow the assessment of trends in reporting to the police, especially for offences com-mitted by juveniles, general reporting rates remained astonishingly stable for violent offences over the period at stake. In Switzerland, between 30 and 32% of assaults and threats were reported to the police in 1987 and 2000, and 26% in 1996/1998 (Killias 2002, p. 80). At the European level, trends are even more stable, with between 35 and 36% of assaults/threats being reported to the police in the four sweeps of the international crime victimization surveys conducted since 1989 (van Kesteren et al. 2000). In sum, the idea that increasing violent crime trends mostly reflect changes
TABLE II
Violent victimization among men aged 16–19.a 1984/1987 1998/2000 (Lifetime) (5 years, weighted)
% n/N % n/N
Robbery 0.9 3/348 10.7 19/177
Assault and threats 6.3 22/348 25.4 45/176 Total violent crime 7.2 25/348 33.3 59/177 aAccording to the national crime victimization surveys of 1984/87 and 1998/2000.
Sources: Unpublished data from Swiss Crime Surveys 1984/87 and 1998/2000.
in reporting behavior is not supported by empirical data (Wittebrood and Junger 2001).
Crime surveys allow also the assessment of trends in victimization among special age groups. Table II gives rates of victimization among male respondents aged 16–19 in 1998/2000 compared to 1984/1987.7
Given the small frequencies of robbery, the increase is significant (P < .05) only for robbery, assault and threats taken together. Overall, vi-olent victimizations increased more than 400% during the period at stake.8 Interestingly, it is much stronger for young men than for females and other age-brackets, suggesting that much of the increase in violent crime has been directed at other young men. This and the generally known high correlation between victimization and offending (for Dutch data, Wittebrood and van Wilsem 2000; for Swiss data, Killias 2002, p. 307) support the idea that violent offences may indeed have increased among juveniles.
Further evidence on this question comes from victimization data col-lected in 1992 as well as in the recent surveys on self-reported delinquency conducted in the cantons of Zurich, Zug and Vaud. They allow to assess trends in offences experienced by juvenile victims aged 14–16 years.
The results given in Table III show a consistent and substantial increase in all three regions, compared with the national rates in 1992. In the case
7The first national crime survey (N= 6500) was conducted separately in the two major language areas (1984 in French-speaking Switzerland, 1987 in the remaining regions). The two surveys of 1998 and 2000 were lumped together to increase the number of valid cases (N = 7200).
8It should be noted that in 1984/87, the rates given here are for the entire life-time, whereas in 1998/2000 only offences experienced over the past 5 years were included. Among persons below 20, the difference between the two time-frames should not affect rates too much, however.
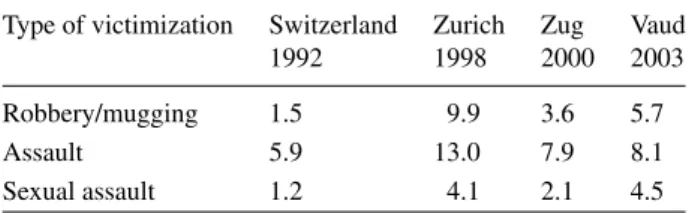
TABLE III
Trends in victimization (percent victimized) among boys and girls aged 14–16 years.a
Type of victimization Switzerland Zurich Zug Vaud
1992 1998 2000 2003
Robbery/mugging 1.5 9.9 3.6 5.7
Assault 5.9 13.0 7.9 8.1
Sexual assault 1.2 4.1 2.1 4.5
aIn 1992 (national level, 5-year rates) and 3 regions: Zurich, 30 months; Zug, 3 years, aged 13–16; Vaud, 5 years, 2003. Sources: Eisner et al. 2000, p. 41; Willi and Hornung 2002, p. 28; own data bases (Swiss SRD of 1992, SRD in Vaud).
of Zurich, the increase is even more impressive given that the rates are for 30 months only, whereas 1992 rates included 5 years. Thus, the trends in victimization of teenagers are very similar to what has been seen in connection with self-reported offending (Table I) and victimization of young men aged 16–19 (Table II). Since offending and victimization are highly interrelated, the increase in juvenile victimization strongly suggests a parallel trend in offending.
TRENDS INOTHERCOUNTRIES
Von Hofer (1997) has studied trends in conviction data in Scandinavian countries. The trends are generally very similar to those presented here, particularly for Sweden where long-term data are available from the 1920s. They show a strong increase of property offences between 1950 and 1980, and consistent with our series, a dramatic increase in convictions for violent offences since the late 1980s. Using police data from 10 European coun-tries and the USA, Pfeiffer (1998) has reached very similar conclusions. Trends in national SRD data are available for England and Wales where a substantial increase in violent offences has been observed in 1998–1999 (over 1992–1993, Flood-Page et al. 2000), in the Netherlands (where vi-olent offences increased between 1988 and 1996, but not ever since, see Kruissink and Essers 2001) and Sweden (Ring 2003) where no clear trend appears in annual school-based surveys. Regional trend data are available from Germany, showing some moderate increase (roughly 30%) of violent offences in Saxony and Northern Rhineland and Westphalia (Mansel and Hurrelmann 1998) as well as in Nuremberg/Erlangen (L¨osel et al. 1997).
In general, increases in police statistics are stronger than in SRD surveys. This has often been interpreted in the sense that police sources “exagger-ate” crime trends (Kester and Junger-Tas 1994; Junger-Tas 1996), but could also be due to different trends in prevalence and incidence of offending.
Indeed, surveys in general are better at measuring prevalence rates, i.e., the percent of respondents “concerned” by any kind of problem or experience, whereas statistics may be superior in measuring changing frequencies of offending (incidence rates). There is good reason to believe that incidence rates may have increased more than prevalence rates over the last decade in Germany (L¨osel et al. 1997), as well as in Switzerland (Dilitz and Rindlis-bacher 2004), for example as a consequence of the increasing numbers of juveniles involved in gangs (Klein et al. 2001; Haymoz 2004). Given the high prevalence of certain more common offences, there are also some kinds of “ceiling effects” at work which naturally will make dramatic fur-ther increases unlikely or simply impossible. In conclusion, fur-there is good reason why several sources of information on crime will generally provide identical directions of trends, although the size of changes may differ.
SOMESPECULATION ABOUTCAUSES
As a general pattern, we may say that property offences have increased rapidly between 1950 and 1980, but have somewhat leveled off after that time or even decreased in the recent past. This trend is easy to explain because “stealable” consumer goods became widely available during the same period, but have lost some of their value on the second-hand market and, as a result, also on black (fence) markets. Trends in drug offences can be similarly explained by the increasing availability of drugs through-out Europe over the last three decades. Thus, rthrough-outine-activities (Felson 1998) offer a much more parsimonious explanation than theories based on economic deprivation (which differed considerably across Europe) or increasing deficiencies in the socialization of children, such as higher di-vorce rates. Although often quoted as a major cause of juvenile delinquency, the relation of divorce to delinquency is modest at best, as a comparison of British and Swiss as well as ISRD-1 data reveal (Haas et al. 2004; Junger-Tas et al. 2003).
More difficult to explain is the late increase in violent offences. Since the trend is, once more, common to most European countries, it will be necessary to find some common (“European”) explanation. Although a strong correlation between regular consumption of extremely violent media scenes including computer games and violent offending has been observed in many studies (Haas 2001; Lamnek 1995; Browne and Pennell 1998), the causal direction cannot be determined given the impossibility (on ethical grounds) to test, through a controlled experiment, the effects of exposing children to such messages over longer periods of time (Killias 2002, p. 253). In the present context, however, it is striking that violent behavior among juveniles seems to have increased everywhere about from the time when video and computer equipment became common in private households.
Contrary to violent scenes on TV or in cinemas, these new media make efficient control of what kind of scenes children are watching extremely difficult to parents. Although not a conclusive “proof” of the effects of violent scenes on children’s behavior, the common trend in violent crime should stimulate a new look at this issue and provoke steps at making our media environment less “unhealthy,” as Professor Pfeiffer has suggested during his office of Minister of Justice of Lower Saxony (Pfeiffer 2003).
CONCLUDINGREMARKS
Any data one might think of to document trends over time can and will be contested. In the present case, police and, even more so, conviction data are open to many criticisms. The same is true for the self-report and crime victimization data presented here. The several surveys obviously differed in scope and methodology, and this may have affected the rates, to some extent. However, it is extremely unlikely, whatever the methodological shortcomings, that all four indicators show the same massive increase if juvenile delinquency had remained stable, as many scholars continue to claim. Rather than any indicator considered individually, it is the sum of converging findings and the size of the trends that make stability extremely unlikely in the present case.
Perhaps, the stability hypothesis survives despite many challenging data because it is deeply rooted in Western European thinking. In all societies we know of, delinquency and deviant behavior have predominantly been a matter of young men. Even ancient Greek writers such as Socrates have deplored the moral decay of youth, and countless statements of this kind can be found in the literature across history. However, the “eternal” corre-lation between age, gender and crime is easily misunderstood in the sense that nothing will ever change regarding juvenile delinquency. If there is no crime-free society in the world, variations in the nature and the vol-ume of crime are not ruled out across space and over time. In the same line, a constant age and gender distribution of deviant behavior does not rule out variations across space and over time regarding the average age of onset, the peak age, the duration of delinquent careers and, most impor-tant of all, the volume of juvenile delinquency which is determined by the proportion of young people who engage in offending and their “produc-tivity” (i.e., their lambda, or individual incidence rates). Documenting and explaining any such changes over time and across space is an important research task. There is no reason why popular claims of eternal “stability” (“nothing will ever change in this world”) should divert our attention from these real challenges. Ironically, theories of “stability” seem to become particularly popular in times of rapid change, best illustrated by the the-ory of homeostatic stability of imprisonment rates which dominated the
debate at a time when incarceration rates exploded in many countries to reach unprecedented levels. In the domain of juvenile delinquency, it may be time to look at change instead of stability, and to search for adequate explanations of increasing as well as decreasing trends (Snyder 2004).
REFERENCES
Balvig, F., The Snow-White Image: The Hidden Reality of Crime in Switzerland. Oslo/Oxford: Norwegian University Press, 1988.
Browne, K. and A. Pennell, The Effects of Video Violence on Young Offenders, p. 65. London: Home Office Research Findings, 1998.
Dilitz, C. and A. Rindlisbacher. L’ ´Evolution du degr´e de grant´e et de la fr´equence des infractions commises par des mineurs au cours des dix derri`eres ann´ees en Suisse (1992– 2003), M. A. Dissertation. ´Ecole des Sciences Criminelles, University of Lausanne, Switzerland, 2004.
Eisner, M., P. Manzoni and D. Ribeaud, Opfererfahrungen und selbst berichtete Gewalt bei Sch¨ulerinnen und Sch¨ulern im Kanton Z¨urich. Aarau: Sauerl¨ander, 2000.
Federal Office of Statistics, Statistik der Jugendstrafurteile 1988–2001. Neuchˆatel: OFS, 2002.
Federal Office of Statistics, D´elinquance des mineurs – l’essentiel en bref. Retrieved from www.statistik.admin.ch/stat ch/ber19/jusus/jusus f 00.htm on 24 October 2003. Felson, M. Crime and Everyday Life: Insights and Implications for Society, 2nd ed.
Thousand Oaks, California: Pine Forge Press, 1998.
Flood-Page, C., S. Campbell, V. Harrington and J. Miller, Youth Crime: Findings from the 1998/99 Youth Lifestyles Survey, p. 209. London: Home Office Research Study, 2000. Haas, H. Agressions et victimisations. Aarau: Sauerl¨ander, 2001.
Haas, H., D.P. Farrington, M. Killias and G. Sattar. The impact of different family config-urations on delinquency. British Journal of Criminology, 44 (4), pp. 520–532, 2004. Haymoz, S. Gangs face `a la d´elinquance juv´enile, M. A. Dissertation. ´Ecole des Sciences
Criminelles, University of Lausanne, Switzerland, 2004.
Von Hofer, H., Nordic Crime Statistics 1950–1995. Stockholm: Department of Criminology, University of Stockholm, 1997.
Junger-Tas, J., Youth and violence in Europe. Studies on Crime and Crime Prevention 5(1), pp. 31–58, 1996.
Junger-Tas, J., I.H. Marshall and D. Ribeaud, Delinquency in an International Perspective: The International Self-Reported Delinquency Study. Monsey, New York: Criminal Justice Press/The Hague: Kugler, 2003.
Kester, J. G. C. and J. Junger-Tas, Criminaliteit en strafrechtelijke reactie – ontwikkelingen en samenhangen. Arnhem: Gouda Quint, 1994.
van Kesteren, J., P. Mayhew and P. Nieuwbeerta, Criminal Victimization in Seventeen In-dustrialised Countries. Key Findings from the 2000 International Crime Victims Survey. The Hague: WODC/NSCRP, 2000.
Killias, M. Grundriss der Kriminologie – eine europ¨aische Perspektive. Berne: St¨ampfli, 2002.
Killias, M., P. Lamon and M.F. Aebi, Crime and punishment in Switzerland. In: D. P. Farrington, P. A. Langan and M. Tonry (Eds.), Cross-National Studies in Crime and Justice, pp. 239–278. Washington, DC: Bureau of Justice Statistics, 2004.
Killias, M., P. Lamon and M.F. Aebi (in press). Crime trends in Switzerland. Crime and Justice: A Review of Research.
Killias, M., S. Lucia and P. Villettaz, Les jeunes, les transgressions et l’ins´ecurit´e: victimes et auteurs: Une enquˆete aupr`es de jeunes de 14 `a 16 ans fr´equentant les ´ecoles de trois districts vaudois. Crimiscope, 24, Universit´e de Lausanne (ESC), 2004.
Killias, M., P. Villettaz and J. Rabasa, Self-reported juvenile delinquency in Switzerland. In: J. Junger-Tas, G. J. Terlouw and M. Klein (Eds.), Delinquent Behavior among Young People in the Western World, pp. 186–211. Amsterdam: Kugler, 1994.
Klein, M., H.-J. Kerner, C.L. Maxson and E.G.M. Weitekamp, The Eurogang Paradox: Street Gangs and Youth Groups in the U.S and Europe. Dordrecht: Kluwer Academic Publishers, 2001.
Kruissink, M. and A.A.M. Essers, Ontwikkeling van de jeugdcriminaliteit: periode 1980– 1999. The Hague: WODC, 2001.
Lamnek, S., Gewalt in Massenmedien und Gewalt von Sch¨ulern. In: S. Lamnek (Ed.), Jugend und Gewalt, pp. 225–256. Opladen: Leske & Budrich, 1995.
L¨osel, F., T. Bliesener and M. Averbeck, Erlebens- und Verhaltensprobleme von T¨atern und Opfern. In: H. G. Holtappels, W. Heitmeyer, W. Melzer and K.J. Tillmann (Eds.), Forschung ¨uber Gewalt an Schulen. Erscheinungsformen und Ursachen, Konzepte und Pr¨avention, pp.137–153, Weinheim: Juventa, 1997.
Lucia, S., M. Killias, and P. Villettaz, Les jeunes, les transgressions et l’ins´ecurit´e: victimes et auteurs. Crimiscope, 24, Lausanne: ESC-UNIL, 2004.
Mansel, J. and K. Hurrelmann, Aggressives und delinquentes Verhalten Jugendlicher im Zeitvergleich. Befunde der “Dunkelfeldforschung” aus den Jahren 1988, 1990 und 1996. K¨olner Zeitschrift f¨ur Soziologie und Sozial psychologie, 50 (1), pp. 78–109, 1998. Oberwittler, D., T. Blank, T. K¨ollisch and T. Naplava, Soziale Lebenslagen und Delinquenz
von Jugendlichen: Ergebnisse der MPI-Sch¨ulerbefragung 1999 in Freiburg und K¨oln. Freiburg i. Br.: MPI, 2001.
Pfeiffer, C., Juvenile crime and violence in Europe. Crime and Justice, 23, pp. 255–328, 1998.
Pfeiffer, C., Medienverwahrlosung als Ursache von Schulversagen und Jugenddelinquenz? Hanover: Kriminologisches Institut Niedersachsen, 2003.
Qu´eloz, N. and F. B¨utikofer-Repond, Evolution de la justice des mineurs en Suisse. D´eviance et Soci´et´e, 26(3), pp. 315–328, 2002.
Ring, J., Theft, Drugs and Violence among Ninth Grade Youth. Findings from Four Self-Report Surveys. Stockholm: The National Council for Crime Prevention, 2003. Snyder, H. N., Juvenile Arrests 2002. Washington, DC: US Department of Justice (Juvenile
Justice Bulletin), 2004.
Wetzels, P., D. Enzmann, E. Mecklenburg and C. Pfeiffer, Jugend und Gewalt. Eine repr¨asentative Dunkelfeldanalyse in M¨unchen und acht anderen deutschen St¨adten. Baden-Baden: Nomos, 2000.
Willi, M. and R. Hornung, Jugend und Gewalt. Ergebnisse einer Befragung von Sch¨ulerinnen und Sch¨ulern im Kanton Zug, Bern: Lang, 2002.
Wittebrood, K. and M. Junger, Trends in violent crime: A comparison between police statistics and victimization surveys. Social Indicators Research, 59, pp. 153–173, 2001. Wittebrood, K. and J. van Wilsem, Jongeren en geweld: de relatie tussen slachtofferschap,
daderschap en leefstijl. Sociale wetenschappen, 43(3), pp. 59–71, 2000.
University of Lausanne
Ecole des Sciences Criminelles
Institut de Criminologie et de Droit P´enal 1015 Lausanne, Switzerland