SPECIAL ISSUE - VINE
Evaluation of energy efficiency program in Geneva
Evaluation methodology and experience feedback for two subprograms
using bottom-up approach
Daniel Cabrera&Theodora Seal&
Jean-Luc Bertholet&Bernard Lachal&
Cédric Jeanneret
Received: 1 October 2010 / Accepted: 3 January 2011 / Published online: 22 January 2011 # Springer Science+Business Media B.V. 2011
Abstract After a brief presentation of the program éco21 and the framework of its monitoring and evaluation, this paper addresses the evaluation meth-odologies pertaining to two of the ten subprograms constituting éco21: Low Income Household (éco-sociale) and Building Communal Areas (communs d’immeubles). For these two subprograms, different options of enhanced engineering estimations—that will be used with a sample of projects—will enable to refine simple engineering estimations. (The terminol-ogy is inspired from the Directive 2006/32/EC) The aim is to drop the enhanced engineering methods later in favor of the “improved” simple engineering estimations that are more efficient in time and cost. Billing analysis will be used systematically to double check the estimates and to evaluate the lifetime of the actions. First evaluation experiences: the results of the very first evaluation experiences for the two subpro-grams (éco-sociale and communs d’immeubles) are presented. First feedback to program managers: the first pilot project of éco-sociale showed that the
electrical power of the lights bulbs, which were replaced with more efficient ones, has an average value that is lower than the one expected before the implementation of the pilot project. However, for Building Communal Areas, the results from a sample of projects implemented during 2008 and 2009 show that the actual savings per project are higher than the expected savings.
Keywords Evaluation methodology . Monitoring and evaluation . Bottom-up approach . Energy efficiency . Energy conservation . Enhanced engineering estimations . Simple engineering estimations . Experience feedback . Ex-ante estimations . Ex-post estimations
Introduction
Description1 of the program éco21 éco21 is an energy efficiency program for the electricity sector in Geneva, Switzerland. The program was launched by the local utility SIG2 and is part of the energy reduction plan of the canton of Geneva (ScaneE). The population of Geneva is ~460,000 (OCSTAT 2008) and the yearly electricity consumption ~2,850 GWh/
1Description about the program eco21 can be found atwww.
eco21.ch
2
SIG (Services Industriels de Genève) is a public owned local utility that provides electricity, natural gas, water and sewage to the canton of Geneva (www.sig-ge.ch).
D. Cabrera (*)
:
T. Seal:
J.-L. Bertholet:
B. Lachal Institute for Environmental Sciences, University of Geneva, 7 route de Drize,1227 Carouge, Switzerland e-mail: [email protected] C. Jeanneret
éco21 Program, Services Industriels de Genève, Ch. Du Château-Bloch 2,
year (SIG2008), CERN3excepted. The program was launched in 2007 with a budget of 21 million CHF (approximately 15 million EUR).4 The activities of the program concerned lighting systems of common areas in residential buildings and energy efficiency campaigns mainly targeting small customers. In the middle of 2009, the program was redesigned and expanded to all of the electricity users in Geneva. The total budget allocated to the program is now 57 million CHF (approximately 40 million EUR) and the objec-tive5 of electricity reduction is 150 GWh/year to be reached by 2013. The new program is based on an ex-ante estimation made by a private consultant (Le Strat 2009) and benefited from some of the European experience. This helped to match a realistic budget to the proposed goal of 150 GWh/year electricity savings by 2013. The program is divided into 10 subprograms that target different sectors. More information about the program can be found on the web pagewww.eco21.ch. Program evaluation At the very beginning of the new program (2009), the University of Geneva was requested to develop the evaluation methodology for the program and perform the corresponding monitor-ing and evaluation, usmonitor-ing cost effective measurement and verification methodologies. The development of the evaluation methodologies was done at the imple-mentation stage for some of the subprograms and at the conception stage for most of the others. The general methodology for the evaluation of each subprogram is based on bottom-up approaches; it will be supplemented, if necessary, by a top–down approach. The evaluation includes normalization, aggregation, and correction of the collected data. The adopted evaluation methodolo-gies are mainly based on the work already done in Europe.6 IPMVP has also inspired the formulation of
our methodologies (EVO2009). The evaluation of each subprogram is done on a yearly basis and includes a comparison of the electric savings obtained during the year with those defined by the intermediate objectives of each subprogram; this process should allow the program managers to make regular adjustments accord-ing to the results obtained. An evaluation of the entire program will be done in 2014.
Subprogram evaluation Each subprogram has its own methodology and their evaluation is made indepen-dently. The following sections describe the general methodology that is to be used to evaluate the subprograms Low Income Household (éco-sociale) and the Building Communal Areas (communs d ’imme-ubles). These two programs already have some experience feedback and the proposed methodologies are very similar. The methodological description is followed by examples of the very first measurements and of the type of analysis performed.
Proposed evaluation methodology for the estimation of gross savings
Three types of data collection and their respective methodologies of saving estimations are proposed: simple engineering estimates (method 1) based on the information collected on the replaced and installed devices during the implementation of a given project; enhanced engineering estimates (method 2) based on measurement of the energy consumption and/or hours of operation, and finally the analysis of the electric bills (method 3) based on yearly billing readings. Method 1 is an ex-ante estimation, while method 2 and 3 are ex-post estimations. The results obtained using method 2 for a representative number of projects will allow us to improve method 1 (for example with a better determination of yearly operat-ing hours for light bulbs in households). It will then be sufficient, in the future, to only use methods 1 and 3 that are more cost effective than method 2. Method 1—simple engineering estimations
This method is based on the information collected during the implementation of the project (i.e., the electrical power of lighting devices that are removed and installed) and an estimation of the yearly
3
CERN is the European Center for Nuclear Research situated in the suburbs of Geneva on the Franco–Swiss border.
4
At present exchange rate: 1 CHF=0.7 EUR (May 2010).
5
The objective of the program only concerns electricity savings. Other objectives, like demand side management or carbon dioxide reductions are not considered at present time.
6See the publications of the program “Intelligent Energy for
Europe” (EIE) and those of the “Active Implementation of the proposed Directive on Energy Efficiency” (AID-EE), http:// www.aid-ee.org/documents.htmand also the EMEEES project,
http://www.evaluate-energy-savings.eu/emeees/en/home/index. php (c.f. Broc et al. 2007, 2009; Bowie and Malvik 2005; Ecofys2006,2007; Eichhammer et al.2008; Harmelink et al.
2007; Nilsson et al. 2008; Official Journal of the European Union2006; SAVE program2002).
operating hours or the annual energy consumption of a given device (yearly consumption of refrigerators based on year and volume for the removed ones and on the energy label for the new ones).
In the case of the Low Income Household subprogram, the data is collected by the energy ambassadors (people specifically recruited and trained to visit the households); and in the case of the Building Communal Areas subprogram, the data is collected by the electricians who are implementing the projects.
The advantage of this method is that it is very simple and the savings can be estimated before or immediately after the implementation of the project. However, at present, the estimation of mean operating hours is fairly imprecise, in particular for the Common Areas of Buildings subprogram. Method 2 below will allow us to reduce this imprecision. Method 2—enhanced engineering estimations This method is based on three types of measurement (2a, 2b, and 2c) performed during two or three time intervals (see below) over a significant sample. The gross annual energy savings are calculated by subtracting the energy consumption after implemen-tation (second and/or third time interval) from the energy consumption during the baseline period (first time interval). The purpose of using method 2 is to get accurate energy savings estimations shortly after the implementation of the project and to gather data that will allow to improve the accuracy of method 1 with better information about operating hours. The disadvantage of method 2 is that it is relatively expensive when compared with method 1 and 3. Method 2a The data consist of three sets of two extraordinary readings of the electric utility meters
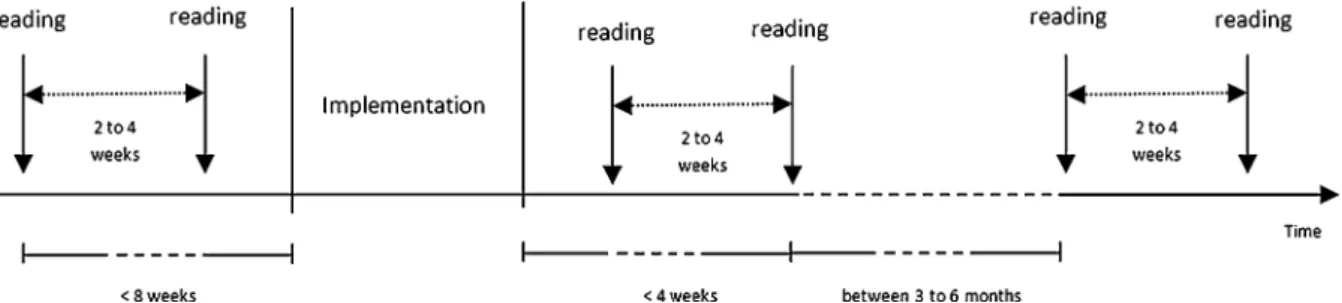
(including date, hour and kilowatt hour). The readings are performed the same day of the week at the same hour (±1 h) and are done for three time intervals (see Fig. 1below):
1. First interval for the determination of the baseline (i.e., energy consumption before implementation of the project);
2. Second interval just after the implementation of the project;
3. Third interval a few months after the implemen-tation of the project.
Method 2a is used mainly for the Low Income Household subprogram. The data is collected for all the flats in the building (participants and participants). The data collected from the non-participants is used as reference. The extraordinary measurements are made, in general, by the utility. Method 2b The data used with this method consist of load profiles that are recorded using electrical loggers (usually at 15-min intervals). The measurements are done at the three same time intervals as method 2a. These measurements can be made by engineering firms, electrical installers, or by the local utility. Analyses made with this method are presented in this paper.
Method 2c The data used consist of the recorded hours of operation. To obtain this kind of information, light sensor loggers and motor on/off loggers are installed to measure a sample of representative devices. The loggers measure the state of operation (i.e., on/off) of the lights or motors. These measure-ments are done at the three same time intervals as method 2b. Method 2c is used mainly for the Building Communal Areas subprogram.
Method 3—billing analysis
The gross annual energy savings are calculated by subtracting the energy consumption after implementa-tion (using one or two bills) from the energy consump-tion before implementaconsump-tion (using the last two or three bills). Let us note that in Geneva, the readings for small customers are, in general, only done on a yearly basis, therefore it is necessary to wait at least 1 year before making the savings estimations.
The evaluation methodology for the two subpro-grams can be summarized in the following way: 1. Method 1 is systematically applied for every
project. It allows to obtain an estimation of savings before or immediately after the imple-mentation of a project.
2. One or several options of method 2 are applied to a sample of projects. The information collected using the different options of method 2 allows to make accurate energy saving estimations and deduce other type of information (like average energy consumptions of different devices before and after implementation of the energy saving actions, hours of operation, etc.). The accuracy of our results will be calculated using“sampling theory”.
3. Improve our prediction models (method 1) by comparing the simple engineering estimations (ex-ante estimates—method 1) with the results obtained from the enhanced engineering estima-tions analyses (method 2).
4. Method 3 is also applied for every project 1– 2 years after the implementation of the projects.
Low income household energy efficiency subprogram (éco-sociale)
The aim of this subprogram is to favor the imple-mentation of energy efficient technologies in Low Income Households. More specifically, the program gives information, provided by energy ambassadors,7 on issues concerning energy conservation; if allowed by the participant, all of the incandescent light bulbs and halogen lamps of the participating household are
replaced by compact fluorescent lamps (CFLs); energy saving extension leads8 are installed and rebate vouchers are given to replace refrigerators (aged more than 2 years) by energy efficient ones. The objective of this subprogram is an electricity reduction of 1.8 GWh/year by end 2013; to achieve this, the subprogram has set a target of 4,500 households. Based on an ex-ante analysis, 407 kWh/ year savings per household were expected. This estimation was based on the hypothesis that a significant number of incandescent bulbs of 100 and 75 W would be replaced.
Case study (method 1 and method 2)—Pilot project Les Libellules
Brief description of the pilot project
For the first pilot project, a building with eight entrances was chosen (i.e., address no.: 2, 4, 6, 8, 10, 12, 14, and 16); it comprised 504 households benefiting from social subsidies and 336 (i.e., 67% participation rate) agreed to participate in the project.9 The project, implemented in November 2009, replaced 2,912 light bulbs by CFLs, installed 411 energy saving extension leads and changed 83 halogen lamps. This was accomplished by energy ambassadors who visited the apartments. In addition, 90 rebate vouchers for refrigerators were used by the participants to replace the existent fridges. Table 1 summarizes the data collected by the energy ambas-sadors during this action.
The average power of the removed bulbs amounts to 46.5 W/bulb (this value is lower than the one that was expected before the implementation of the project). This is mainly due to the fact that only a few 100 W incandescent light bulbs were found in the households. Probably one of the reasons is that, in Switzerland, starting from January 2009, light bulbs with energy labels F and G are no longer allowed in the market. Surprisingly, a high number of 40 W incandescent bulbs were found and replaced. The average power of the new installed CFLs is 14.6 W/
7
Specifically recruited to contact and visit the households; trained to replace the devices and give advice to participants on energy conservation issues.
8Audio and video devices are plugged into the extension leads.
The users are supposed to use the extension lead to easily power-off the plugged devices and avoid stand-by power consumption.
9
The rest of the households either did not agree to participate or could not be contacted by the ambassadors.
bulb. Below, method 1 and method 2 are used to assess the energy savings.
Simple engineering estimations—ex-ante (method 1) Of the light bulbs, 2,912 were replaced. The reduced power amounts to 93.1 kW, which gives an average of 32 W per replaced light bulb. The total electric energy savings can be estimated to lie between 117 and 122 MWh/year (see calculations below), when taking the following hypotheses: the mean use10 of light bulbs is 2 h a day; the extension leads allow a reduction11of 1 kWh/week, the refrigerators allow in average a 250 kWh/year economy.12 Power
informa-tion for the replaced halogen lamps is not yet available, but the savings were estimated to lie between 5 and 10 MWh/year. Further measurements and analysis will allow us to validate or improve these hypotheses. Lighting 0.032 kW/CFL×2,912 CFLs×2 h/day× 365 days/year = 68 MWh/year Ext_leads 1 kWh/week/ext_lead×411 ex._leads×52 weeks/year = 21 MWh/year Refrigerators 250 kWh/year/refrigerator× 90 refrigerators = 23 MWh/year
Halogen lamps = 5–10 MWh/year
Total = 117–122 MWh/year
Enhanced engineering estimations—ex post (method 2a) The ex-post data collected were of two types: extraordinary meter readings for each household (method 2a) and load profiles for all apartments at a given address (method 2b). In this paper, only the results pertaining to the consumption meters (method 2a) are given.
The two readings of each of the three pairs of readings were made at a 2-week interval.
The first pair of readings was made just before the intervention of the ambassadors. The energy con-sumed during these 2 weeks is used to establish the baseline.
The second pair of readings was made just after the intervention of the ambassadors. The energy con-sumed during this period, when compared to the baseline, accounts for the savings due to the replaced light bulbs and the installation of extension leads.
The third pair was made 4 months after the intervention of the ambassadors. During the time between the second and the third pair of readings, 90 inhabitants used the vouchers to replace their refrig-erators. The energy consumed during the third interval, when compared to the second, accounts for the refrigerators that were replaced, and when compared to the baseline, accounts for the entire project.
Figure2shows the distribution of the difference in energy consumption between two periods for partic-ipants and non-particpartic-ipants. The graph on the left represents the distribution just after the implementa-tion of the pilot project and the graph on the right represents the distribution 4 months later. It is
10We have not yet observed the average duration of the household
lighting considered by the project. A sample of 400 households (SAVE2002) gives various durations with respect to different countries, locations (kitchen, living room...) and type of lighting (principal, secondary…). The average duration lies between 0.95 and 3.1 h/day for kitchens, between 0.9 and 3.9 h/day for living rooms and between 1.3 and 2.3 h/d for bathrooms.
11The Swiss Energy Office estimates the average “stand-by”
weekly consumption of a fourfold family to 8.3 kWh/week, close to the european average 8.4 kWh/week (Sidler2009). For this first pilot project, it was assumed that the savings, due to the extension leads and the behavior of inhabitants, were 1/8th of the consumption.
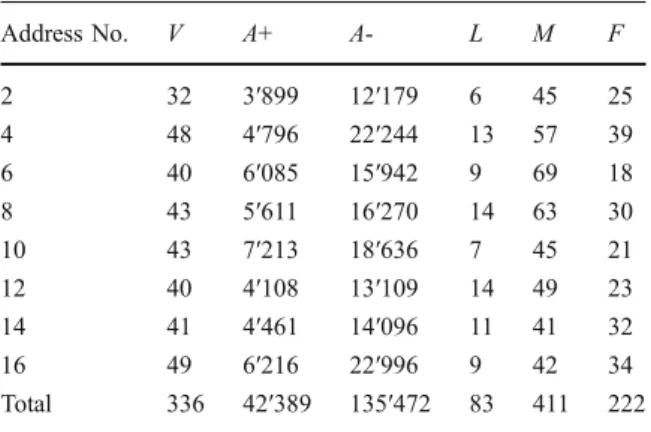
12According to Bush and Josephy (2007), the savings due to
the replacement of a 200 l class C refrigerator by an A++ amount to 150 kWh/year; the savings due to the replacement of a 252 l combined refrigerator/freezer amount to 340 kWh/year. Table 1 Data collected by the ambassadors during the first pilot project Address No. V A+ A- L M F 2 32 3′899 12′179 6 45 25 4 48 4′796 22′244 13 57 39 6 40 6′085 15′942 9 69 18 8 43 5′611 16′270 14 63 30 10 43 7′213 18′636 7 45 21 12 40 4′108 13′109 14 49 23 14 41 4′461 14′096 11 41 32 16 49 6′216 22′996 9 42 34 Total 336 42′389 135′472 83 411 222 V is the number of visits, A+ is the power [W] of CFLs installed, A− is the power [W] of light bulbs removed, L is the number of halogen lamps replaced, M is the number of energy saving extension leads installed, F is the number of refrigerator vouchers given out (refrigerator vouchers are distributed by the ambassadors only when the existing refrigerator is more than 2 years old; of which 90 were used)
possible to note that there are more participants to the left side and this is emphasized after 4 months, meaning that the participants on average reduced their energy usage while non-participants on average maintain a similar consumption. It is likely that, for reasons unrelated to the energy saving actions, the energy consumption between two periods will have some variations (this can be confirmed from the broad distribution in both graphs). However, we assume that the random variations are similar for both populations Some data concerning households showing zero consumption during one of the three periods (some flats were empty due to a building renovation plan) were removed to avoid biases. Therefore, the analysis was performed using the data from 478 households.
The next step consisted in splitting the data between the households that participated in the project and those that did not. The change in energy consumption between the third period and the baseline (first period) is computed for both groups in the following way: 100×(energy third period— energy baseline)/energy baseline. These calculations showed that the households participating in the project reduced their electric consumption by approx-imately 12%, whereas the consumption of the house-holds that did not take part in the program increased by 1.5%.
The average energy savings for the participating households can be then estimated to be 13.5% (12%– (−1.5%)), that is close to 350 kWh/year per partici-pating household (extrapolating the 2-week reduction to the year) and corresponds to 118 MWh/year (extrapolating for all 336 participants).
First conclusions (Low Income Household Energy Efficiency subprogram)
The methodology and first results The preliminary simple engineering estimations (117–122 MWh) are fairly accurate, they are close to the enhanced engineering estimations (118 MWh) based on meter readings (method 2a). However, as this is the first pilot project and considering that only data concerning meter readings during three 2-week periods was used, these first results need to be confirmed by in depth analysis (method 2b) and by further information that will be collected for the present pilot project such as billing information (method 3) and probably surveys of participants. Finally, similar data and analyses from the following projects should help us to validate the methodology and find the correct parameters to be used with method 1.
Feedback to the program administrator As described in the introduction of this section, the objective for the Low Income Household subprogram is an electricity reduction of 1.8 GWh/year by end 2013. To achieve this, the subprogram targeted 4,500 households with an expected saving of 407 kWh/year per household. The estimation of the expected savings per household was based on the hypothesis that a significant number of incandescent bulbs of 100 and 75 W would be replaced.
Our analysis of the first pilot project gives 350 kWh/year/household electric savings instead of the 407 kWh/year/household expected by the
pro-Fig. 2 Distribution of the differences in energy consumption (in %), for participants and non-participants, just after implementation (left) and 4 months later (right)
gram. This is probably due to the fact that a significant number of 40 W incandescent bulbs in use.
In order to reach the objective (1.8 GWh/year by end 2013), either the number of participants or the additional savings per participant have to be in-creased. For the next project, both recommendations are considered by the subprogram administrator who will try to increase the savings per household by means of offering in addition electrical kettles, introducing low consumption LED bulbs and increas-ing the percentage of participatincreas-ing households by improved advertisement of the project. The results of these changes will be analyzed in 2011.
Building communal areas subprogram (communs d’immeubles)
The Building Communal Areas (i.e., the services provided to all the occupants of a building) represent a large potential for electric energy savings; all the more since the cantonal regulation no longer requires (since 2005) 24 h per day lighting in building common spaces (or 12 h if natural light conditions are available).
The electricity savings objective for this subpro-gram is 20 GWh/year by end 2013. In order to accomplish this objective, it targets 5,000 buildings (4,000 kWh/year per project). During the first stage (i.e., 2007 to present), the subprogram merely considered the implementation of lighting retrofits.
The electricity consumption of building common areas shows two different aspects: part of the consumption can be easily calculated for it is controlled by clocks (night lights for example) or consists of 24 h/day lighting; another part of the consumption is related to the behavior of the build-ing’s occupants (i.e., the more or less frequent use of the lift, laundry machines, and now the new lights equipped with motion sensors).
Whenever possible, prediction models (method 1) will be used (Bertholet et at. 1996, 2008) and, concerning the behavior related consumptions, the average time of use of the various equipments will be estimated on the basis of measurements13(method 2).
For example, the mean duration and the standard deviation of the use of lighting equipped with motion sensors are, in our knowledge, poorly documented in Switzerland.14 Therefore a series of measurements based on a random sample of buildings would be very helpful in this matter.
Case study A: lighting retrofit—measurement of duration of lighting use (method 2)
The éco21 program performed some measurements related to the duration of lighting use in one of the buildings that participated in the program in 2008. The building is a residential building with nine floors and 36 apartments. In this project, 1,948 W of old lighting devices (incandescent and fluorescent) were replaced by 1,138 W of efficient fluorescent lighting equipped with motion sensors (i.e., when nobody is detected by the sensors, the lights are dimmed to a 30% level). The details are given in Table 2 below and the results presented here correspond to the second line of Table 2(in gray).
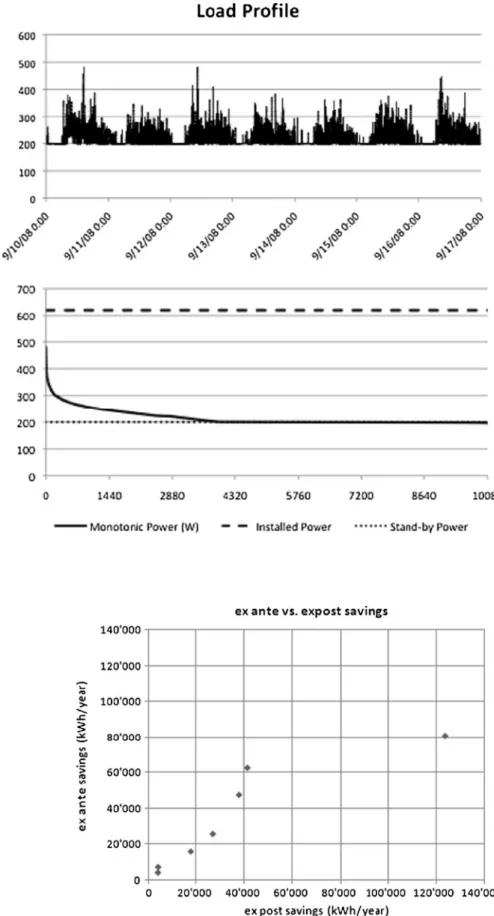
After the implementation of this project, the measurement of the load profile—during 1 week— was made for the building staircase (i.e., 20 lights amounting to 1,000 W prior to action and 620 W after action) in order to determine the duration of the use of the new lights. These devices were operating 24 h per day before the implementation of the project.
Figure3 (top) shows the load profile in W for the group of lighting devices mentioned above, measured from September 10 to 17, 2008. Figure 3 (bottom) gives the monotonic power curve (W) obtained from the load profile data, the level of the installed power (W), and the stand-by power (W).
The average operation hours of lights in high mode is calculated from the installed power (620 W), the monotonic power curve and the stand-by power (200 W). The area between the monotonic power curve and the stand-by power line divided by the area between the installed power line and the stand-by power line gives the factor of utilization of lighting devices. This analysis shows that the average opera-tion time of the staircase lighting is close to 70 min day−1. Similar measurements will permit us
13
Note that the variability of the intensities will be included in order to consider the specificity of the different buildings.
14In Switzerland, only non-verified hypotheses have been
given, for example a publication of the Federal Energy Office suggests a 3 h/day reduction for office lighting (Stalder and Naef2008).
to refine our prediction model concerning the duration and the standard deviation of lighting equipped with motion sensors.
Case study B: comparison between ex-post and ex-ante estimations
This case study compares the ex-ante estimates (i.e., the simple engineering estimations—method 1) per-formed by the electricians with the ex-post evaluation based on billing information (method 3; see Fig. 4). The comparison is based on 23 projects15 carried out during 2009—i.e., 7 buildings16—for which an
electric bill has already been issued after the imple-mentation of the project.
The electricians in charge of the implementation of the project performed the energy saving estimates on the basis of the characteristics of the existing equipment, those of the new equipment, and their personal experience.
The ex-post calculations of energy savings are merely based on the difference between the energy consumed before and after implementation. The data used for the calculations are the 2008 energy consumption (calculated by the utility using the electric bills) and a yearly extrapolation made on the basis of the last two readings of the utility meter that were available at the time this paper was written.
The total energy savings for the seven buildings is 256 MWh that represents 37% less than the electricity consumed during the baseline period (year 2008). This relatively large reduction can be explained by the fact that a considerable part of the lighting systems in the common areas of the participating buildings was operating 24 h per day. The total ex-ante estimations
(method 1) made by the electricians is not far from the ex-post calculations (method 3); the average difference amounts to 4%. However, if the same comparisons are made site by site, the differences go from−35% to +81%.
Similar measurements will help us to improve the prediction models that will be used by the electricians in future projects.
First conclusions (Building Communal Areas subprogram)
The first results of the preliminary ex-post evaluations using enhanced engineering estimations (method 2) and billing analysis (method 3) should enable us to improve the parameters (i.e., the average operating hours of lighting) to be used in the models for ex-ante estimations (method 1); this should also provide information on the potential of electric savings of individual projects helping to assess if the target of the subprogram can be achieved as it is now planned. The average savings per project is higher than that estimated by the program initiators. However, as the sample of buildings is small, this has to be confirmed.
General conclusions
The University of Geneva was requested to develop the evaluation methodology for the program éco21 (energy efficiency program addressing the electricity sector in Geneva, Switzerland) and perform the corresponding monitoring and evaluation. For two subprograms, three types of data collection and their methodologies of savings estimates are tested in case studies. They provide the following information: – At the project level (i.e., for the particular case
study projects analyzed here), the enhanced
Table 2 Information about removed lighting devices (left) and new devices (right) for a lighting retrofit in one test building Quantity (devices) P before/unit (W) Ptot before (W) Quantity (devices) Pafter/unit (W) Ptot after (W)
5 60 300 5 31 155 20 50 1,000 20 31 620 4 112 448 4 52 208 4 50 200 5 31 155 Total 1,948 Total 1,138 15
A project is defined for a given address.
16
Projects in the same building were grouped because, usually, there is only one meter for the entire building.
Fig. 3 Load profile (W) (top) for the group of light-ing devices in the buildlight-ing staircase; (bottom) mono-tonic power curve (W) obtained from the load pro-file above and levels for the installed power and standby power
Fig. 4 Comparison of the ex-post estimated savings (based on billing information) with the ex-ante saving estimations (made by the electricians in charge of the retrofit) for the seven buildings
engineering estimations are close to the simple engineering estimations. Therefore, a few addi-tional enhanced engineering estimations should be enough to improve the original hypotheses on the simple engineering estimations enabling to use the latter—more time and cost effective— alone in the future.
– At the subprogram level, the savings obtained by these first results can be used to improve the original estimates of the goal and target of the two subprograms.
References
Bertholet, J.-L. (2008). Trois essais de métrologie économé-trique dans le domaine énergétique, (Thèse No. 657), Université de Genève.
Bertholet, J.-L., Carlevaro, F., Langlo, E., Ouzilou, O., & Schmid, P. (1996). GENIE: Etude de l’indice de con-sommation d’énergie électrique dans le secteur immobilier genevois. Geneva: Office cantonal de l’énergie.
Bowie, R., Malvik, H.V. (2005). Measuring savings target fulfilment in the proposed directive on energy and end-use efficiency and energy services (COM (2003)0739) Pro-ceedings ECEEE 2005 Summer Study, 987–995. Broc, J.-S., Bourges, B., & Adnot, J. (2007). Evaluation as a
“learning-by-doing” tool for the implementation of local energy efficiency activities. Chicago: Proceedings of Energy Program Evaluation Conference.
Broc J.-S., Adnot, J., Bourges, B., Thomas, S., Vreuls, H. (2009). The development process for harmonised bottom-up evalu-ation methods of energy savings, EMEEES project. Bush, E., Josephy, B., Réfrigérateurs et congélateurs A++ pour
une meilleure efficacité energétique (2007) Suisse Energie, Energy federal office, Switzerland.
SIG (Services Industriels de Genève) (2008). Rapport de développement durable, Geneva.
OCSTAT (Office Cantonal de la Statistique) (2008). Résultats statistiques—Bilan et état de la population du canton de Genève en 2008. Geneva.
Ecofys, Lund University, Wuppertal Institute (2006). Guide-lines for the monitoring, evaluation and design of energy efficiency policy, AID-EE project:http://www.aid-ee.org/ documents.htm
Ecofys, Lund University, Wuppertal Institute (2007). Success and failure in energy efficiency policies. Ex-post evalua-tion of 20 instruments to improve energy efficiency across Europe, AID-EE project:http://www.aid-ee.org/documents. htm
Eichhammer, W., Boonekamp, P., Labanca, N., Schlommann, B., Thomas, S. (2008). Distinction of energy efficiency improvement measures by type of appropriate evaluation method, EMEEES project.
EVO (Efficiency Valuation Organization) (2009). International performance measurement and verification protocol— Concepts and options for determining energy and water savings. Vol 1,www.evo-world.org
Harmelink, M., Harmsen, R., Nilsson, L. (2007). From theory based policy evaluation to SMART policy design: lessons learned from 20 ex-post evaluations of energy efficiency instruments. Proceedings ECEEE 2007 Summer Study, 589–600.
SRC International A/S, Denmark (2001). A European ex-post evaluation guidebook for DSM and EE service pro-grammes (The SAVE project).
Le Strat, P. (2009). Mission d’accompagnement du programme ECO21- Services Industriels de Genève—Approfondissement de la méthodologie. Unpublished document.
Nilsson, L. J., Lopes, C., Fonseca, P., Labanca, N. (2008). Assessment of existing evaluation practice and experience, EMEEES project.
Official Journal of the European Union (2006). Directive 2006/ 32/EC of the European Parliament and of the Council.
http://eur-lex.europa.eu/LexUriServ/LexUriServ.do? uri=OJ:L:2006:114:0064:0064:en:pdf
SAVE program (2002). Campagne de mesures par usage dans 400 logements de la Communauté européenne. Extrait thématique: l’éclairage. Projet EURECO.
ScanE (Service cantonal de l’énergie) Plan directeur cantonal de l’énergie 2005–2009, Geneva.
Sidler, O. (2009). Connaissance et maîtrise des usages spécifiques de l’électricité dans le secteur résidentiel. Enertech: Notes techniques.
Stalder, M., Naef, R. (2008). Evaluation und Konzeption von Systemen zur einfachen Nachrüstung von Eleuchtung mit Bedarfssteuerungen, Schlussbericht, OFEN, Bern.