HAL Id: hal-00016869
https://hal.archives-ouvertes.fr/hal-00016869
Preprint submitted on 13 Jan 2006
HAL is a multi-disciplinary open access
archive for the deposit and dissemination of
sci-entific research documents, whether they are
pub-lished or not. The documents may come from
teaching and research institutions in France or
abroad, or from public or private research centers.
L’archive ouverte pluridisciplinaire HAL, est
destinée au dépôt et à la diffusion de documents
scientifiques de niveau recherche, publiés ou non,
émanant des établissements d’enseignement et de
recherche français ou étrangers, des laboratoires
publics ou privés.
Evidence for non-conventional pairing in
Na_xCoO_2
·yH_2O
Jean-Pascal Rueff, M. Calandra, M. d’Astuto, Ph. Leininger, A. Shukla, A.
Bossak, M. Krisch, H. Ishii, Y. Cai, P. Badica, et al.
To cite this version:
Jean-Pascal Rueff, M. Calandra, M. d’Astuto, Ph. Leininger, A. Shukla, et al.. Evidence for
non-conventional pairing in Na_xCoO_2
·yH_2O. 2006. �hal-00016869�
ccsd-00016869, version 1 - 13 Jan 2006
Evidence for non-conventional pairing in Na
xCoO
2·yH
2O
J.-P. Rueff,1, 2 M. Calandra,3 M. d’Astuto,3 Ph. Leininger,2 A. Shukla,3 A. Bossak,4
M. Krisch,4 H. Ishii,5 Y. Cai,5 P. Badica,6 T. Sasaki,6 K. Yamada,6 and K. Togano6, ∗
1Synchrotron SOLEIL, L’Orme des Merisiers, Saint-Aubin, BP 48, 91192 Gif-sur-Yvette Cedex, France. 2Laboratoire de Chimie Physique–Mati`ere et Rayonnement (UMR 7614),
Universit´e Pierre et Marie Curie, 11 rue Pierre et Marie Curie, 75231 Paris Cedex 05, France. 3Institut de Min´eralogie et Physique de la Mati`ere Condense,
CNRS - Universit´e Paris 6, Place Jussieu, 75005 Paris, France. 4European Synchrotron Radiation Facility, BP 42 Grenoble, France. 5National Synchrotron Radiation Research Center, Hsinchu 30076, Taiwan.
6Institute for Materials Research, Tohoku University, Katahira 2-1-1, Aoba-ku, Sendai 980-8577, Japan.
We report on first investigation of the lattice dynamics in the novel superconducting material Na0
.35CoO2·1.3H2O and the non-hydrated parent compound Na0.7CoO2 by inelastic x-ray scatter-ing. The measured phonon dispersion along the Γ − M direction show a marked softening with hole doping of two optical phonon branches close to the Brillouin zone boundary. The phonon spec-tra, dispersion, and softening are well reproduced by first-principle calculations. The calculations indicates that the soft branches are mainly composed of Co-vibration modes. The estimation of the critical temperature based on electron-phonon coupling mechanism undisputedly points to a non-conventional superconducting state in this material.
As new superconductors are discovered, the identifica-tion of underlying pairing mechanisms is a key step in the understanding of the physics of these materials [1, 2].
In the hydrated bilayer cobaltate [3] NaxCoO2·yH2O
su-perconductivity is observed in a narrow range of Na
con-centration with an optimal Tc of ∼5 K [4]. The novel
material is prepared from the hydration of the parent
compound Na0.7CoO2 (NCO). The structure [3, 5, 6] of
Na0.7CoO2(space group P63/mmc) consists of
alternat-ing layers of Na and CoO2 planes, stacked along the c
axis in the hexagonal structure, showing some similarities
with high-Tc cuprates. The Na atoms can occupy two
crystallographic sites (2b or 2d), not necessarily in an
or-dered pattern. In contrast to NCO, Na0.35CoO2·1.3H2O
(NCOH) has a considerably expanded c axis due to the intercalation of ice-like sheets in the structure.
The parent unhydrated compounds NaxCoO2 have a
rich phase diagram, ranging from a Curie-Weiss metal (0.5 < x < 1), a charge transfer insulator (x = 0.5) to a normal paramagnetic metal (x < 0.5) [7]. As it turns out, the Co electronic properties are not fully character-ized. In NCO and NCOH, Co supposedly coexists in two
formal valent states, Co3+ (S=0) and Co+4 (S=1/2),
both in low-spin configuration. Thus, the Co ions form a frustrated two-dimensional triangular lattice as oppo-site to the Cu square lattice in cuprates. The overall picture is further complicated by the highly controver-sial electronic structure. A crucial issue is the existence of “hole pockets” on the Fermi surface : Hole doping
results in the depletion of the Co-t2g conduction band.
Under trigonal distortion, the t2g triplet splits into two
e′
g bands and one ag band, which cross at the Fermi
en-ergy. The latter forms a large hole-type Fermi surface around Γ, but the main contribution to the hole
den-sity of states at the Fermi energy is due to the Co-e′
g
holes, supposedly distributed in 6 small pockets. These were predicted by calculations [8, 9, 10] and, in the case of non-conventional pairing, their presence could help to distinguish between different pairing symmetries [11]. However they have not be detected in photoemission ex-periments [12, 13]. More recently, the formation of hole pockets are found robust against dynamical Coulomb cor-relations [14], while no such a Fermi-surface topology is reported in the strong coupling limit [15]. The proximity of charge, magnetic [16] and structural [17] instabilities and the frustrated Co-O triangular lattice suggests that the novel cobaltate could have exotic superconducting states. No information (experimental or theoretical) ex-ists on phonon dispersion and electron-phonon coupling in this material and the question remains of whether a conventional electron-phonon mechanism would yield the
measured Tc.
In this work, we provide concrete evidence for the ex-otic character of the superconducting state. We measure the phonon dispersion in NCO and NCOH single crys-tals by inelastic x-ray scattering (IXS). The phonon dis-persion and the electron-phonon coupling are calculated from density functional theory. The results reveal pro-nounced softening of two optical phonon modes mainly formed by Co vibrations, while the calculated electron-phonon coupling strength definitively excludes conven-tional pairing mechanism. Further, the softening corre-sponds closely to what one would expect from a nesting
mechanism arising from the e′
ghole-pocket Fermi surface.
These findings go a long way in identifying the character of the superconducting state in NCOH [11].
The small sample size (400 × 200 × 50 µm3) excludes
2 IXS the privileged technique for measuring phonons [18].
The experiment was carried on the ID-28 beamline at the European Synchrotron Radiation Facility (ESRF). Details about the experimental setup has been described elsewhere [19]. The resolution of 3 meV was achieved by selecting the Si(9,9,9) order of reflection for both the monochromator and the 5 spherical analyzers, and owing to the extreme backscattering geometry of the
IXS spectrometer. The monochromatic beam is
fo-cused by a toroidal mirror into a spot of 250 × 90 µm2
(horizontal×vertical) full width at half maximum at the sample position. NCO was mounted in a vacuum cham-ber at room temperature in order to reduced background scattering, and remove humidity from the air. To pre-serve hydration, NCOH was mounted in a closed-cycle cryostat and maintained at 100 K during the measure-ment. The lattice parameters for both samples were es-timated by monitoring the (1,0,0) and (1,0,1) Bragg
re-flections on the detector. We obtained a = 2.82 ˚A and
c = 11.63 ˚A in NCO and a = 2.83 ˚A and c = 19.6 ˚A
in NCOH, in good agreement with the values reported in the literature for the two phases [5]. In the latter, we
measured a critical temperature Tc of 4.6 K by magnetic
susceptibility. All the phonon spectra were measured in the second Brillouin zone around (1,0,0). To extract the phonon frequencies, the experimental spectra were least-square fitted to a sum of Lorenzian pairs, weighted by the Bose factor.
Figure 1 shows the IXS phonon spectra in NCOH and NCO, along the Γ-M direction. Well defined pholike excitations are observed up to 80 meV, while non-dispersive features show up in most of the spectra up to the 10 meV region. As discussed hereafter, these are not correlated to any calculated phonon modes of NCOH and NCO, and may be reasonably attributed to the presence of impurities or to Na disorder in the sample. The spectra are compared to first-principle calculations. Electronic structure calculations [20] are performed using Density Functional Theory (DFT) in the local density approxi-mation (LDA) and ultrasoft pseudopotentials [21]. The electronic wavefunctions and the charge density are ex-panded using a 35 and a 350 Ryd cutoff respectively. The dynamical matrices and the electron-phonon coupling are calculated using Density Functional Perturbation Theory in the linear response [20]. For the electronic integration
in the phonon calculation we use a Nq = 6 × 6 × 2
uni-form k-point mesh and and Hermite-Gaussian smearing of 0.05 Ryd. For the calculation of the electron-phonon
coupling we use a finer Nk = 25 × 25 × 25 Monkhorst
Pack mesh. The electron-phonon coupling for a phonon mode ν with momentum q is derived from:
λqν = 4 ωqνN (0)Nk X k,n,m |gν kn,k+qm| 2δ(ǫ kn)δ(ǫk+qm) (1) where the sum is carried over the Brillouin Zone. N (0) is
0 100 200 300 400 Na 0.7CoO2 (1.5,0,0) 0 20 40 60 80 100 (1.4,0,0) 0 100 200 300 (1.3,0,0) 0 100 200 300 (1.2,0,0) 0 20 40 60 80 0 200 400 600 800 E (meV) (1.1,0,0) 0 20 40 60 80 100 Na 0.35CoO2⋅1.3H2O (1.5,0,0) 0 20 40 60 80 100 (1.4,0,0) 0 50 100 150 Total counts (1.3,0,0) 0 50 100 150 200 250 (1.2,0,0) 0 20 40 60 80 0 100 200 300 400 E (meV) (1.1,0,0) Exp. Calc. 2b Calc 2d Exp. Calc. 2b Calc 2d
FIG. 1: IXS spectra in non-hydrated and hydrated com-pounds measured along the Γ-M direction (open circles). The measurements are compared to ab-initio calculations of the dynamical structure factor (solid lines). The calculated spec-tra are shown for Na occupying sites 2b and 2d. The main dispersive feature is pointed by arrows.
the electron density of states at the Fermi level and ǫkn
are the DFT energy bands. The electron-phonon matrix
element is gν
kn,k+qm = hkn|δV /δuqν|k + qmi/p2ωqν,
where uqν and ωqν are the amplitude of the
displace-ment and the frequency of the phonon ν of wavevec-tor q respectively while V is the Kohn-Sham poten-tial. The average electron-phonon coupling then reads
as λ = 1
Nq
P
q,νλqν. The doping of NaCoO2is modeled
simulating a charged cell with overall number of
elec-trons corresponding to NaxCoO2. Since the positions of
Na atoms are not determined we perform different simu-lations for Na occupying the 2b or the 2d positions.
Cal-culating the phonon dispersion of Na0.35CoO2·yH2O is
intractable due to the large number of atoms in the cell. However it has been shown [22] that the main effect of
the intercalation of water in NaxCoO2is the c−axis
ex-pansion. Unfortunately calculations of NaxCoO2 with
an expanded lattice parameters produces very flat bands with two very steep unphysical Na bands crossing the Fermi level [22]. As a consequence, the phonons were
calcualted in Na0.35CoO2 and are here compared with
the experiment in Na0.35CoO2·yH2O.
Despite the approximations involved in the calcula-tions, there is broad agreement with experiment as ob-served in Fig. 1. The measured phonon linewidths are systematically found larger (5-6 meV) than the
experi-mental resolution (3 meV). The broadening effect applies to all modes, independent of the momentum transfer, while calculated phonon linewidths are resolution lim-ited. This points to an extrinsic origin presumably
re-lated to the crystal mosaicity (∼ 1◦), besides other
cu-mulative effects. For comparison the calculated spectra were convoluted with a 6 meV broadening.
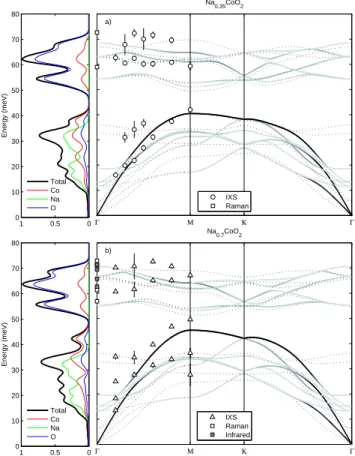
We focus more particularly on the optical phonon mode (indicated by arrows in Fig. 1) which is dispersive along the Γ-M direction. The theoretical calculations correctly reproduce the frequency and spectral weight of this mode, although the calculated frequencies in NCO are slightly lower than measured ones close to M . This discrepancy can be easily understood when taking into account uncertainty in the determination of the Na con-centration (x = 0.7±0.1) and the strong sensitivity of the calculated phonon frequency of this mode on doping, in the vicinity of the M point. Using x = 0.8 for instance, we obtain ω = 47.6 meV at M , within 5% of the experi-ment. The same mode is seen in the hydrated sample (see arrows), but now significantly softened. At the M point, the experimental softening amounts to ∆ω = 7.6±1 meV. The experimental phonon frequencies are reported in Fig. 2 for NCO and NCOH along with the full calculated
dispersion in model Na0.7CoO2 and Na0.35CoO2
com-pounds. The phonon dispersion is obtained by Fourier interpolation of the dynamical matrices computed on the
Nq points mesh. The intensity of the dynamical
struc-ture in the measured Brillouin zone is gray scale-coded. Raman and infrared data [23] are also indicated as refer-ence. The theoretical phonon dispersions resemble each other closely except for the optical branches in the 40–45 meV energy region which are sensibly softened on reduc-ing x from 0.7 to 0.35. The other branches are barely affected. The softening is consistently reproduced by the experimental results in the hydrated sample despite the mediocre quality of the spectra. Our calculation indi-cates that the softening is due principally to the reduc-tion of Na content and not to hydrareduc-tion. In addireduc-tion
to the calculations in Na0.35CoO2 with a reduced c
pa-rameter (shown in Fig. 2a), the effect of hydration was
modeled by simulating two layers of CoO2 separated by
an expanded c parameter and having a formal charge corresponding to x = 0.35. The calculated phonon dis-persion (not shown here) exhibit a comparable softening of the optical branches, which signifies that softening is
solely related to the doping in the CoO2 layers. As
in-ferred from the eigenvector analysis of the computed dy-namical matrix, in the two compounds the high energy region of the phonon dispersion is mainly composed of oxygen vibrations while the intermediate energy region which shows the main softening effect is mainly due to cobalt vibrations.
We can now estimate the critical temperature for
Na0.7CoO2 and for Na0.35CoO2 from the average
electron-phonon coupling λ and phonon frequency
log-Γ Μ Κ Γ b) Na0.7CoO2 IXS Raman Infrared 0 10 20 30 40 50 60 70 80 0 0.5 1 Energy (meV) Total Co Na O Γ Μ Κ Γ a) Na0.35CoO2 IXS Raman 0 10 20 30 40 50 60 70 80 0 0.5 1 Energy (meV) Total Co Na O
FIG. 2: Measured (open symbols) and calculated (solid cir-cles and dotted lines) phonon dispersion along high-symmetry directions in NCOH and NCO. For clarity purpose, only cal-culations with Na-2b sites occupied are shown. The structure factor intensity is indicated in normalized unit by the gray scale form black (1) to light gray (10−6), and below 10−6 as dotted lines. Raman and infrared data are borrowed from Ref. 23. Left panels represent the projected phonon density of states.
arithmic average hωi. The calculated values are λ = 0.21 and hωi = 42.5 meV for x = 0.7 and λ = 0.29 and hωi = 40.3 meV for x = 0.35. Using McMillan’s formula
we obtain Tc ≈ 0.001 K for x = 0.7 and Tc = 0.15 K
for x = 0.35 with the Coulomb pseudo-potential
con-stant set at µ∗ = 0.1. These are upper estimates of Tc
since in both systems µ∗ is probably larger.
Calcula-tions for the expanded CoO2 bilayer lead to λ = 0.28,
hωi = 38.6 meV and Tc = 0.12 K, showing that the
ex-pansion of the lattice spacing weakly affects the electron-phonon coupling. Some earlier works indicate that water intercalation affects the valence of Co [6, 24]. The agree-ment between the phonon spectra and our calculation indicates that this effect if any is negligible. Since the
calculated Tc, based on a conventional electron-phonon
mechanism, gives results which are more than an order
of magnitude smaller than the measured Tc, we have a
strong argument for invoking a non-conventional pairing mechanism. As noted in Ref. 11, the determination of
4 the pairing symmetry also requires a knowledge of the
electronic structure. In particular a crucial aspect is the presence of hole pockets on the Fermi surface. As it turns out, our phonon spectra reveal information about these hole pockets through their influence on phonon frequen-cies. Indeed the softening of the optical phonon-mode is connected to the real part of the phonon self-energy due to the electron-phonon interaction, namely:
Πν(q, ωqν) = 2 X k,m,n |gν kn,k+qm| 2 fk+qm− fkn ǫk+qm− ǫkn− ωqν− iη (2)
where fkm stands for the Fermi function. If the
matrix elements gν
kn,k+qm are assumed to be constant,
Πν(q, ωqν) is related the one-electron susceptibility as
calculated in Ref. 8. For x = 0.35 the real part of
Πν(q, ωqν) displays pronounced features at the M point
which is close to the hole pocket nesting vectors. The net effect on the phonon spectrum is the softening of the phonon branches mentioned earlier.
In conclusion, we present first measurements and
cal-culations of the phonon dispersion of Na0.7CoO2 and
Na0.35CoO2·yH2O using inelastic scattering of hard
x-rays as a probe of bulk properties. A good agreement is found between theoretical and experimental phonon dispersion. The estimation of the superconducting criti-cal temperature assuming a phonon-mediated mechanism leads to values which are more than an order of mag-nitude smaller than the measured critical temperature. Moreover the measured and calculated softening of opti-cal phonon modes can be traced back to the existence of the hole pocket Fermi surface. These results point in the direction of a non-conventional superconducting state in
Na0.35CoO2·yH2O.
∗ Present address: National Institute of Materials Science, Tsukuba, 1-2-1 Sengen, 305-0047, Japan.
[1] D. V. Harlingen, Rev. Mod. Phys. 67, 515 (1995). [2] A. Mackenzie and Y. Maeno, Rev. Mod. Phys. 75, 657
(2003).
[3] K. Takada, H. Sakurai, E. Takayama-Muromachi, F. Izumi, R. Dilanian, and T. Sasaki, Nature 422, 53 (2003).
[4] D. P. Chen, H. C. Chen, A. Maljuk, A. Kulakov, H. Zhang, P. Lemmens, and C. T. Lin, Phys. Rev. B
70, 024506 (2004).
[5] J. Lynn, Q. Huang, C. Brown, V. Miller, M. Foo, R. Schaak, C. Jones, E. Mackey, and R. Cava, Phys. Rev. B 68, 214516 (2003).
[6] K. Takada, K. Fukuda, M. Osada, I. Nakai, F. Izumi, R. A. Dilanian, K. Kato, M. Takata, H. Sakurai, E. Takayama-Muromachid, et al., J. Mater. Chem. 14, 1448 (2004).
[7] M. L. Foo, Y. Wang, S. Watauchi, H. W. Zandbergen, T. He, R. J. Cava, and N. P. Ong, Phys. Rev. Lett. 92, 247001 (2004).
[8] M. D. Johannes, I. I. Mazin, D. J. Singh, and D. A. Pa-paconstantopoulos, Phys. Rev. Lett. 93, 097005 (2004). [9] D. J. Singh, Phys. Rev. B 61, 13397 (2000).
[10] P. Zhang, W. Luo, M. L. Cohen, and S. G. Louie, Phys. Rev. Lett. 93, 236402 (2004).
[11] I. I. Mazin and M. D. Johannes, Nature Physics 1, 91 (2005).
[12] H.-B. Yang, S.-C.Wang, A. K. P. Sekharan, H. Matsui, S. Souma, T. Sato, T. Takahashi, T. Takeuchi, J. C. Campuzano, R. Jin, et al., Phys. Rev. Lett. 92, 246403 (2004).
[13] M. Z. Hasan, Y.-D. Chuang, D. Qian, Y. Li, Y. Kong, A. Kuprin, A. Fedorov, R. Kimmerling, E. Rotenberg, K. Rossnagel, et al., Phys. Rev. Lett. 92, 246402 (2004). [14] H. Ishida, M. D. Johannes, and A. Liebsch, Phys. Rev.
Lett. 94, 196401 (2005).
[15] S. Zhou, M. Gao, H. Ding, P. A. Lee, and Z. Wang, Phys. Rev. Lett. 94, 206401 (2005).
[16] A. T. Boothroyd, R. Coldea, D. A. Tennant, D. Prab-hakaran, L. M. Helme, and C. D. Frost, Phys. Rev. Lett. 92, 197201 (2004).
[17] Q. Huang, M. L. Foo, R. A. P. Jr., J. W. Lynn, B. H. Toby, T. He, H. W. Zandbergen, and R. J. Cava, Phys. Rev. B 70, 184110 (2004).
[18] M. d’Astuto, P. K. Mang, P. Giura, A. Shukla, P. Ghigna, A. Mirone, M. Braden, M. Greven, M. Krisch, and F. Sette, Phys. Rev. Lett. 88, 167002 (2002).
[19] M. Krisch, R. A. Brand, M. Chernikov, and H. R. Ott, Phys. Rev. B 65, 134201 (2002).
[20] S. Baroni, S. de Gironcoli, A. D. Corso, and P. Giannozzi, Rev. Mod. Phys. 73, 515 (2001).
[21] D. Vanderbilt, Phys. Rev. B 41, 7892 (1990).
[22] M. D. Johannes and D. J. Singh, Phys. Rev. B 70, 014507 (2004).
[23] Z. Li, J. Yang, J. G. Hou, and Q. Zhu, Phys. Rev. B 70, 144518 (pages 6) (2004).
[24] C. J. Milne, D. N. Argyriou, A. Chemseddine, N. Aliouane, J. Veira, S. Landsgesell, and D. Alber, Phys. Rev. Lett. 93, 247007 (2004).

![[PDF] Document langage C : apprendre les bases de la programmation | Cours langage c](data:image/gif;base64,R0lGODlhAQABAIAAAP///wAAACH5BAEAAAAALAAAAAABAAEAAAICRAEAOw==)