Data-driven Predictive Modeling for Cell Line Selection in
Biopharmaceutical Production
by
Yucen Xie
B.S. Chemical Engineering, University of California Los Angeles, 2014 Submitted to the MIT Sloan School of Management and the Department of Chemical
Engineering in Partial Fulfillment of the Requirements for the Degrees of Master of Business Administration
and
Master of Science in Chemical Engineering
In conjunction with the Leaders for Global Operations Program at the
MASSACHUSETTS INSTITUTE OF TECHNOLOGY
June 2019
0 2019 Yucen Xie. All rights reserved.
The author hereby grants to MIT permission to reproduce and to distribute publicly paper and electronic copies of this thesis document in whole or in part in any medium now known or
hereafter created, Signature of Author Certified by Certified by Appnroved by Approved by Approved by H
JUN
f 4
2019
LIBRARIES
ARCHIVES
Signature redacted
MIT Sloan School of Mana ement, Department of Chemical Engineering May 6, 2019
Signature redacted_
( -'-Christoph6r Love, Thesis Supervisor Associate Professor, lITDepartmentyf Chemical Engineering
Signature redacted
Colin Fogarty, Thesis Supervisor Assistant Professor, MIT Sloan School of Management
Signature redacted
Maura Herson Assistant Dean of MBA Program, MIT Sloan School of Management
Signature redacted
Patrick Doyle Professor of Chemical Engineering, MIT Department of Chemical Engineering
This page intentionally left blank.
Data-driven Predictive Modeling for Cell Line Selection in Biopharmaceutical Production
by
Yucen Xie
Submitted to the MIT Sloan School of Management and the Department of Chemical Engineering on May 6, 2019 in Partial Fulfillment of the Requirements for the Degrees of Master
of Business Administration and Master of Science in Chemical Engineering Abstract
A critical component of the biopharmaceutical development cycle is the selection of the cell line
that will become the Master Cell Bank for product manufacturing for clinical and commercial use. This cell line selection process is resource-intensive, requiring several months, involving hundreds of cell cultures and corresponding assays, and is largely conducted on a per-experiment basis. Ultimately, a single cell line that can yield product of consistently high quality and titers is selected. In this thesis, we aggregated historical, pre-clinical program data to create analytic tools. We deployed machine learning algorithms to produce insights and provide predictive power for cell
line selection in future experiments. Our models reduced prediction errors by 38 - 90% for
bioreactor end-point titer and product quality metrics. These interpretable and robust models lead to better knowledge of key attributes affecting titer and product quality as well. Our models are currently deployed as a web-based tool, and pilot studies prove we can generate massively parallel in silico predictions with high accuracy. Ultimately, our project can lead to more productive and higher quality cell lines and reduced development cycle times.
Utilizing a modular algorithmic framework, our novel application of machine learning not only delivers efficiency and differentiation in the cell line selection process, but also promotes a scalable and transferable digital platform for analogous applications throughout the biopharmaceutical industry.
Thesis Supervisor: Christopher Love
Raymond A. (1921) and Helen E. St. Laurent Professor, MIT Department of Chemical Engineering
Thesis Supervisor: Colin Fogarty
Acknowledgments
I would like to express my deepest appreciation for the team that has contributed to this thesis.
Professor Christopher Love and Professor Colin Fogarty, thank you both for your guidance and insight throughout the project. Your combination of biopharmaceutical expertise, statistical knowhow, and overall support have made a tremendous positive impact on this thesis.
I would like to thank the Amgen team as well. The mix of admirable leadership and scientific
intellect shared by Chetan Goudar, Neil Soice, Jennitte Stevens, Chun Chen, Chris Tan, Jasmine Tat and countless others have contributed tremendously toward the direction and progress in our work. My sincerest gratitude goes to Kim Le, who was not only my company supervisor who provided the vision for our work, but also a mentor and friend.
I greatly appreciate the support and advice from the LGO alumni, staff, and colleagues throughout
this process. I am sincerely thankful to be a part of the LGO family, for these two years and beyond. Lastly, I would like to thank my family and friends for preparing me for the opportunity to do this work. I am forever grateful for your influence, sacrifices, and mentorship as I continue my journey.
Table of Contents
A b stra c t ... 3
A cknow ledgm ents... 5
List of Figures ... 9
List of Tables ... 11
I Introduction ... 13
1.1 Background ... 13
1.1.1 Biopharm aceutical Industry... 13
1.1.2 A m gen... 14
1.1.3 Cell Line D evelopm ent w ithin the Biologics Pipeline ... 15
1.1.4 N ecessity for Clone Screening... 17
1.1.5 Clone Screening Process... 19
1.2 Project O verview ... 20
1.2.1 Project M otivation and Opportunity ... 21
1.2.2 G oals ... 21
1.2.3 Significance of Study... 25
1.2.4 Thesis Outline ... 25
2 Literature Review ... 27
2.1 Cell Line D evelopm ent ... 27
2.2 D ata A nalytics in Biotechnology ... 30
3 Research M ethodology... 31
3.1 Contextualization ... 31
3.1.1 First-principles vs. Statistical A pproach ... 32
3.1.2 D ata D escription ... 32
3.2 D ata Collection... 36
3.3 Preprocessing and Feature Engineering ... 37
3.3.1 H eterogeneity of D ata... 38
3.3.2 Treatm ent of Outliers and Data Errors... 39
3.3.3 Im putation Strategy for M issing V alues ... 40
3.3.4 D ata Exploration ... 41
3.3.5 Feature Extraction... 42
3.3.6 Feature Selection... 44
3.4 A lgorithm ic Fram ew ork D esign... 45
3.4.1 Selecting Relevant D ata... 46
3.4.2 Populating the M odel Library... 47
3.4.3 D esigning the M achine Learning Pipeline... 49
3.4.4 Choosing the best m odel... 51
3.4.5 Final production m odel ... 52
3.5 Results interpretability ... 52
3.5.2 Recursive Feature Elim ination... 53
3.5.3 Generating Prediction Intervals Using the Conformal Prediction Framework... 54
3.6 Tools for Visualization... 55
3.7 Implem entation Process ... 56
4 Results ... 57
4.1 M odel Perform ance ... 57
4.1.1 Predicting Titers... 58
4.1.2 Predicting Product Quality Attributes... 62
4.1.3 Picking Good Clones ... 65
4.2 Selecting Relevant Features and A ssays ... 69
4.2.1 Tracking the Im portance of Different Assays... 69
4.2.2 Balancing Prediction Perform ance and Interpretability... 75
5 Im plem entation... 78
5.1 Case Studies ... 78
5.1.1 Predicting Clone Performance for a Monoclonal Antibody ... 78
5.1.2 Predicting Clone Performance for a Bispecific Format A program ... 80
5.2 Knowledge Transfer Process... 82
5.2.1 Interactive W eb Application ... 83
5.2.2 Trainings and Docum entation... 87
6 Recom m endations and Conclusions... 91
6.1 Highlighted Results ... 91
6.2 Business Im pact... 92
6.3 Future W ork and Opportunities for Im provem ent ... 95
6.3.1 Opportunities for Improvement in the Prediction Framework ... 95
6.3.2 Opportunities for Additional Functionality ... 97
6.3.3 Concluding Thoughts... 98
7 References ... 99
Appendix... 107
A .1 Feature List... 107
A .2 M odel Generation Algorithm ... 112
List of Figures
Figure 1-1: Relevant teams in process and organization structure within Amgen ... 15
Figure 1-2: Cell line developm ent process flow ... 17
Figure 1-3: Schematic of the clone screening process... 19
Figure 1-4: Machine learning aims to improve clone quality and saves time and resources. ... 22
Figure 3-1: Business context of the scope of work... 31
Figure 3-2: Spread of bioreactor end-point titers (scaled by mean) ... 33
Figure 3-3: Spread of bioreactor end-point SEC main peak profiles... 34
Figure 3-4: D atafram e structure... 35
Figure 3-5: Correlation matrix for select CLD features... 43
Figure 3-6: Model generation flowchart following our algorithmic framework ... 46
Figure 3-7: M achine learning pipeline... 50
Figure 4-1: Cross-validation RMSE spread comparison across estimators for use cases predicting tite rs ... 6 0 Figure 4-2: Cross-validation RMSE spread comparison across estimators predicting bioreactor end-point SE C M ain P eak... 65
Figure 4-3: Spread of prediction target values in historical dataset, stacked by modality. ... 67
Figure 4-4: Feature importance and coefficient plots predicting titers... 71
Figure 4-5: Feature importance plots predicting titers, filtered by modality ... 71
Figure 4-6: Feature importance and coefficient plots predicting SEC Main Peak ... 73
Figure 4-7: Feature importance plots predicting SEC Main Peak, filtered by modality ... 73
Figure 5-1: Case study predicting productivity and quality of top clones for a monoclonal
antib ody p rogram ... 79
Figure 5-2: Case study predicting productivity and quality of top clones for a bispecific format A p ro g ram ... 8 0
Figure 5-3: Formatting app screenshot ... 83
Figure 5-4: Screenshot of user interface for Predictive Modeling for Cell Selection app... 84
Figure 5-5: Generated predictions for small-scale clones using the app ... 85
Figure 5-6: Remainder of app output, showing supporting model metrics to guide decision-m ak in g ... 8 6
Figure 5-7: Swim lane chart on how to use, maintain, and modify the predictive models created.
List of Tables
Table 3-1: One-hot encoding categorical variables into binary variables ... 42
Table 3-2: Representative use cases for model variants based on data selection... 47
Table 3-3: M achine learning m odels used. ... 48
Table 4-1: Model performance results predicting bioreactor end-point titer... 58
Table 4-2: Comparison of prediction errors for bioreactor end-point titers. ... 59
Table 4-3: Model performance results predicting bioreactor end-point SEC analysis... 62
Table 4-4: Comparison of prediction errors for bioreactor end-point SEC analysis. ... 63
This page intentionally left blank.
1 Introduction
"Data is the raw material of the Information Age." - Alec Ross
1.1 Background
With the recent advances in computational power and data availability, data analytics have become a vital tool for organizations to add value to their business. In this thesis, we explore the application of machine learning to deliver scientific insights and improve workflow processes in a critical pre-clinical process in the biotech industry. It is the author's hope that the methods outlined, algorithmic framework developed, and organization nuances highlighted provide awareness and tangible benefit for those that wish to adapt similar tools for their own business functions.
1.1.1 Biopharmaceutical Industry
The biotechnology industry is a broad area of biology that takes living systems to develop and ma useful products for a variety of medicinal, agricultural, and industrial needs. The biopharmaceutical industry combines application of knowledge from molecular biology, biomanufacturing, and chemical engineering disciplines to developing pharmaceutical products, transforming genes to useful drugs for patients.
As a subset of the greater pharmaceutical industry, the biopharmaceutical industry focuses on the manufacturing of biologics, which are large, complex molecules such as proteins derived
from living systems. The other class of drugs, termed "small-molecule" drugs, are synthesized by chemical means.
The biologics industry is experiencing rapid growth. As we better understand illnesses, healthcare needs develop accordingly. The global biopharmaceutical market is estimated to reach
$405 billion by 2024, with a compounded annual growth rate (CAGR) of 9.3%. [1]
1.1.2 Amgen
Amgen, Inc. is an American multinational biotechnology company founded in 1980 and headquartered in Thousand Oaks, CA. Comprised of nearly 20,000 staff worldwide, Amgen is committed to unlocking the potential of biology for patients suffering from serious illnesses by discovering, developing, and manufacturing human therapeutics. Amgen's 16 large and small-molecule products target cardiovascular disease, oncology, bone health, neuroscience, nephrology, and inflammation. By leveraging its differentiating competencies in innovative medicines, transformative research, and world-class biomanufacturing, Amgen actively develops a pipeline of medicines with breakaway potential.
The focus of this research is within Amgen's Process Development (PD) group, a component of the Operations organization, which bridges the Research and Development (R&D) and Commercial organizations. PD develops Amgen's products and the processes to make them. PD is further subdivided into several functions. This project mainly interacts with teams within Pre-Pivotal Drug Substance and Pre-Pivotal Attribute Science. The Pre-Pivotal Drug Substance team focuses on chemical and bioprocess development of the biologics or active pharmaceutical
ingredients within Amgen's pre-clinical product portfolio. Meanwhile, the Pre-Pivotal Attribute Science team defines favorable product quality characteristics and optimizes the development of analytical tools to guide the development of therapies before clinical trials. Figure 1-1 shows the organization of relevant teams within Amgen.
Drug Attribute
Substance Scences
U .PePvtlD
-PePvtlA
Figure 1-1: Relevant teams in process and organization structure within Amgen
1.1.3 Cell Line Development within the Biologics Pipeline
The general workflow process for the development of a biologic begins with R&D. In this phase a disease, or indication, is targeted if it represents an important unmet medical need and if the product may ultimately be commercially viable. Researchers determine the potential drug candidates based on a proper target product profile, which govern aspects such as safety, efficacy, and route of administration, among others. Ultimately, through a combination of in vitro research
and computational models, a specific molecule is chosen as the top drug candidate for the specific disease and target population.
After the top candidate is selected, the blueprint for the molecule is formalized into a gene. The gene of interest is inserted into an expression vector. Then, this expression vector is inserted into the host cell in a process called transfection. The cell can incorporate the gene of interest into its own production mechanisms upon successful transfection, eventually gaining the ability to produce the desired pharmaceutical product.
Because each cell has unique characteristics, the product produced by each cell varies slightly. It is desirable for a pharmaceutical company to produce drugs with consistently high titers and of high quality. Therefore, in a process called clone screening, or cell line selection, the most optimal cell line or clone is selected. This clone is then used for the Master Cell Bank (MCB) and serves as a homogeneous starting point for all future manufacturing, both clinical and commercial. Figure 1-2 details the clone screening process. Sections 1.1.4 and 1.1.5 explain the clone screening process in greater detail.
Transfection 4 Pool Selection 4 Amplification - Subcloning 4 Clone screening
e Non expressing cells i 1 *rV High expression
Transfection Selection Recovery Amplification
-Ir I
---0 MTX MTX /
""'-e '**"eeem:
f.Vt\s---
---Unamplified
PPool-
Pool M-teriPoolI Cell Banking: WCB and MCB creation 0111f Process *00 development
Large-scale screening Small-scale screening
...--.
Subcloning
--- --- -- --
--Figure 1-2: Cell line development process flow
1.1.4 Necessity for Clone Screening
Clone screening is an important process in cell line development. In process development for a biologic, it is desirable to produce drugs with consistently high titers and high quality for reasons related to both economy and safety. High concentrations, or titers, of the product help reduce the manufacturing footprint needed to generate desired production volumes, thereby saving both capital and operating expenses. High product quality ensures that a greater proportion of drugs are safe, efficacious, and usable.
In the context of cell line development, product quality attributes (PQA) are evaluated through assays conducted on the product of interest. These assays often include chromatographic
analysis, which is used to determine attributes such as degree of glycosylation and other factors such as the proportion of unusable proteins due to are truncations (clippings) or clumping (aggregates).
Ensuring a consistent product batch helps promote a more reliable pharmacokinetic and pharmacodynamic response in patients. [2] If a "pool" of heterogenous cells obtained after transfection is used to generate the product of interest, there may be many variants of the product generated. This is because during transfection, the gene of interest is integrated into candidate host cells in variable ways. For example, there may be differences in copy number (the number of integrated copies of the gene of interest) and other differentiating factors between cells' unique footprints. The manufacturing of the product of interest may also vary due to slight differences in each individual cell's internal machinery, including the nature of post-translational modifications.
[3] This variation is undesirable, especially considering the necessity to ultimately control for and
ensure a measured and safe response in the patient.
One measure within cell line development to control for product variability is the requirement for the MCB cell line to be "clonally derived." [2] This means the MCB shall contain cells derived from one common, single cell ancestor. This theoretically helps ensure there is homogeneity in the drug produced, though there are slight, inevitable differences due to natural
genetic variation through random mutation as cells divide. [4], [5] Therefore, the clone screening
process is important in delivering not only a productive starting material, but also a singular cell line that complies with the "clonally derived" requirement.
1.1.5 Clone Screening Process
Clone screening is a critical component of the overall cell line development workstream presented
in Figure 1-2. Figure 1-3 represents a schematic for the clone screening process. First, the pooled, heterogenous cells are sorted into single cell cultures through a process called fluorescence-activated cell sorting (FACS), which relies on flow cytometry. Second, these cells are allowed to recover to healthy and stable populations. Then, these clonally-derived cells are transferred to spin tubes, 24-well plates, or 96-deep well plates to be cultured in a 10-day fed batch process. In this process, different measures on cell growth and viability are taken, with boluses of nutrients added periodically. Typically, hundreds to thousands of these small-scale fed batch cultures are run in parallel. At the end of the 10-day culture, the cells are harvested for assays and analysis.
A
iAAAAA
Assays Assays 0AAAAAAA M*@@
e-AAAIAAA Analysis Analysis
AAAAAA
Small-Scale Fed Scaled-up Perfusion Winning Clone
Batch Bioreactors best PQA and titer
many clones top clones (n =I00s) (n =4)
Figure 1-3: Schematic of the clone screening process
By analyzing the growth and productivity characteristics of the clones in the small-scale
cultures, top clones (usually n = 4) are selected for scaled-up cultures. The scaled-up process is
beneficial because the it is more representative of the process used in clinical and commercial
manufacturing. The scaled-up process occurs through a 15-day culture in 3 - 5L perfusion
nutrients, thereby increasing overall productivity of the culture. [6], [7] There are more measured variables as well, such as daily and continuous process conditions and metabolite concentrations, for tighter control and monitoring. The list of measured and tested features is presented in the Appendix.
After the scaled-up perfusion bioreactor process, the media and product are collected and analyzed. Ultimately, the clone screening run that yielded the highest titers and exhibited the best
PQA is chosen as the best candidate clone. This winning clone becomes the MCB for all future
clinical and commercial manufacturing use.
1.2 Project Overview
The scope of our project is focused within the Drug Substance Technologies Group (DST) in Process Development (PD) at Amgen Thousand Oaks, California. This group is responsible for manufacturing cell lines and bioprocess development for Amgen's entire biologics pipeline. The selection of the host cell line is a critical first step in ensuring manufacturing success for Amgen's clinical and commercial programs and its ability to effectively serve patients.
The procedures for screening and selecting cell lines have not significantly evolved in the past decade and rely on lengthy and manual data collection and analysis through spreadsheets to select the final cell line. In this project, we wish to transform the process of cell line development
(CLD) and bioprocess development (BD) through the creation and application of predictive
models of cell line and bioprocess performance in clone selection. By leveraging data acquired from state-of-the-art technologies such as single cell analytics, nanofluidics, next-generation
sequencing, and perfusion bioreactors, we hope to build robust, machine learning-based models. We strive to use these models to reduce development timelines and resources while improving performance across Amgen's large molecule pipeline.
1.2.1 Project Motivation and Opportunity
The clone screening process is very resource-intensive, taking several months and requiring hundreds of assays and cell cultures. Furthermore, there lacks a standardized decision-making process to decide on the criteria for the winning clone. As the pace of biotechnology quickens and drug discovery business models emphasize the "fail fast, fail cheap" approach, there is increasingly more emphasis on processing additional molecules in the early-stage pipeline. [8] At Amgen, this represents a significant increase in required throughput per year for the Pre-Pivotal DST team.
On the other hand, while no two drug development programs are identical, the clone screening process itself is largely the same across different programs: measured parameters, tools, materials, and methodologies are mostly routine. Because similar attributes are used for the decision-making process, and because Amgen holds appreciable data across historical drug development programs, an opportunity arises for leveraging this historical data for a predictive analytics approach for clone screening.
1.2.2 Goals
The overall objective of this study is to leverage historical data and apply machine learning to create predictive models that can improve clone selection decision quality and have potential to
reduce resource utilization and cycle times for future programs. Figure 1-4 demonstrates an ambitious schematic for a future state clone screening workflow. Breaking this down, we seek to tackle the main gaps in the current state process.
Figure 1-4: Machine learning aims to improve clone quality and saves time and resources.
Selecting a more productive, higher quality clone
Currently, the data generation and decision-making process is linear and relies on a
"funnel" approach. In this approach, many clones are screened in small-scale cultures (n = 100s)
and are then filtered down to a few scaled-up cultures (n = 4), before scientists select a winning
clone. In the machine learning approach, we can expand the sample space by orders of magnitude. Instead of filtering down to only a few clones in scaled-up perfusion bioreactors due to resource constraints, we can utilize machine learning algorithms to instantaneously run scaled-up experiments in our virtual bioreactors, for each and every clone. Using our predictive models has the potential benefit of yielding a higher-producing or better-quality clone that would have otherwise been screened out through the traditional "funnel" approach. This is true because the small-scale results, while similar, are not completely representative of the scaled-up perfusion reactor results.
Reducing cycle time
In the current state, the process from host cell integration of the gene of interest to selecting the winning clone is time-consuming. Small-scale fed batch cultures take 10 days, while the scaled-up perfusion bioreactor runs take 15 days. Set-up and end-point analysis takes about two weeks per stage. Altogether, this consumes a couple months on the critical path, assuming there is no rework.
We aspire to exclusively use CLD data, gathered during and prior to the small-scale fed batch experiments and analysis, to feed our machine learning algorithms in order to virtually generate bioreactor end-point results. These in silico bioreactor runs would instantaneously generate predictions, negating the need for physical scaled-up perfusion bioreactors, thereby cutting one month off the critical path for each biologics program.
Reducing resource utilization
Through every program, ample amounts of data are collected before, during, and after experiments. While a lot of this data collection is automated, there is nevertheless substantial manual effort and resource demand. Furthermore, set-up times can take appreciable manpower. Using interpretable machine learning algorithms, we can leverage sparsity-inducing models that pinpoint the most important input features in generating our predictions. This is helpful when considering that in any given clone screening program, over 600 attributes are tracked. If our model can make reliable predictions by using just 10 input features, for example, we can theoretically avoid the measurement of the other 590 attributes.
Produce additional scientific insights
Furthermore, through data analytics on our aggregate historical program information, we can uncover additional relationships between measurements and desired prediction targets. This can generate novel scientific insight and spawn hypotheses for further investigation, perhaps leading to future bioprocess improvements.
Creating a standardized process
Organizationally, each drug candidate is developed by a dedicated drug substance team composed of scientists with biology, chemistry, and bioprocess development backgrounds. Because each drug candidate has a unique combination of modality, structure, and sequence characteristics, there is no set formula in deciding the most important factors in classifying a winning clone. This is one of the natural reasons why there is no standardized process for clone selection in the current state: product quality factors are weighted differently depending on program needs.
As Amgen introduces more molecules through its pipeline, there will be a greater demand on resources. Standardized decision-making frameworks will make the selection process more robust. While machine learning algorithms do not provide the whole answer, these tools can provide a standardized, resourceful snapshot of what may ultimately occur in the commercial and manufacturing environment. By grounding everyone with the same tools and methodologies, we can mitigate the chances for miscommunication and avoid inefficiencies due to information asymmetry.
1.2.3 Significance of Study
This study brings data analytics and machine learning approaches to a novel application in biotechnology. Conservatively, we present proof-of-concept rollout of our methodology, with acknowledgement that additional vetting may be needed for large-scale implementation across organizations. Optimistically, we foresee benefits that extend beyond our initial goals. The platform we create will be modular, which means we can effectively add on early-stage data (e.g. R&D) as well as late-stage data (e.g. bioprocess downstream purification train and manufacturing lots) to expand our scope in the future.
Broadly, we hope to spark awareness and a cultural proclivity to the value proposition of machine learning in the biotechnology.
1.2.4 Thesis Outline
The thesis is divided into six sections, including the (1) Introduction. In (2) Literature Review, we provide sources that shed more light on biotechnology and the cell line selection process. We also offer technical references for the machine learning approaches we use.
In (3) Research Methodology, we outline the process, from ideation to implementation of the predictive models created. We discuss how we found the relevant data, cleaned this data, and built the appropriate algorithms. We then detail our approach in refining our algorithm, as well as the design of the front-end application used. This section will be useful for those that wish to emulate a proof-of-concept approach in applying data analytics to their analogous problems.
The (4) Results discuss our model performance and their implications. This is followed by
(5) Implementation, which elaborates on model deployment on case studies. The implementation
section also outlines the project knowledge transfer process. In (6) Recommendations and Conclusions, we complete the thesis with discussions of successes, shortcomings, and recommendations for future work.
2 Literature Review
"Iff have seen
further
it is by standing on the shoulders of Giants."- Isaac Newton2.1 Cell Line Development
The Chinese Hamster Ovary (CHO) host has persisted for over two decades as the dominant platform for the industrial manufacturing of biologics. [9]-[11] Their adaptability and ease of genetic manipulation make CHO a suitable candidate for manufacturing complex recombinant proteins. [12]
The cell line development process using CHO cells is largely standardized and can be summarized in the following steps. [9]-[11], [13] The schematic of the process was presented in Figure 1-2.
1. Vector SYstem
Plasmid vectors are used to incorporate the gene(s) of interest. In addition to the expression cassette for the gene(s) of interest, the plasmid usually contains one or more selection marker cassettes, such as dihydrofolate reductase (DHFR) or glutamine synthetase (GS).
2. Transfection and selection
The plasmids are incorporated into the host cell through methods such as electroporation and sonication. The host cells are modified to be deficient of DHFR or GS, to match the selection marker on the expression vector. These enzymes are critical to cell metabolism and survival. The cells are placed in selection media, and only cells that successfully incorporate the plasmid will be able to survive.
3. Amplification
After transfection, cells are allowed to recover and stabilize before going through an amplification process. When DHFR is used as the selection mechanism, high levels of methotrexate (MTX), which attenuates DHFR activity, is added to the media. Therefore, only increased expression of DHFR through the amplification of plasmid copy number will allow the cell to survive. The genetic linkage between DHFR and the gene of interest ensure that they are co-amplified, thereby increasing the average productivity of our desired drug.
The amplification process is generally not used when GS is the selection marker, because high levels of expression are already achieved without it. [14]
4. Subcloning
To minimize heterogeneity in product quality, individual cells must be isolated to ensure cells are clonally derived. [2], [5] The separation of cells into monoclonal cultures traditionally involved limiting dilutions of the pooled colonies but is now usually done through FACS.
5. Clone screening
Diversity in the protein expression levels of different cell clones exceeds two orders of magnitude. [15] Clone screening is required to select the "best" cell line (clone) to be used for the MCB. This process usually involves the screening of hundreds of cell lines based on a variety of characters focused on product quality and productivity.
Screening is conducted through multiple rounds of cell cultures and analysis, as the top candidates are narrowed down in successively scaled-up volumes that resemble more and more
the commercial manufacturing process. At Amgen, the first round of selection occurs in spin tubes
or deep well plates, in 1 - 20 ml volumes. These cultures are conducted using fed-batch methods,
where boluses of nutrients are added to the batch culture periodically to promote higher cell densities and greater productivity. [6], [15] The top clone candidates are chosen through analysis on culture performance, productivity, and product quality. A second round of screening is then conducted in perfusion bioreactors. These bioreactors utilize an alternate tangential flow (ATF) filtration process to selectively exchange nutrients and waste, and resemble more closely the
clinical and commercial manufacturing process. [7]
Through this process, much greater cell density and consequent product concentrations can
be achieved. Previously, viable cell density (VCD) typically peaked at 3x10⁶ cells/mL, with titers
reaching 100 mg/L. Now, cultures can be run for longer durations with higher cell densities, and
final product titers in the 1 - 5+ g/L range are regularly encountered. [12]
6. Cell banking
The top clone is selected based on analysis on clone performance in the perfusion bioreactor. The starting material for the top clone is expanded using several rounds of passaging, then frozen down to become the MCB. Working cell banks (WCBs) are taken from this MCB for all future clinical and commercial manufacturing. The whole process, from beginning to end, can last 20- 30 weeks. [13]
7. Other cell line development and bioprocess development activities
The CLD and BD teams perform diverse functions supplementing the clone screening process. For example, preliminary process characterization may be conducted by running
bioreactor cultures at select upstream and downstream process conditions. Note, the upstream bioprocess refers to the growth of cells until harvest, while the downstream bioprocess refers to the purification and processing of the product of interest to meet quality requirements. The generated product of interest may also be used as material for toxicology studies.
2.2 Data Analytics in Biotechnology
Cell processes have been modeled extensively for several decades, assisting users in simulation, control, and optimization. [16] Many of these methods require substantial development time and require a high knowledge level of biochemical processes. In the data-rich environment of bioprocess development, modeling using statistical methods rather than first-principles or empirical approaches may yield confirmatory or novel insights. As computational power and data availability rapidly rise, machine learning has become increasingly useful in generating predictions in biopharmaceutical production.
Data-driven predictive models in biomanufacturing have been explored extensively.
[17]-[19] Particularly, Severson et al. evaluated predictions of titers and product quality across various
production batches, focusing on machine learning methods that promote model interpretability, simplicity, and accuracy. [20] We utilize similar evaluation criteria in selecting our machine learning methods.
In Section 3, we discuss, contextualize, and cite sources for each of the underlying techniques used within our application. Overall, The Elements of Statistical Learning and the scikitlearn library provide great explanations on the techniques used in our study. [21], [22]
3
Research Methodology
"All my life I've been searching for something."- Foo Fighters
3.1 Contextualization
The first step of our research approach was to understand the problem. Before selecting the tools and theorizing potential solutions, we considered the organizational factors, personnel, and resources.
From a business level, we aimed to streamline and dematerialize the process by conducting fewer experiments. Similarly, we also aimed to improve the reliability of the process, by providing additional analytical insight through our predictive models. Overall, we hoped to generate a superior clone, with improved titers and quality.
To achieve this, we needed to answer two practical questions: (1) How will a particular clone perform in the scaled-up perfusion bioreactor (without actually conducting the bioreactor screen), and (2) what attributes affect product titer and quality the most? By focusing our scope toward answering these two questions, we could better adapt our analysis methods to deliver the proposed business value, as shown in Figure 3-1.
L/*0 +
Process questions Analysis Methods Potential Business Value
How will this clone perform in the Classification and Virtual experimentation: bioreactor? Regression algorithms reduce wet lab work required What attributes affect product titer Feature Importance Plots, Increase decision quality and scientific
and quality the most? Regularization insight
Figure 3-1: Business context of the scope of work
3.1.1 First-principles vs. Statistical Approach
While many models in the field of bioprocess development are mechanistic and based on first-principles, we attempted to develop data-driven predictive models. This was driven by organizational preference to prototype a working product within the duration of six months. Furthermore, the available quantity and quality of data across Amgen's historical clone screening programs qualified data-driven modeling as an appropriate approach for our application.
3.1.2 Data Description
Our project used historical data generated from various clone screening runs. These clone screens included small-scale fed batch data from cell line development (CLD) as well as scaled-up perfusion bioreactor data from the bioprocess development upstream (BDU) group.
In total, our relevant dataset consisted of clone screening runs from 16 Amgen historical programs. Because the data needed to have corresponding small-scale fed batch and scaled-up perfusion bioreactor data, most of the relevant data was comprised of top clones, as usually only these candidates were passed on to the scaled-up perfusion bioreactor. Conversely, this meant that the hundreds of small-scale experiments that did not have scaled-up data were not included in our
dataset for the purpose of our analysis.
The fact that the data consisted mostly of assumed top clones raised potential issues of sampling bias. While this was a valid concern, the evaluation of two factors allowed us to continue with the analysis.
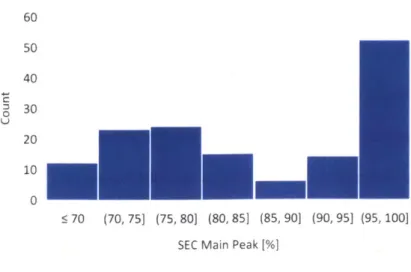
First, we concluded that the distribution of our historical data sufficiently contained observations reflective of the greater population of interest. We acknowledge that simply comparing the distributions of observed covariates is insufficient to ensure external validity, as we would also need an untestable assumption about whether any important lurking variables exist. Nevertheless, our team felt representativeness was satisfied because our subject matter experts did not identify any potential lurking variables omitted from the data set. Figure 3-2 and Figure 3-3 shows the histograms representing the spreads of two predictor variables.
Secondly, in the current state, teams predict large-scale performance oftentimes through univariate correlation from corresponding small-scale fed batch growth data, such as mapping
CLD end-point titers to BDU end-point titers. However, these one-to-one mappings do not
generate as accurate predictions as a multivariate analysis, the comparisons for which are outlined in Section 4.1. Therefore, creating a multivariate, data-driven model utilizing the available data would improve upon the current state methods for predicting scaled-up performance results.
60 50 40 30 20 10 5 0.5 (0.5, 1] (1, 1.5] (1.5, 21 (2, 2.5] (2.5, 31 > 3 Titers (scaled)
60 50 40 0 30 20 100 : 70 (70, 75] (75, 80] (80, 85] (85, 90] (90, 95] (95, 100]
SEC Main Peak [%]
Figure 3-3: Spread of bioreactor end-point SEC main peak profiles
The raw data was collected and grouped in two master datasets, the CLD dataset and the
BDU dataset. The CLD dataset contained the cell line characteristics data and the small-scale
experiment data. The magnitude of raw data in CLD was on the order of 0(103). The BDU dataset
contained the scaled-up bioreactor data, where more data was collected per run. This magnitude
of raw data in BDU was on the order of 0(104). Figure 3-4 outlines the structure of our dataset.
155-1 1 Merged Raw Dataframe
-C --lone CLD BDU Bioreactor
Nam- Duplicate Duplicate MTX End-Point
NaeID ID Titer
155-Bioprocess Development Upstream (BDU)
BDU Bioreactor Bioreactor Bioreactor
Duplicate Lactate Lactate ... End-Point.. 155
,Nm 1 2
NaeID Day 0 Day I Titer
155 - 1""".
300+ Raw Features
Figure 3-4: Dataframe structure. CLD and BDU data are separately stored and assigned to process owners on each team. The two datasets were merged using FULL JOIN. Of note, explanatory variables (x's) and predictor variables (y's) are stored in the same dataframe,
allowing for customized slicing of prediction combinations.
Often, the same clone would be run in duplicates in the small-scale fed batch. The same clone starting material, if chosen for scaled-up perfusion bioreactors, would often be run in duplicates as well. We performed a FULL JOIN of corresponding runs to construct our merged dataframe. FULL JOIN was performed to account for the variability between experiment sets with the same starting material. Thus, a clone that had two separate small-scale runs and two separate
large-scale separate runs, would result in four observations (n = 4) in the combined dataframe, for
example. While this risked biasing our datasets toward clones that have more duplicates (e.g. a clone with triplicate small-scale runs and triplicate large-scale runs would generate nine observations in our combined dataframe), this was not a large concern since most of our clones had at most two runs each in the small-scale and scaled-up conditions.
35
Final Dataframe
In our final dataframe, each row corresponded to a particular clone, containing cell line characteristics, small-scale fed batch growth data, scaled-up perfusion bioreactor growth data, and attribute science data. Our dataframe contained both categorical data, such as media type or modality, as well as numerical data, such as metabolite concentrations and titer measurements. For small-scale fed batch data, growth factors such as viability, VCD, and glucose concentrations were collected periodically across the 10-day culture. Each attribute corresponded to a column in our dataframe. For scaled-up perfusion bioreactor data, these attributes and additional features such as
pH and dissolved oxygen concentrations were collected daily and recorded in the experimental
feature set. Attribute science data included product titers and other analytic results from assays like size exclusion chromatography (SEC) and cation exchange chromatography (CEX) analysis.
In total, our combined dataframe contained over 300 observations with over 300 raw attributes. The master datasheets were stored in Excel as a multi-index datasheet, which would provide easier pivoting utilizing Pandas. [23] For a complete list of raw features, please reference
the Appendix.
3.2 Data Collection
The data collection process was effort-intensive and required both data querying from the enterprise data lake (EDL) as well as manual data collection.
Data querying
from
Data LakeData was queried using SQL on the Hue (Apache Hadoop User Experience) interface. This interface leveraged Cloudera Impala connections to the EDL. Relevant data resided on several data tables linking to the corporate electronic lab notebook. Due to an IT transition at Amgen preceding our study, the electronic lab notebook included only data imported from recent experiments. A non-standardized data entry process and the presence of many free-text fields made data querying difficult. Oftentimes, significant data cleaning, verification, and reconciliation of data from multiple experiments was required after initial querying, due to non-homogeneities in the database. These difficulties in querying and data cleaning prompted a shift in the data collection strategy, and the majority of relevant data was instead compiled from individual users' excel workbooks.
Data
from
Excel spreadsheetsWhile most relevant data were available in Excel, high stakeholder engagement was required to determine the location, relevance, and nuances of each dataset. This manual data collection process was effort-intensive, requiring meetings with project owners and scientist across the organization. In the end, more than 95% of the resulting dataframe contained data originally found through legacy Excel files of varying formats. This data was extracted and combined using a combination of manual excel data cleaning and Pandas-enabled Python scripts.
3.3 Preprocessing and Feature Engineering
After initial data collection, data preprocessing was necessary to manipulate the data into a usable format for ingestion by the machine learning algorithms.
3.3.1 Heterogeneity of Data
The aggregated data lacked standardization of measured parameters. Because each experiment was run by a unique team of scientists who had objectives specific to that project, not all features were uniformly collected across different experiments.
Two examples illustrate this point. For the small-scale experiments, some project teams would collect glucose concentrations at timepoints Day 0, Day 3, Day 6, Day 8, and Day 10. Glucose data was used to provide insights on cell metabolism and was a factor in determining top candidate clones. For other teams that prioritized other aspects of cell growth, such as viability and
VCD, glucose concentrations would not be collected.
The use of analytical chromatography tests also varied by project. Some projects revolved around products that are glycosylated. For these studies, characterizing post-translational modifications was essential in clone evaluation. Methods such as hydrophilic-interaction chromatography (HILIC) were used to properly assess the glycan profile for product batches. [24] For other programs, glycosylation was not a large factor, and therefore HILIC data was not collected.
Broadly, every program necessitated a largely unique set of chromatographic analyses, dependent on product modality, business objectives, and operating team. These analyses included size exclusion chromatography (SEC), cation exchange chromatography (CEX), reduced- and
data heterogeneity, a structured and scalable imputation strategy was required, as discussed in Section 3.3.3.
There was also a lack of standardization with assay and measurement protocols across geographic regions. We exercised discretion on a case-by-case basis when considering whether, for example, a titer result using different protocols by different people would be considered the same feature. Ultimately, most of these cases were deemed acceptable and the attributes measured
by different machines were merged as a common feature. This reconciliation of heterogenous data
into homogenous feature sets allowed denser data representation, minimizing the need for imputation using best-guess values. However, this merging method does increase the risk of masking experimental variability.
3.3.2 Treatment of Outliers and Data Errors
Data cleaning also required the treatment of outliers and errors in data. For example, a malfunctioning probe can read 0 mmHg dissolved oxygen, which is erroneous given context. Non-sensical data was manually removed and replaced with blanks, to be replaced with imputed values. Automated outlier detection methods were explored, but all non-obvious errors and naturally occurring outliers in the dataset were kept.
3.3.3 Imputation Strategy for Missing Values
Our dataset was sparse due to data heterogeneity. The BDU dataframe was only 45% filled, while
the CLD dataframe was 60% filled. This proportion of missing data necessitated a robust imputation strategy to fill in missing data.
The two main sources of missing data were (1) randomly missing data by instrumentation error and (2) missing data due to user non-measurement. This latter class of missing data was caused by users not measuring certain parameters (such as glucose, SEC LMW%, etc.) due to individual preferences. Upon investigation, there were no systematic biases from this non-measurement, as one missing covariate did not signal there were other factors that caused the dataset to be invalid. Therefore, both sources of missing data were classified as missing at random (MAR). As missing one specific covariate does not mean there is something wrong with other reasons. Due to this assumption, we decided to treat all missing values under a uniform strategy, one that would introduce minimum bias.
For features that had more than 30% missing data, we decided that imputation would be unreliable. Therefore, features (columns) with more than 30% missing data were deleted. This threshold percentage is a heuristic based on internal interviews on imputation strategies on similar datasets. This threshold is adjustable in our algorithm; adjustments on a feature-by-feature basis may be preferred for a more rigorous analysis in the future, or when new features are included in the dataset without corresponding historical data. Though previous studies have shown that up to
80 - 95% missing data have been successfully imputed without introducing bias through methods such as multiple imputation, this tradeoff should be evaluated contextually. [28], [29]
We did not automatically delete clone observations (rows) regardless of the proportion of missing data. This is because each row was already validated during the construction of the dataframe and was deemed to contain sufficient data.
After sparse columns were deleted, we utilized k-nearest neighbors (KNN) to fill in missing values in the remaining columns. [30] Imputation through educated guesses of missing values helped preserve statistical power in our dataset. [31] While multiple imputation methods were most effective in minimizing bias, we opted for singleton imputation to prevent the over-augmentation of our dataset, preserving manipulability. Furthermore, KNN was practically implementable compared to multiple imputation, and had advantages over mean and median imputation methods that attenuated variance. Lastly, while KNN-imputation may introduce slight bias toward existing values, we felt our initial elimination of sparsely-filled (< 70%) columns limited such bias. A value of k = 3 was used in the final KNN-imputation algorithm to balance between over- and under-fitting.
3.3.4 Data Exploration
Once the raw dataframe was constructed, an iterative effort of performing univariate analysis on relating small-scale performance with corresponding scaled-up perfusion bioreactors performance helped make sense of the data. Preliminary prediction algorithms utilizing classification and regression trees (CART) also helped map important features and determine additional feature engineering needs, as discussed in Sections 3.3.5.
Previous work by Perpetua et al. utilized PLS and clustering algorithms on a related, smaller dataset. Perpetua noted a positive relationship between specific productivity and titers between small-scale and scaled-up cultures. [32] Clones were also found to cluster according to modalities. For example, characteristics of monoclonal antibodies related more with those of other monoclonal antibodies, rather than with characteristics of other modalities, like bispecifics such as bispecific format A (bfA) and bispecific format B (bfA). While unsupervised machine learning methods were not explicitly used in our study, these results and related discussions with involved team members helped prioritize what features to study and partition during the design of our algorithmic framework, as discussed in Section 3.4.
3.3.5 Feature Extraction
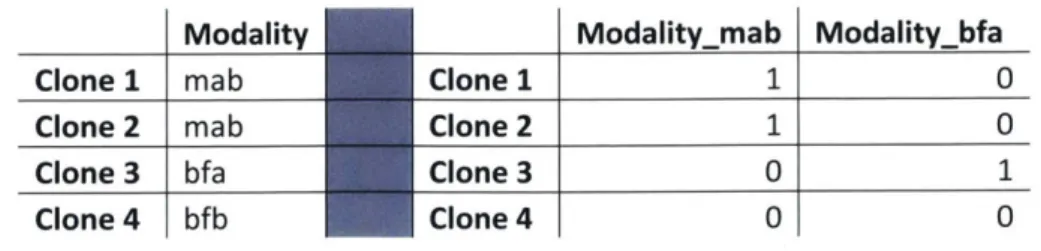
After compilation of the raw dataset, we performed two additional feature engineering steps to improve our dataframe for machine learning ingestion. The first technique involved the transformation of categorical variables into numerical variables. This was necessary because the regression algorithms we used required numerical features as inputs. We utilized one-hot encoding to accomplish this, transforming one categorical feature with n possible variables in its domain into n-I features with a binary domain, as shown in Table 3-1. [21]
Table 3-1: One-hot encoding categorical variables into binary variables
Modality Modalitymab Modalitybfa
Clone 1 mab Clone 1 1 0
Clone 2 mab Clone 2 1 0
Clone 3 bfa Clone 3 0 1
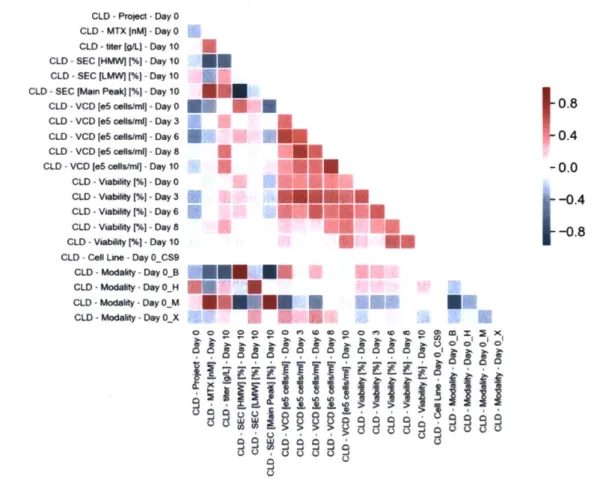
The second aspect of feature engineering involved the derivation of new features calculated from existing features, a technique that can improve model performance. This type of feature engineering was helpful considering the longitudinal nature of our data. Because our data contained 10-day fed batch and 15-day scaled-up perfusion bioreactor growth data, there were clear time-series interdependencies between related features. This is visually apparent based on
the correlation matrix as shown in Figure 3-5. We wanted to extract features that can explain
aspects of time dependency that the raw features alone cannot.
CLW -Project -Day 0
CLD -MTX [nM] -Day 0 CLD -liter (giL) -Day 10 CLD -SEC [HMW[%- Day 10
CLD -SEC [LMWM (%) -Day 10 CLD -SEC [Mam Peak D[%-Dy 10 CLW -VCD 1*6 co i]" -Day 0
CLD -VCD [46 cetshn -Day 3 CLD -VCD 1e6 ostni -Day 6U
CLD -VCD [eS oaetsl] - Day 8
CLD -VCD [e5 calIs/ni4 -Day 10
CLD -Viability [%)- Day 0
CLD -Viability[% -Day3
CLD - Viability [%I -Day 6
CLD -Viability [%) -Day 8
CLD -Viability (%) -Day 10
CLD -Cal Line -Day 0_CS9
CLD - Modally -Day 0_B CLD - Modality - Day 0_H CLD -Modality -Day O_M CLD - Modaliy -Day 0.X 0
U
Eu
U
UEu
U.
EU. A-U...
*~ 119.
U
EU
E.~
*~i
I..
mum
5. o a n e o e 0 ('~ 0 0'liiii Jill
~2222~
S 0 0.8 0.4 -0.0 .-0.4 -0.8 Emx W ~ zXFigure 3-5: Correlation matrix for select CLD features. Notice the strong correlation between
VCD between time points, as well as viability between time points. It is advantageous to extract
features that capture this correlation.
There were several ways to capture time-series correlations. For one, convolutional neural networks can be used, as convolution allows for detection of spatially local correlation, which may account for temporal dependencies. [33] Another idea was to utilize APIs such as tsfresh, which automatically extracts summary statistics from temporal data. [34] Ultimately, Python scripts were written to extract the necessary summary statistics from the data. This included minimum, maximum, minimum_day, maximumday values for metabolite and process conditions. Other calculated values included integrated VCD (iVCD), which accounted for the total cell*days in the reactor, and specific productivity (qp), which accounted for production on a cellular basis, in pg/cell/day.
3.3.6 Feature Selection
The modified dataframe, after feature extraction, contained over 600 attributes. With over 300
observations and 600 attributes, we faced a high feature, low observation scenario (p > n). To aid
interpretability and avoid overfitting, we undertook methods to reduce the number of features in the final output. Features could be reduced in all three stages in the algorithmic design, with the inputs to the model, with the outputs from the model, and with the model itself. We discuss feature selection prior to our machine learning pipeline in this section, while model feature selection and output feature selection are outlined in Sections 3.4 and 3.5, respectively.
We explored different algorithms during the development phase to look at feature selection prior to algorithmic design. These included techniques such as variance thresholding, principal component analysis (PCA), mutual infornation regression, ANOVA, and eliminating features
with high covariance. [21] While these techniques helped eliminate unimportant features, they did not yield measurable performance improvement when combined with model feature selection and output feature selection. Since these unsupervised feature filtering techniques did improve on the algorithmic framework discussed in Section 3.4, we did not utilize these methods in our final implementation.
3.4 Algorithmic Framework Design
For any supervised machine learning regression algorithm, we wish to find a function
f
that bestmaps our data x to a prediction '. This mapping should minimize the error e between the prediction
y
and future data y *. This is represented in Equation 3-1 below. Furthermore, minimizing thismodel error against training data is insufficient; ideally, we want the model to accurate when it is exposed to new data. In our study, we wanted to construct machine learning algorithms that could take in earlier-experiment data to generate predictions of end-point results for new programs.
min E[(f (xi) - y*)] (3 - 1)
i
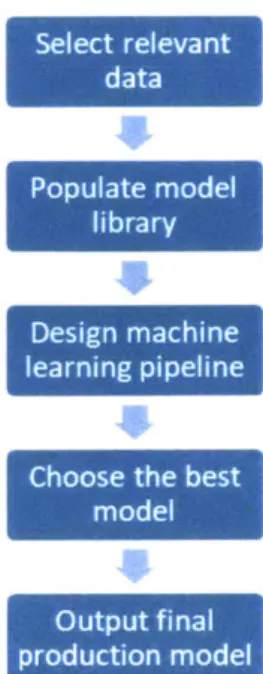
Another project objective was to design an algorithm that was modular and flexible for future additivity. Furthermore, the ability for our models to yield interpretable results that could help answer the "Why?" regarding our predictions was paramount. Once we completed preprocessing and feature engineering, we had a dataframe ready for ingestion into our machine learning pipeline. Creating this machine learning pipeline to generate our desired prediction outputs followed the steps shown in Figure 3-6. We detail these steps in the subsections below. The full model generation algorithm is outlined in the Appendix.
Design machine learning pipeline
Choose the best model
Output f inal
production model
Figure 3-6: Model generation flowchart following our algorithmic framework
3.4.1 Selecting Relevant Data
Our initial target variables y for the project were bioreactor end-point titer and SEC analysis results. These data selections were chosen for this study because these predictions would provide the most useful insights. SEC analysis results and titer predictions were primary assessors of product quality and productivity, respectively, for a clone.
The explanatory dataframe x could also be sliced by modality and dataset. Modality was the most important factor in explaining our predictor variables, as discovered through clustering algorithms and classification through CART methods. Finally, analyzing model performance by exclusively CLD data allowed for the evaluation of whether early-experiment data can be used by itself to generate accurate bioreactor end-point predictions. On the other hand, using the aggregate