HAL Id: hal-02404351
https://hal.uca.fr/hal-02404351
Submitted on 11 Dec 2019
HAL is a multi-disciplinary open access archive for the deposit and dissemination of sci-entific research documents, whether they are pub-lished or not. The documents may come from teaching and research institutions in France or abroad, or from public or private research centers.
L’archive ouverte pluridisciplinaire HAL, est destinée au dépôt et à la diffusion de documents scientifiques de niveau recherche, publiés ou non, émanant des établissements d’enseignement et de recherche français ou étrangers, des laboratoires publics ou privés.
To cite this version:
Xochilt Gutiérrez, Federica Schiavi, Hans Keppler. The adsorption of HCl on volcanic ash. Earth and Planetary Science Letters, Elsevier, 2016, 438, pp.66-74. �10.1016/j.epsl.2016.01.019�. �hal-02404351�
2
Xochilt Gutierrez, Federica Schiavi, and Hans Keppler*
3 4
Bayerisches Geoinstitut, Universität Bayreuth, 95440 Bayreuth, Germany 5
*Corresponding author: hans.keppler@uni-bayreuth.de 6
7
Abstract. Understanding the interaction between volcanic gases and ash is important
8
to derive gas compositions from ash leachates and to constrain the environmental 9
impact of eruptions. Volcanic HCl could potentially damage the ozone layer, but it is 10
unclear what fraction of HCl actually reaches the stratosphere. The adsorption of HCl 11
on volcanic ash was therefore studied from -76 to + 150 ˚C to simulate the behavior 12
of HCl in the dilute parts of a volcanic plume. Finely ground synthetic glasses of 13
andesitic, dacitic, and rhyolitic composition as well as a natural obsidian from 14
Vulcano (Italy) served as proxies for fresh natural ash. HCl adsorption is an 15
irreversible process and appears to increase with the total alkali content of the glass. 16
Adsorption kinetics follow a first order law with rate constants of 2.13 . 10-6 s-1 to 17
1.80 . 10-4 s-1 in the temperature range investigated. For dacitic composition, the 18
temperature and pressure dependence of adsorption can be described by the equation 19
ln c = 1.26 + 0.27 ln p -715.3/T, where c is the surface concentration of adsorbed HCl 20
in mg/m2, T is temperature in Kelvin, and p is the partial pressure of HCl in mbar. A 21
comparison of this model with a large data set for the composition of volcanic ash 22
suggests that adsorption of HCl from the gas phase at relatively low temperatures can 23
quantitatively account for the majority of the observed Cl concentrations. The model 24
implies that adsorption of HCl on ash increases with temperature, probably because of 25
the increasing number of accessible adsorption sites. This temperature dependence is 26
opposite to that observed for SO2, so that HCl and SO2 are fractionated by the
27
adsorption process and the fractionation factor changes by four orders of magnitude 28
over a temperature range of 250 K. The assumption of equal adsorption of different 29
species is therefore not appropriate for deriving volcanic gas compositions from 30
analyses of adsorbates on ash. However, with the experimental data provided here, the 31
gas compositions in equilibrium with the ash surfaces can be calculated. In particular, 32
for dacitic composition, the molar ratio of S/Cl adsorbed to the ash surface is related 33
to the molar S/Cl ratio in the gas phase according to the equation ln (S/Cl)adsorbed =
34
2855 T-1 + 0.28 ln (S/Cl)gas – 11.14. Our data also show that adsorption on ash will
35
significantly reduce the fraction of HCl reaching the stratosphere, only if the initial 36
HCl content in the volcanic gas is low (< 1 mole %). For higher initial HCl 37
concentrations, adsorption on ash has only a minor effect. While HCl scavenging by 38
hydrometeors may remove a considerable fraction of HCl from the eruption column, 39
recent models suggest that this process is much less efficient than previously thought. 40
Our experimental data therefore support the idea that the HCl loading from major 41
explosive eruptions may indeed cause severe depletions of stratospheric ozone. 42
43
Keywords: Adsorption, ash, hydrogen chloride, volcanic gases, ozone
44 45
1. Introduction
46
The short-term climatic impact of volcanic eruptions is mostly due to the interaction 47
of sulfur and halogen species in volcanic gases with the atmosphere. The surface 48
cooling observed after major explosive eruptions is caused by the injection of sulfur 49
dioxide into the stratosphere, where it is photochemically oxidized to sulfate aerosols. 50
These aerosols backscatter sunlight and may remain in the stratosphere for months or 51
even years (e.g. McCormick et al. 1995, Robock 2000). Ozone destruction is another 52
potential effect of large explosive eruptions, but it is much less understood than the 53
surface cooling effect. Black et al. (2014) suggested that the end-Permian mass 54
extinction partially resulted from ozone depletion associated with the Sibirian Trap 55
magmatism. Measurable depletions in stratospheric ozone were observed after the 56
1991 Mt. Pinatubo eruption (Brasseur and Granier 1992, Solomon et al. 1998). They 57
were attributed to the catalytic effect of sulfate aerosol surfaces, which may enhance 58
the concentration of active chlorine species involved in ozone destruction (Solomon et 59
al. 1993, Hofmann et al. 1994). However, another mechanism could be the direct 60
injection of volcanic hydrogen chloride (HCl) into the stratosphere. A study by 61
Tabazadeh and Turco (1993) suggested that this mechanism is inefficient, because 62
hydrogen chloride would be nearly completely washed out of the eruption column by 63
condensing water. More recent models of eruption plumes (Textor et al. 2003), 64
however, show that most of the water in the plume is present as solid ice, which 65
greatly reduces the efficiency of HCl scavenging. Moreover, most of the ice particles 66
are lifted upwards, so that more than 25 % of the HCl originally contained in the 67
plume may reach the stratosphere. This prediction was confirmed for the case of a 68
high-latitude eruption by direct sampling of a volcanic cloud from Hekla volcano 69
(Rose et al. 2006, Millard et al. 2006). Spectroscopic observations also suggested an 70
increase of 40 % in the total column of HCl above 12 km altitude after the 1982 El 71
Chicón eruption (Mankin and Coffey 1984, see also Woods et al. 1985), while at most 72
a slight increase in stratospheric HCl was observed after the 1991 Mt. Pinatubo 73
eruption (Mankin et al. 1992, Wallace and Livingston 1992). Kutterolf et al. (2013) 74
estimated the Cl and Br release from 14 large explosive eruptions in Nicaragua in the 75
last 70 00 years and concluded that most of these eruptions likely caused significant 76
ozone destruction in the stratosphere. On the other hand, elevated HCl concentrations 77
are only rarely detected in ice cores; this may, however, be due to the volatilization of 78
HCl in the presence of H2SO4 (Wagnon et al., 1999, Zdanowicz et al. 1999, Thamban
79
et al. 2006). The limited data available may imply that the stratospheric HCl yield of 80
eruptions varies considerably, depending on initial gas composition and on the 81
processes occurring in the eruption column. 82
83
Hydrogen chloride (HCl) concentrations in volcanic gases typically range from < 0.05 84
to > 5 mole %, with most data probably in the 0.1 to 1 mole % range (Symonds et al. 85
1994, Fischer 2008). Relatively high HCl concentrations and HCl/SO2 ratios are often
86
found in arc volcanoes. Estimated annual fluxes of HCl vary widely, from 0.4 to 170 87
Tg/a (Symonds et al. 1988, Halmer et al. 2002). Pyle and Mather (2009) used a 88
compilation of measured HCl/SO2 ratios and total SO2 fluxes to estimate the HCl flux
89
from arc volcanoes at 4.3 ± 1 Tg/a, which is believed to dominate the global flux. 90
However, the flux of HCl reaching the stratosphere is certainly much lower, because 91
only large eruptions penetrate the tropopause and processes in the eruption column 92
may deplete HCl. While the depletion by water and ice has already been investigated 93
in some detail, little is known about the possible effect of HCl adsorption on volcanic 94
ash (Rose 1977). Ayris et al. (2014) studied the interaction of HCl with ash under 95
near-vent, high-temperature conditions (200 - 800 ˚C). Only for alkali-rich tephrite 96
and phonolite glasses, reaction with HCl to NaCl was observed, but not for dacite and 97
rhyolite. The very short residence time of ash at near-vent conditions during an 98
explosive eruption may further limit the extent of adsorption at high temperature. This 99
suggests that HCl adsorption, if it is an important process at all, must occur in the 100
low-temperature portion of the dilute plume. We therefore studied the adsorption of 101
HCl on ashes of rhyolitic, dacitic, and andesitic composition from -76 to + 150 ˚C at 102
variable HCl partial pressures covering the plausible conditions in a dilute volcanic 103 plume. 104 105 2. Experimental methods 106
Fe-free synthetic glasses of rhyolitic, dacitic, and andesitic composition were used as 107
proxies for fresh volcanic ash. The glasses were prepared from homogenized, 108
stoichiometric mixtures of analytical grade SiO2, Al(OH)3, MgO, CaCO3, Na2CO3,
109
and K2CO3. After decarbonation in a platinum crucible, the charge was melted at
110
1600 ˚C for 1 hour and quenched in deionized water, yielding a clear glass with some 111
bubbles. Microprobe analyses are given in Table 1. The glass was then dried and 112
ground four times for seven minutes each in a planetary mill. No liquid was added to 113
avoid adsorption on fresh surfaces. The surface area of the powders was determined 114
with a Quantachrome instrument by measuring the BET adsorption isotherm of 115
krypton at 77 K. To constrain the isotherm, seven data points were measured in a 116
range of pressures ranging from 5 to 30 % of the condensation pressure of Kr. 100 – 117
200 mg of sample were outgassed at 200 ˚C for 24 hours before the measurement. 118
The specific surfaces obtained were in the range of 1.5 – 4.9 m2/g. These numbers are 119
quite comparable to those obtained for fine (< 100 m) natural ash (mostly 1.1 – 2.1 120
m2/g for a sieved fraction < 100 m; Demelle et al. 2005; 4.3 m2/g for 121
phreatomagmatic ash from Eyafjallajökull; Gislason et al. 2011). 122
123
Adsorption measurements were carried out in a glass apparatus equipped with a 124
Vacuubrand DVR 5 pressure gauge, following the procedure described by Schmauss 125
and Keppler (2014). In brief, 30 – 50 g of the sample powder were placed in a sample 126
tube and the entire system was evacuated. HCl gas was then filled into a reservoir 127
flask up to the desired pressure. Once the valve between the sample tube and the 128
reservoir was opened, an instantaneous pressure drop occurred due to the expansion 129
of the gas into the sample tube, followed by a slow decrease in pressure due to the 130
adsorption of HCl on the sample surface. From the known volumes of the system, the 131
measured pressure drop and the temperature, the amount of adsorbed HCl can be 132
calculated. All required formulae are given by Schmauss and Keppler (2014). For 133
calculating the amount of adsorbed HCl, the ideal gas law was used, which is a very 134
good approximation for HCl under the low pressures and the temperatures of interest. 135
Once the pressure in the system had stabilized, the valve between sample and gas 136
reservoir was closed and the pressure in the reservoir was increased. After opening 137
the valve again, the next point of the adsorption isotherm was measured. This 138
procedure was repeated until the pressure in the system reached nearly one bar. 139
Desorption experiments started from close to one bar by decreasing the pressure in the 140
reservoir with a vacuum pump. After opening the valve to the sample, pressure first 141
increased, due to expansion of the gas from the sample tube to the reservoir, followed 142
by a slow increase due to desorption of HCl from the sample surface. After pressure 143
stabilized, the valve between reservoir and sample was closed and the procedure was 144
repeated, until the pressure in the reservoir was close to zero mbar. Measuring an 145
entire adsorption and desorption cycle for a sample took several weeks. Experiments 146
at 150 ˚C were carried out by immersing the sample tube in an oil bath; for 147
experiments at – 76 ˚C, the sample tube was cooled with a mixture of dry ice and 148
acetone. Main sources of error in the surface concentrations are the specific surfaces 149
of the powders, the pressures, and the volumes in the system. 150
151
Wet chemical analyses were carried out in order to confirm the measured HCl surface 152
concentrations. About 10 g of HCl-loaded glass sample were mixed with 100 ml of 153
distilled water and stirred for 24 hours in a closed Erlenmeyer flask. The solution was 154
then filtered off and some NaHCO3 added to adjust to neutral pH. Chloride was then
155
determined by titrating against a 0.1 N AgNO3 solution with Ag2CrO4 as endpoint
156
indicator (Mohr method). Surface concentrations (in mg/m2) were then obtained by 157
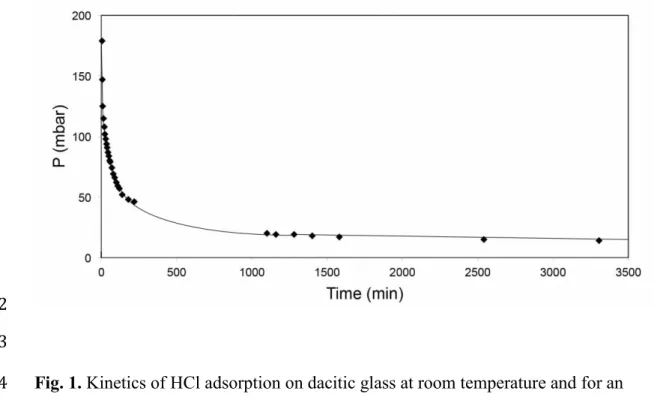
dividing the mass of measured HCl by the surface area of the sample according to the 158 BET data. 159 160 3. Results 161 162 3.1. Kinetics of adsorption 163
Figure 1 shows the experimentally observed decrease of pressure during an adsorption 164
experiment. For every adsorption step, the data can be described by an equation 165
166
(p – peq) = (p0 – peq) e-t (1)
167 168
where p is pressure, peq is the equilibrium pressure, and p0 is the initial pressure after
169
opening the valve between gas reservoir and sample; is the rate constant and t is 170
time. Values of peq and of were obtained by fitting equation (1) to the data for every
171
adsorption step. Since in the ideal gas law, pressure is proportional to the number of 172
moles in the gas phase, (p – peq) is proportional to the number of gas atoms n that still
173
will be absorbed and (p0 – peq) is proportional to the initial number of gas atoms n0
that ultimately will end up on the sample surface. The above equation (1) is therefore 175
equivalent to a first-order-law of reaction kinetics 176
177
n = n0 e-t (2)
178 179
with the same rate constant as in equation (1). 180
181
Experimentally determined rate constants are compiled in Table 2; measured values 182
for range from 2.13 . 10-6 s-1 to 1.80 . 10-4 s-1. The timescale for reaching 183
equilibrium is in the order of magnitude of the inverse of these rate constants. For 184
dacite at room temperature, a clear decrease of with the initial gas pressure of the 185
adsorption experiment is observed. This may be related to the fact that in the 186
experiments at higher pressure, the most reactive surface sites had already been 187
saturated with HCl in the previous steps of the adsorption experiment. In other words, 188
with increasing surface coverage of the sample, the rate of adsorption decreases. This 189
effect is not so clearly seen for the other samples. Interestingly, the rate constants for 190
HCl adsorption on dacite at -76 ˚C are in most cases higher than at room temperature. 191
This is unexpected, as reaction rates should generally increase with temperature. 192
However, as will be discussed below, only the most reactive surface sites seem to be 193
accessible for HCl adsorption at – 76 ˚C, and this higher reactivity probably also 194
translates into higher rate constants. Desorption experiments also followed a first-195
order-kinetics, with rate constants similar to those for adsorption on the same sample. 196
However, only very little desorption was generally observed and therefore, desorption 197
kinetics will not be further discussed. 198
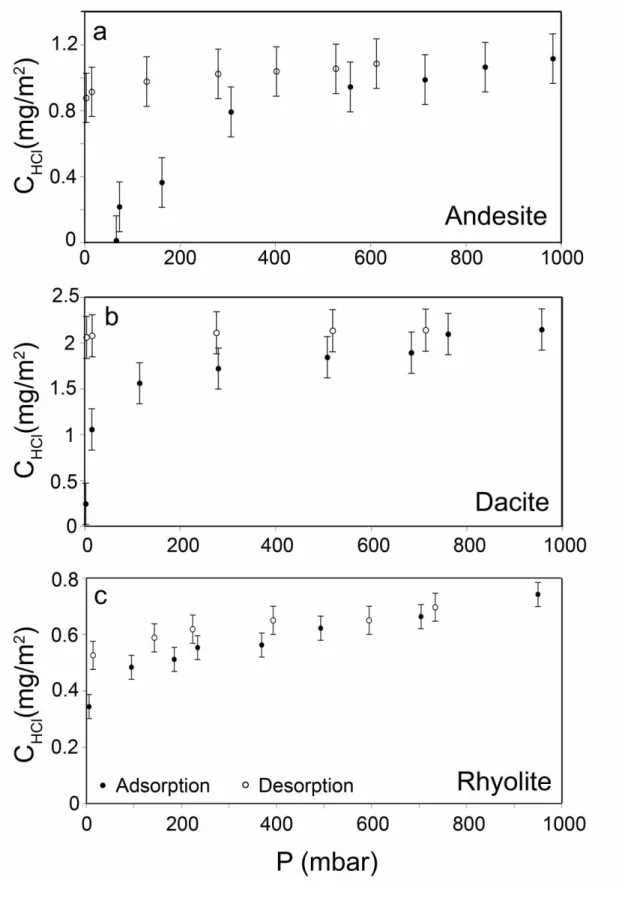
3.2. Adsorption isotherms
200
Adsorption and desorption isotherms of HCl for andesitic, dacitic and rhyolitic 201
glasses are shown in Figure 2. With increasing pressure, the amount of HCl adsorbed 202
on the surface first increases sharply and then levels off and reaches a plateau. This 203
behavior corresponds to a type I adsorption isotherm in the Brunauer classification 204
(Brunauer et al. 1940), which is typical for a chemisorption process, where the 205
adsorbed molecule forms strong chemical bonds with the substrate. Above about 500 206
mbar, there is a slight further increase in surface concentration that may indicate 207
minor multilayer adsorption. 208
209
The desorption isotherms show that the adsorption process is nearly irreversible, i. e. 210
the surface concentration of HCl remains nearly constant when pressure is decreased 211
to zero mbar. This behavior is again consistent with a chemisorption process 212
involving the formation of strong chemical bonds between HCl and the substrate. The 213
HCl surface concentration observed for andesitic and rhyolitic glasses are rather 214
similar, while those for the dacite glass are 2 to 3 times higher. Inspection of Table 1 215
shows that this effect cannot be due to the SiO2, Al2O3, CaO or MgO contents of the
216
glass, since the percentage of these components in the dacite glass is between that for 217
rhyolite and andesite. However, the total alkali (Na2O + K2O) content of the dacite is
218
significantly higher than for the other two compositions. Since the alkalis are the 219
strongest bases in the system, it is plausible that they enhance the reaction with the 220
acidic HCl molecule. This is consistent with the enhanced reactivity of alkali-rich 221
glasses with HCl vapor at high-temperature, near vent conditions (Ayris et al. 2014). 222
Note, however, that the alkali contents of the synthetic glasses used for this study are 223
not necessarily representative of a global average of rhyolite or dacite compositions 224
and individual rhyolites may very well have higher total alkalis than some dacites. 225
226
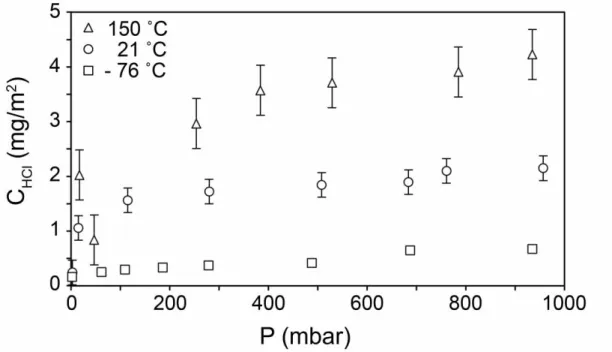
The temperature dependence of HCl adsorption was explored for dacite, by carrying 227
out additional experiments at -76 ˚C and at 150 ˚C. The results are shown in Figure 3. 228
Adsorption increases with temperature, probably because at low temperature 229
adsorption occurs only on some particularly reactive sites, with the number of 230
available sites increasing with temperature. This is a typical behavior sometimes 231
observed for chemisorption, where the formation of chemical bonds requires some 232
activation energy that can only be overcome above a certain temperature (e.g. Batzill 233
2006, Duran-Munoz et al. 2013). 234
235
The surface concentrations of HCl remaining on the samples after the end of the 236
desorption experiments, as derived from the measurements of the isotherms, were 237
checked by argentometric titration of leachate solutions, with generally good 238
agreement (Supplementary Table S1). Only the dacite sample from the experiment at 239
room temperature may have lost some HCl by handling on humid air before the 240
argentometric analysis. For the comparison, the surface concentrations were 241
converted into wt. % using the specific surfaces given in Table 1. 242
243
3.3. A regression model for the adsorption of HCl on dacite glass
244
Schmauss and Keppler (2014) showed that the temperature and pressure dependence 245
of the adsorption of SO2 on volcanic ash may be described by a modified Freundlich
246
isotherm 247
ln c = A T-1 + B ln p + C (3) 249
250
where c is the surface concentration in mg/m2, T is temperature in K and p is the 251
partial pressure of the absorbed gas in mbar. A least squares fit of all the experimental 252
data for HCl adsorption on dacite glass using the same equation yielded A = -715.3 ± 253
55.3, B = 0.27 ± 0.03, and C = 1.26 ± 0.29, with R2 = 0.93. A comparison of 254
measured and predicted surface concentrations of HCl is shown in Figure 4. 255
256
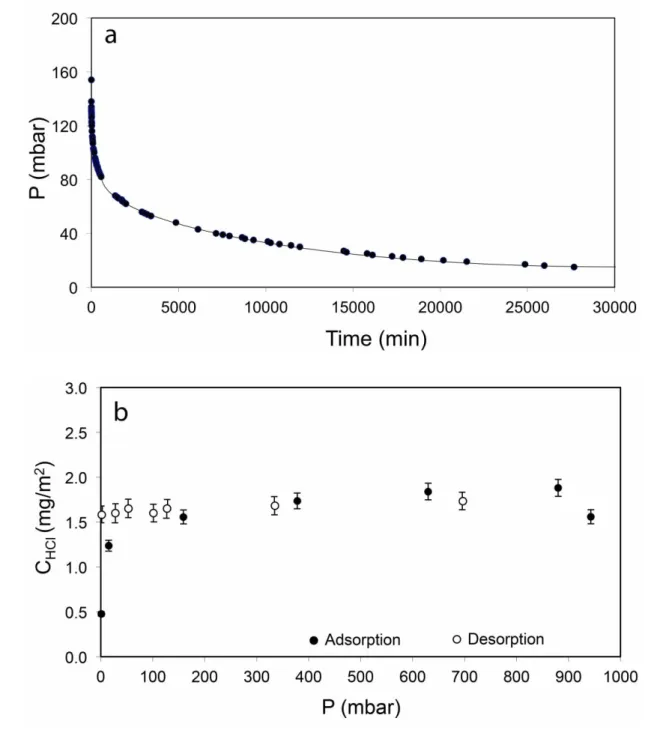
3.4. HCl adsorption on a natural obsidian sample
257
In order to test whether the adsorption data obtained by using synthetic samples are 258
also applicable to natural, Fe-bearing volcanic glasses, we also measured the 259
adsorption of HCl on a natural alkali-rhyolitic obsidian from the 1739 AD eruption of 260
Vulcano (Aeolian Islands, Italy; see Table1). This obsidian contains a small fraction 261
of feldspar microlites. In adsorption experiments at room temperature, both the 262
kinetics of adsorption and the adsorption isotherm were found to be quite similar to 263
the synthetic glasses (Fig. 5). The HCl surface concentrations observed for the 264
Vulcano obsidian are somewhat higher than for the synthetic rhyolite and resemble 265
more those for synthetic dacite (Fig. 2). This is, however, entirely consistent with the 266
elevated bulk alkali content in this sample, supporting the idea that this is the primary 267
compositional parameter influencing HCl adsorption. 268 269 270 4. Discussion 271 272
4.1. Applicability of the experimental data to adsorption in volcanic plumes
The experiments in the present study were carried out in the presence of HCl alone, 274
while in the volcanic plume, H2O is usually the most abundant component, together
275
with smaller amounts of SO2, HCl and traces of other gases. CO2 may be an abundant
276
species as well, but since the CO2 molecule lacks a permanent dipole moment, its
277
absorption on surfaces can likely be ignored. The much more important question is 278
therefore, whether the data obtained in the present study may be applied to the 279
situation in a volcanic plume, where HCl is a minor component compared to H2O.
280
Very likely this is possible, because the glass powders used in the experiments 281
described here were exposed to air of average humidity at ambient conditions during 282
the preparation of the experiments. Both studies on synthetic silicate glasses and of 283
volcanic ashes show that under ambient conditions and also in a volcanic plume, the 284
surface of a glass particle will be covered with a complete layer of adsorbed H2O
285
molecules (Razouk and Salem 1948, Delmelle et al. 2005). Accordingly, there should 286
be no difference in HCl surface concentration between the glass powders studied here 287
in pure HCl alone and the adsorption of HCl on ash in the volcanic plume. 288
Dissolution of HCl gas in liquid water adhering to ash particles is a separate effect, 289
which will be discussed below. 290
291
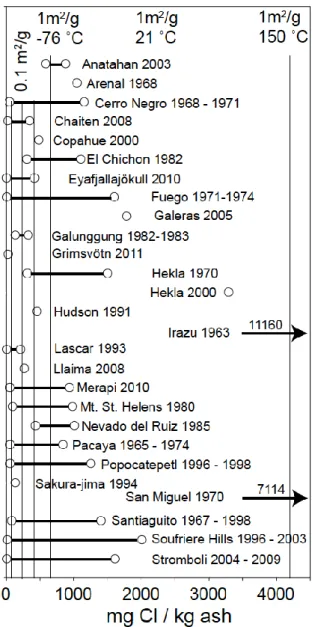
Figure 6 compares Cl concentrations adsorbed on the surface of volcanic ashes from 292
more than 40 individual eruptions with the experimental data for dacite glass obtained 293
in this study. To convert surface concentrations (in mg/m2) into bulk concentrations 294
(mg Cl / kg ash), the specific surface area of the ash has to be assumed. Figure 6 295
shows predicted maximum bulk concentrations (vertical lines) for two different 296
specific surfaces of 1 m2/g, which is at the low end of this parameter for fine ash 297
(Demelle et al. 2005; Gislason et al. 2011) and 0.1 m2/g, more characteristic for 298
coarser ash (see supplementary Table S2 for examples). The vertical lines in Figure 6 299
give maximum concentrations achievable at a given specific surface and temperature 300
at high HCl partial pressures. However, inspection of Figure 3 shows that similar 301
concentrations may already be reached at low HCl partial pressures (10 - 100 mbar) 302
realistic for a volcanic plume. Figure 6 shows that adsorption of HCl from the gas 303
phase can account for the vast majority of the observed Cl concentrations. Only the 304
data for Irazu and San Miguel appear anomalously high, but they could still be 305
explained by surface adsorption if the specific surface of these ashes were higher, in 306
the order of 2 – 4 m2/g, within the range confirmed by measurements on fine ashes 307
(Demelle et al. 2005; Gislason et al. 2011). More likely, however, theses ashes 308
contain Cl from some other source, e.g. from hydrothermal alteration. Alteration 309
processes may also have contributed some Cl to other samples. The data shown in 310
Figure 6 are completely consistent with earlier experimental results for fluorine. 311
Oskarsson (1980) already concluded that the fluorine concentrations adsorbed on ash 312
may be explained by adsorption from the gas phase at relatively low temperatures 313
near 200 ˚C. 314
315
In a volcanic plume, ash may interact with aerosols or become coated by films of 316
liquid water or ice. Rose (1977) suggested that the accumulation of aerosol particles, 317
particularly of H2SO4 is a main source for adsorbed material on ash. However, H2SO4
318
aerosols are usually only a minor species, subordinate to SO2 in volcanic plumes close
319
to the vent (e.g. Mather et al. 2006). Delmelle et al. (2007; see also Gislason et al. 320
2011) detected Cl and S on the surface of ash particles by X-ray photoelectron 321
spectroscopy, but not by SEM. They concluded that Cl and S form coatings with a 322
thickness of a few nm at most; they further suggested that this observation together 323
with the observed surface depletion in Na, K, Mg, and Ca argues against the 324
deposition of material via aerosols, but is more consistent with precipitation from a 325
liquid film. However, their data are equally consistent with our model of direct 326
adsorption from a gas phase, since the shape of the adsorption isotherms indeed 327
suggests the formation of a mono-molecular layer of HCl on the ash surface. Coating 328
of ash particles by water certainly occurs in some parts of the plume, but this process 329
is reversible. Once the water evaporates, the dissolved HCl and SO2 will also be lost,
330
unless some surface reaction has occurred. However, if the surface is in equilibrium 331
with the liquid film and the liquid is in equilibrium with a gas phase, then the surface 332
is also in direct equilibrium with the gas. In other words, this process should lead to 333
the same surface concentration as observed in our experiments. The fact that surface 334
reactions, but not the solubility in liquid water determine the origin of leachable 335
material on ash surfaces is also supported by the observation of a systematic offset 336
between S/Cl ratios adsorbed on ash and S/Cl ratios in rainwater (Edmonds et al., 337
2003). If the relative solubility of SO2 and HCl in liquid water somehow determined
338
the S/Cl ratio on the ash surface, this ratio should be the same as in rainwater that had 339
interacted with the plume. 340
341 342
4.2 Deriving volcanic gas compositions from adsorbate analyses
343
The analysis of volatile species adsorbed on fresh ash surfaces is a convenient and 344
frequently used method to infer volcanic gas compositions (e.g. Rose 1977, Williams 345
et al. 1986, Armienta et al. 1998, de Hoog et al. 2001, Armienta et al. 2010, Bagnato 346
et al. 2011, 2013). Usually, the implicit assumption is made that the concentration 347
ratio of adsorbed S, Cl, and F is somehow comparable to the molar ratio of the 348
corresponding species in the gas phase of the plume. Our experimental data, together 349
with published results for the adsorption of SO2 on volcanic ash (Schmauss and
350
Keppler, 2014) allow testing this assumption. The adsorption of HCl and SO2 can
351
likely be treated independently, without considering direct interactions, because the 352
concentration of these gases, particularly in the dilute part of the plume, is very low 353
and therefore, none of them will fully cover the glass surface. Moreover, the 354
experimental data of this study and of Schmauss and Keppler (2014) suggest that HCl 355
and SO2 actually react with different surface sites, since both the dependence of
356
adsorption on glass composition and on temperature are very different. For SO2, glass
357
composition has little influence on adsorption, while the total alkali content seems to 358
control the reactivity with HCl. HCl adsorption increases with temperature, while the 359
adsorption of SO2 decreases with temperature.
360 361
Schmauss and Keppler (2014) showed that SO2 adsorption on dacite glass can be
362
described by the equation 363
364
ln cSO2 = 2140 T-1 + 0.29 ln pSO2 – 9.32 (4)
365 366
while in the present study, we observed that HCl adsorption follows the equation 367
368
ln cHCl = - 715.3 T-1 + 0.27 ln pHCl + 1.26 (5)
369 370
In both equations, the coefficient in front of the ln p term is indistinguishable within 371
experimental error. If one assumes an average coefficient of 0.28, both equations can 372
be combined to 373
374
ln (cSO2/cHCl)adsorbed = 2855 T-1 + 0.28 ln (pSO2/pHCl) – 10.58 (6)
375 376
At the low pressures involved, the ratio of the partial pressures pSO2/pHCl is virtually
377
identical with the SO2/HCl molar ratio in the gas. To convert the ratio of surface
378
concentrations cSO2/cHCl, which are given in mg/m2, into a molar ratio of S/Cl, the
379
numbers have to be divided by the ratio of the molar masses of SO2 and HCl. This
380
adds a linear term of - ln (64.06/36.46) = - 0.56 to the equation, which then becomes: 381
382
ln (S/Cl)adsorbed = 2855 T-1 + 0.28 ln (S/Cl)gas – 11.14 (7)
383 384
where S/Cl now refers to the molar ratio in the gas and on the glass surface. 385
386
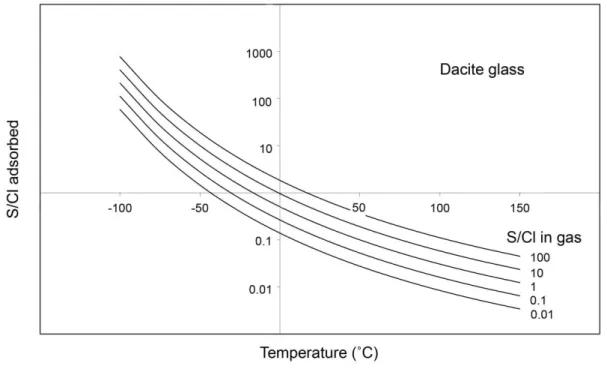
Figure 7 shows the ratio of S/Cl on dacitic ash surfaces, as predicted by equation 7 for 387
a range of temperatures and gas compositions. Obviously, the adsorbed S/Cl ratio is a 388
very strong function of temperature. In fact, the temperature effect is much stronger 389
than the effect of the S/Cl ratio in the gas. For example, near 0 ˚C, increasing the S/Cl 390
ratio in the gas by a factor of 10 has the same effect on the absorption as reducing 391
temperature by less than 20 ˚C. The relatively small effect of gas composition is due 392
to the factor of 0.28 in front of the ln (S/Cl)gas term in equation (7); it implies that
393
under otherwise equal conditions, (S/Cl) in the adsorbate only increases by a factor of 394
(S/Cl)gas0.28, i.e. a 10-fold increase in this ratio in the gas phase only translates into a
395
less than 2-fold increase in the adsorbate. The 0.28 exponent is related to the effect 396
seen in Figure 2 that the amount of adsorbed HCl first increases sharply at low pHCl,
397
but then levels off at higher pHCl. The strong effect of temperature on the adsorbed
S/Cl ratio is obviously related to the opposite temperature dependence for HCl and 399
SO2 adsorption. The decrease of adsorption with temperature for SO2 (Schmauss and
400
Keppler 2014) is the normal behavior expected for adsorption. This is because in the 401
expression for the Gibbs free energy G = H – TS for the adsorption reaction, the 402
–TS term increases with temperature and should therefore shift the equilibrium to 403
the side with higher entropy; the entropy of a molecular species is always higher in 404
the gas phase than adsorbed on a surface. The increase in HCl adsorption with 405
temperature is therefore very unusual, but this kind of behavior is sometimes observed 406
for chemisorption (e.g. Batzill 2006, Duran-Munoz et al. 2013), i.e. if the adsorption 407
process involves the formation of strong chemical bonds. In such a situation, an 408
activation energy may have to be overcome for the reaction, so that only a fraction of 409
sites is involved in the adsorption process at low temperature, while this fraction 410
increases at higher temperatures. Once all possible surface sites are activated, 411
adsorption should decrease upon further increase with temperature, because of the 412
thermodynamic argument mentioned above. Accordingly, the data presented here for 413
HCl adsorption and equation 7 should not be extrapolated to temperatures far above 414
those for which they were calibrated (i.e. beyond 150 ˚C). 415
416
The strong temperature effect on adsorption as shown in Figure 7 needs to be taken 417
into account whenever volcanic gas compositions are to be derived from analyses of 418
volatile species adsorbed on ash surfaces. This means that estimates of volcanic fluxes 419
of HCl that were obtained from SO2 flux measurements scaled by the S/Cl ratio in
420
adsorbates should be treated with considerable caution; the same may also apply to 421
other gas species. The frequently made assumption of equal adsorption of different 422
species is only valid under very specific conditions (see also Bagnato et al. 2011). For 423
example, Figure 7 shows that for a gas with an S/Cl ratio of 1, equal adsorption, 424
resulting in an S/Cl ratio of 1 also in the adsorbate, only occurs at a temperature near 425
– 20 ˚C. However, for an S/Cl ratio in the gas of 10, the temperature where no 426
fractionation occurs decreases to near – 50 ˚C. 427
428
The conclusions reached here on the strong effect of temperature on the fractionation 429
of SO2 and HCl during adsorption are actually quite consistent with a number of field
430
observations. S/Cl ratios of ashes vary widely, < 0.01 to > 100, and often by orders of 431
magnitude even within the same eruption (see Supplementary Table 2). This is likely 432
not only due to variations in gas composition, but also to the fractionation of S and Cl 433
between gas and ash. Edmonds et al. (2003) measured the SO2/HCl ratio of gases
434
from three eruption periods of the Soufrière Hills volcano on Montserrat between 435
1996 and 2002, using both open path infrared spectroscopy and the analysis of ash 436
leachates. For the phase I and phase II major dome building periods, a SO2/HCl molar
437
ratio near 0.1 was spectroscopically detected in the plume and ash analyses gave 438
similar (although more scattered) numbers. This is consistent with Figure 7, which 439
suggests that for an S/Cl ratio of 0.1, no fractionation occurs between ash and gas 440
phase near + 30 ˚C – a very plausible temperature for a low-altitude tropospheric 441
plume in a tropical climate. Bagnato et al. (2013) studied ash leachates of the 2010 442
Eyafjallajökull eruption on Iceland and found major discrepancies between the S/Cl 443
ratio adsorbed on ash surfaces and that measured in the volcanic gases. For the highly 444
explosive phase III eruption, S/Cl ratios from ash leachates are mostly between 0.4 445
and 0.6, while direct gas measurements yielded significantly higher molar S/Cl ratios 446
of 1.5 – 3.3. Inspection of Figure 7 suggests that these data may be reconciled by 447
assuming a temperature of adsorption near 0 ˚C, quite plausible for a tropospheric 448
plume during spring in Iceland. Note that these ash samples were taken at horizontal 449
distances from the vent up to more than 50 km, where the plume will have cooled 450
down to ambient atmospheric temperature; closer to the vent, larger variations in 451
adsorbed S/Cl ratio are observed, which may be related to variations in plume 452
temperature and also plume height (4 – 9 km; Petersen et al. 2012). Even larger 453
fractionations of S and Cl between ash and gas were observed for the basaltic fire 454
fountain phase; the S/Cl ratio in the gas was measured to be between 5 and 25 while a 455
molar ratio of S/Cl of 0.14 was measured on the ash. According to Figure 7, this could 456
imply equilibration between gas and ash at temperatures around + 50 ˚C, which is 457
plausible for a fire fountain eruption, as there may be very significant radiative 458
heating of particles after they left the vent and the plume likely entrained less ambient 459
air than for the highly explosive phase III. 460
461
In the previous discussion, we have referred to Figure 7, which is based on equation 7 462
and strictly valid only for a dacitic composition. Glass composition will have some 463
effect on the S/Cl fractionation, which needs to be considered. However, this effect is 464
much smaller than the variation due to temperature. For a given gas composition, 465
Figure 7 suggests variations in the ratio of adsorbed S and Cl by four orders of 466
magnitude over just 250 ˚C. Compared to this, the compositional effect on the amount 467
of adsorbed HCl (Fig. 2) is only about a factor of 2 and the effect of glass 468
composition on SO2 adsorption is even smaller (Schmauss and Kepper 2014).
469
Therefore, we believe that the conclusions derived from comparing the curves in 470
Figure 7 with ash leachate analyses are at least approximately correct, although 471
additional calibrations of the effect of ash composition on the S/Cl fractionation 472
between plume gas and ash surface are certainly desirable. In general, our discussion 473
shows that a large part of the apparent discrepancies between gas composition and the 474
composition of gas leachates can be accounted for by the effect of temperature on 475
adsorption. This does not rule out that other factors, in particular alteration processes 476
may also be important under some circumstances. However, for fresh, unaltered ash it 477
may indeed be possible to derive gas compositions from leachate analyses, if 478
reasonable estimates of plume temperature can be made. Moreover, on a local scale 479
close to a vent, the S/Cl ratio may actually provide a sensitive thermometer for the 480
temperature in the plume. 481
482
4.3. Stratospheric HCl yield and ozone depletion
483
With the experimental data on HCl adsorption obtained in this study, the fraction of 484
volcanic HCl reaching the stratosphere during Plinian eruptions can be better 485
constrained. As noted above, HCl adsorption increases with temperature, at least up to 486
150 ˚C. Accordingly, one may suspect that most of the adsorption may occur in the 487
relatively hot parts of the volcanic plume. However, ascent velocities in a typical 488
Plinian eruption column are > 100 m s-1 (Textor et al. 2006), implying that ash 489
particles reach the stratosphere within 1 – 2 minutes. This very much limits the time 490
available for high-temperature, near-vent interaction between volcanic gases and ash. 491
The highest rate constant for HCl adsorption measured in this study (Table 4) was 1.8 492
. 10-4 s-1. For a residence time of 120 s, this would allow only 2 % of the equilibrium
493
surface concentration to be adsorbed on the ash. Accordingly, it is likely that most of 494
the adsorption occurs in the dilute parts of the volcanic plumes after it has cooled 495
down to the ambient temperature at the respective altitude. 496
A rough estimate of the magnitude of HCl adsorption can be obtained by considering 498
the HCl surface concentration that would result from the (hypothetical) total 499
adsorption of all the HCl in the plume. This concentration is simply the ratio of the 500
total mass of HCl in the plume to the total available surface area of the ash. According 501
to Woods and Bursik (1991) fine ash with a grain size < 100 m accounts for > 50 wt. 502
% of total deposit for Plinian eruptions. Measurements of fine ash samples from 503
various volcanoes yielded specific surfaces of 1.1 – 2.1 m2 / g (Delmelle et al. 2005). 504
The ash is produced by the exsolution of gas bubbles, which ultimately disrupt and 505
fragment the melt. Subduction zone magmas that are responsible for the most 506
prominent explosive eruptions typically have pre-eruptive water contents near 5 wt. % 507
(e.g. Métrich and Wallace 2008). Water is also the main component of the gas plume, 508
with HCl concentrations ranging from < 0.05 to > 5 mole %, the majority of data 509
probably being in the 0.1 to 1 mole % range (Symonds et al. 1994, Fischer 2008). 510
These data from volcanic gases are in rough agreement with the Cl/ H2O ratio in melt
511
inclusions from primitive arc basalts (Métrich and Wallace 2008). If one therefore 512
assumed a mass ratio of volcanic gas to (glassy) ash of 0.05 (equivalent to 5 % H2O in
513
the pre-eruptive magma), 1 mole % HCl in the gas and a surface of 1 m2/g for the 514
total ash (or 50 % of fine ash with 2 m2/g), adsorbing all the HCl on the ash would 515
yield a surface concentration of 1.01 mg/m2. Comparing this number to the 516
experimental data in Figure 2 and 3 suggests that such surface concentrations may be 517
easily reached at room temperature or above; however, they may not be achievable at 518
the much lower temperatures prevailing in the stratosphere. The situation would be 519
very different, however, for an initial HCl concentration in the gas of 0.1 mole %; the 520
corresponding surface concentration of 0.10 mg/m2 is easily reached even at low 521
temperatures and at low HCl partial pressure. This rough calculation already shows 522
that the initial HCl concentration in the plume, which likely reflects the pre-eruptive 523
Cl/H2O ratio in the magma, largely controls the fraction of HCl sequestered by ash
524
and therefore, together with scavenging by hydrometeors, the effective stratospheric 525
HCl loading. 526
527
For a fully quantitative treatment of HCl adsorption, the equilibrium between the gas 528
phase and ash surface as described by equation (5) has to be considered together with 529
mass balance constraints under the conditions prevailing in the umbrella part of a 530
volcanic plume. For our calculations, we assume a plume model similar to that 531
described by Textor et al. (2006). The umbrella part of the plume is located at an 532
altitude near 20 km with a temperature around 220 K, containing about 100 g of ash 533
per kg of plume mixture. Assuming an initial gas mass fraction in the erupting 534
material of 5 wt. % (see above), this implies a dilution of volcanic gases by entrained 535
air by a factor of 200. The calculations are, however, rather insensitive to this dilution 536
factor, since according to equation (5), adsorption only increases with pHCl0.27, i.e. a
537
ten-fold increase in the dilution factor would only decrease adsorption by a factor of 538
1.9. For a volcanic gas with 1 mole % HCl, the partial pressure of HCl decreases from 539
10 mbar at the vent to 0.0022 mbar in the umbrella cloud by the combined effects of 540
the increasing altitude and dilution by entrained air. This number does not include 541
possible scavenging of HCl by hydrometeors (see Textor et al. 2003). Under the given 542
conditions, equation (5) predicts a concentration of HCl adsorbed on the surface of 543
ash of 0.026 mg/m2 in equilibrium with this HCl partial pressure, less than 3 % of the 544
1.01 mg/m2 required for total adsorption (see above). Since during the adsorption 545
process, the partial pressure of HCl in the gas decreases until equilibrium is reached, 546
the real number for the equilibrium surface concentration is slightly smaller. 547
Following the method described by Schmauss and Keppler (2014), one obtains 548
virtually the same value of 0.026 mg/m2. This number appears small, but the resulting 549
bulk Cl concentration (26-52 mg/kg for a specific surface of 1-2 m2/g) overlaps well 550
with the low end of concentrations reported for natural ashes (Fig. 6). Stratospheric 551
ash samples are likely under-represented in Figure 6, because many eruptions did not 552
reach the stratosphere and even for large eruptions, the ashes likely contain particles 553
that did not reach the stratosphere. For less explosive eruptions, particle velocities are 554
smaller and the plume may be less diluted by entrained air. Ash might therefore be 555
exposed to higher HCl partial pressures for longer times and at higher temperatures, 556
leading to stronger adsorption. This is a possible explanation for the fact that the 557
surface concentrations predicted for adsorption in the stratosphere are at the lower end 558
of the data for natural ash samples. However, the physical conditions for adsorption 559
likely vary considerably between individual eruptions and are influenced by 560
parameters such as the actual wind field that are hard to include in general models. 561
562
The calculation above clearly shows that for high initial HCl concentrations (> 1 563
mole %) in the gas phase of a Plinian eruption, adsorption by ash does not 564
significantly reduce the stratospheric HCl loading. However, the adsorption effect 565
becomes significant for low initial HCl concentrations. For example, for an initial 566
HCl content in the volcanic gas of 0.1 mole %, an equilibrium surface concentration 567
of 0.013 mg/m2 is obtained, 13 % of the value required for total absorption (see 568
above). The relationship between HCl content in the initial volcanic gas and the 569
adsorption on ash is illustrated in Figure 8. Physically, this relationship is due to the 570
fact that the total amount of HCl in the plume increases proportionally to the initial 571
HCl molar fraction and therefore the HCl partial pressure; however, the amount of 572
HCl adsorbed on ash only increases with pHCl0.27 so that at higher pHCl, the fraction of
573
HCl that is not removed by adsorption increases. In general, the efficiency of 574
adsorption on ash surfaces in dilute eruption plumes is much smaller for HCl than for 575
SO2 (Schmauss and Keppler 2014).
576 577
The pre-eruptive Cl contents and Cl/H2O ratios in subduction zone volcanics tend to
578
be high (Métrich and Wallace 2008, Kutterolf et al. 2013). Accordingly, HCl contents 579
in the fluid phase near 1 mole % and higher will be common for Plinian eruptions in 580
subduction zone settings. In such a situation, HCl adsorption on ash will not be able to 581
significantly reduce the amount of HCl reaching the stratosphere. Although there is 582
still much work to be done to understand these processes, previous studies (Textor et 583
al. 2003) have suggested limited efficiency of HCl scavenging by liquid water and by 584
ice in the eruption column, with more than 25 % of the total HCl reaching the 585
stratosphere. Our results therefore support the hypothesis that significant and perhaps 586
even catastrophic ozone depletion due to the HCl yield of giant eruptions is possible 587
(Kutterolf et al. 2013, Black et al. 2014). 588
589
5. Conclusions
590
The interaction of volcanic gases with ash particles could potentially limit the 591
environmental impact of explosive eruptions. We provide new experimental data on 592
the kinetics and thermodynamics of HCl adsorption on volcanic ash. Unlike for SO2,
593
HCl adsorption increases with temperature, so that large temperature-dependent 594
fractionations between HCl and SO2 occur during the adsorption process. Extracting
595
volcanic gas compositions from analyses of ash leachates therefore requires 596
correcting for this effect. Although HCl adsorption increases with temperature, the 597
slow rate of the process implies that most of the adsorption occurs in the cold, dilute 598
parts of a volcanic plume. For low initial HCl concentrations in the volcanic gas (0.1 599
mole % and below), the depletion of HCl by adsorption can be significant. However, 600
for HCl concentrations of 1 mole % and above, adsorption on ashes is unlikely to 601
reduce the stratospheric HCl yield of Plinian eruptions. Therefore, it appears quite 602
plausible that the HCl yield of large explosive eruptions may cause significant ozone 603
depletion in the stratosphere. 604
605
Acknowledgements
606
We would like to thank Gerti Gollner and Julia Huber for technical assistance in the 607
adsorption experiments and Lena Geiling for the determination of specific surfaces. 608
Constructive reviews by Tamsin Mather, Steffen Kutterolf and an anonymous referee 609
helped to improve the manuscript. 610
611
References
612
Armienta, M.A., Martin-Del-Pozzo, A. L., Espinasa, R., Cruz, O., Ceniceros, N., 613
Aguayo, A., Butron, M.A., 1998. Geochemistry of ash leachates during the 1994-614
1996 activity of Popocatépetl volcano. Appl. Geochem. 13, 841-850. 615
Armienta, M.A., de la Cruz-Reyna, S., Soler, A., Cruz, O., Ceniceros, N., Aguayo, A., 616
2010. Chemistry of ash-leachates to monitor volcanic activity: An application to 617
Popocatépetl volcano, central Mexico. Appl. Geochem. 25, 1198–1205. 618
Ayris, P.M., Delmelle, P., Cimarelli, C., Maters, E.C., Suzuki, Y.J., Dingwell, D.B., 619
2014. HCl uptake by volcanic ash in the high temperature eruption plume: 620
Mechanistic insights. Geochim. Cosmochim. Acta 144, 188-201. 621
Bagnato, E., Aiuppa, A., Andronico, D., Cristaldi, A., Liotta, M., Brusca, L., 622
Miraglia, L., 2011. Leachate analyses of volcanic ashes from Stromboli volcano: 623
A proxy for the volcanic gas plume composition? J. Geophys. Res. 116, D17204, 624
DOI: 10.1029/2010JD015512. 625
Bagnato, E., Aiuppa, A., Bertagnini, A., Bonadonna, C., Cioni, R., Pistolesi, M., 626
Pedone, M., Hoskuldson, A., 2013. Scavenging of sulphur, halogens and trace 627
metals by volcanic ash: The 2010 Eyjafjallajökull eruption. Geochim. 628
Cosmochim. Acta 103, 138-160. 629
Batzill, M., (2006) Surface science studies of gas sensing materials: SnO2. Sensors 6,
630
1345-1366. 631
Black, B.A., Lamarque, J.F., Shields, C.A., Elkins-Tanton, L.T., Kiehl, J.T., 2014. 632
Acid rain and ozone depletion from pulsed Siberian Traps magmatism. Geology 633
42, 67-70. 634
Brasseur, G., Granier, C., 1992. Mount Pinatubo aerosols, chlorofluorocarbons, and 635
ozone depletion. Science 257, 1239-1242. 636
Brunauer, S., Deming, L.S., Deming, W.E., Teller, E., 1940. On a theory of the van 637
der Waals adsorption of gases. J. Am. Chem. Soc. 62, 1723-1732. 638
de Hoog, J.C.M., Koetsier, G.W., Bronto, S., Sriwana, T., van Bergen, M.J. 2001. 639
Sulfur and chlorine degassing from primitive arc magmas: temporal changes 640
during the 1982-1983 eruptions of Galunggung (West Java, Indonesia). J. 641
Volcanol. Geothermal Res. 108, 55-83. 642
Delmelle, P., Villiéras, F., Pelletier, M., 2005. Surface area, porosity and water 643
adsorption properties of fine volcanic ash particles. Bull. Volcanol. 67, 160-169. 644
Delmelle, P., Lambert, M., Dufrêne, Y., Gerin, P., Óskarsson, N., 2007. Gas/aerosol– 645
ash interaction in volcanic plumes: New insights from surface analyses of fine 646
ash particles Earth Planet. Sci. Lett. 259, 159–170. 647
Duran-Munoz, F., Romero-Ibarra, I., Pfeiffer, H. (2013) Analysis of the CO2
648
chemisorption reaction mechanism in lithium oxosilicate (Li8SiO6): a new option
649
for high-temperature CO2 capture. J. Materials Chem. A 1, 3919-3925.
650
Edmonds, E., Oppenheimer, C., Pyle, D.M., Herd, R.A., 2003. Rainwater and ash 651
leachate analysis as proxies for plume chemistry at Soufrière Hills volcano, 652
Montserrat. In: Oppenheimer, C., Pyle, D.M., Barclay, J. (eds) Volcanic 653
Degassing. Geological Society, London, Special Publications 213, 203-218. 654
Fischer, T. P., 2008. Fluxes of volatiles (H2O, CO2, N2, Cl, F) from arc volcanoes.
655
Geochem. J. 42, 21-38. 656
Gislason, S. R., Hassenkam, T., Nedel, S., Bovet, N., Eiriksdottir, E. S., Alfredsson, 657
H. A., Hem, C. P., Balogh, Z. I., Dideriksen, K., Oskarsson, N., Sigfusson, B., 658
Larsen, G., Stipp, S. L. S., 2011. Characterization of Eyjafjallajökull volcanic 659
ash particles and a protocol for rapid risk assessment. Proc Nat. Acad. Sci. USA 660
108, 7307-7312. 661
Halmer, M.M., Schmincke, H.U., Graf, H.F., 2002. The annual volcanic gas input into 662
the atmosphere, in particular into the stratosphere: a global data set for the past 663
100 years. J. Volcanol. Geothermal Res. 115: 511-528 664
Hofmann, D.J., Oltmans, S.J., Komhyr, W.D., Harris, J.M., Lathrop, J.A., Langford, 665
A.O., Deshler, T., Johnson, B.J., Torres, A., Matthews, W.A., 1994. Ozone loss 666
in the lower stratosphere over the United States in 1992 – 1993: Evidence for 667
heterogeneous chemistry on the Pinatubo aerosol. Geophys. Res. Lett. 21, 65-68. 668
Kutterolf, S., Hansteen, T.H., Appel, K., Freundt, A., Krüger, K., Pérez, W., 669
Wehrmann, H. 2013. Combined bromine and chlorine release from large 670
explosive volcanic eruptions: A threat to stratospheric ozone? Geology 41, 707-671
710. 672
Mankin, W.G., Coffey, M.T., 1984. Increased stratospheric hydrogen chloride in the 673
El Chicon cloud. Science 226, 170-172. 674
Mankin, W.G., Coffey, M.T., Goldman, A., 1992. Airborne observations of SO2, HCl,
675
and O3 in the stratospheric plume of the Pinatubo volcano in July 1991. Geophys.
676
Res. Lett. 19, 179-182. 677
Mather, T.A., McCabe, J.R., Rai, V.K., Thiemens, M.H., Pyle, D.M., Heaton, T.H.E., 678
Sloane, H.J., Fern, G.R., 2006. Oxygen and sulfur isotopic composition of 679
volcanic sulfate aerosol at the point of emission. J. Geophys. Res. 111, Article 680
Number: D18205, DOI: 10.1029/2005JD006584 681
McCormick, M.P., Thomason, L.W., Trepte, C.R., 1995. Atmospheric effects of the 682
Mt Pinatubo eruption. Nature 373: 399-404. 683
Métrich, N., Wallace, P.J., 2008. Volatile abundances in basaltic magmas and their 684
degassing paths tracked by melt inclusions. Rev. Mineral. Geochem. 69, 363-402. 685
Millard, G. A., Mather, T. A., Pyle, D. M., Rose, W. I., Thornton, B., 2006. Halogen 686
emissions from a small volcanic eruption: Modeling the peak concentrations, 687
dispersion, and volcanically induced ozone loss in the stratosphere. Geophys. 688
Res. Lett., 33, Article number L19815, doi:10.1029/2006GL026959. 689
Oskarsson, N., 1980. The interaction between volcanic gases and tephra: fluorine 690
adhering to tephra of the 1970 Hekla eruption. J. Volcanol. Geoth. Res. 8, 251– 691
266. 692
Petersen, G.N., Bjornsson, H., Arason, P., 2012. The impact of the atmosphere on the 693
Eyjafjallajökull 2010 eruption plume. J. Geophys. Res. Atmospheres 117, DOI: 694
10.1029/2011JD016762. 695
Pyle, D.M., Mather, T.A., 2009. Halogens in igneous processes and their fluxes to the 696
atmosphere and oceans from volcanic activity: A review. Chem. Geology 263, 697
110-121. 698
Razouk, R.I., Salem, A.S., 1948. The adsorption of water vapor on glass surfaces. J. 699
Phys. Chem. 52, 1208–1227. 700
Robock, A., 2000. Volcanic eruptions and climate. Rev. Geophys. 38, 191-219. 701
Rose, W.I., 1977. Scavenging of volcanic aerosols by ash: Atmospheric and 702
volcanologic implications. Geology 5, 621-624 703
Rose, W.I., Millard, G.A., Mather, T.A., Hunton, D.E. Anderson, B., Oppenheimer, 704
C., Thornton, B.F., Gerlach, T.M., Viggiano, A.A., Kondo, Y., Miller, T.M., 705
Ballenthin, J.O., 2006. Atmospheric chemistry of a 33–34 hour old volcanic 706
cloud from Hekla Volcano (Iceland): Insights from direct sampling and the 707
application of chemical box modeling. J. Geophys. Res. 111, article number 708
D20206, doi:10.1029/2005JD006872. 709
Schmauss, D., Keppler, H., 2014. Adsorption of sulfur dioxide on volcanic ashes. 710
Am. Mineral. 99, 1085–1094. 711
Solomon, S., Sanders, R.W., Garcia, R.R., Keys, J.G., 1993. Increased chlorine 712
dioxide over Antarctica caused by volcanic aerosols from Mount Pinatubo. 713
Nature 363: 245-248. 714
Solomon, S., Portmann, R.W., Garcia, R.R., Randel, W., Wu, F., Nagatani, R., 715
Gleason, J., Thomason, L., Poole, L.R., McCormick, M.P., 1998. Ozone 716
depletion at mid-latitudes: Coupling of volcanic aerosols and temperature 717
variability to anthropogenic chlorine. Geophys. Res. Lett. 25, 1871-1874. 718
Symonds, R.B., Rose, W.I., Reed, M.H., 1988. Contributions of Cl- and F-bearing 719
gases to the atmosphere by volcanoes. Nature 334, 415-418. 720
Symonds, R.B., Rose, W.I., Bluth, G.J.S., Gerlach, T.M., 1994. Volcanic-gas studies: 721
Methods, results, and applications. Rev. Mineral. 30, 1-66. 722
Tabazadeh, A., Turco, R.P., 1993. Stratospheric chlorine injection by volcanic 723
eruptions: HCl scavenging and implications for ozone. Science, 260, 1082–1086. 724
Textor, C., Graf, H.F., Herzog, M., Oberhuber, J.M., 2003. Injection of gases into the 725
stratosphere by explosive volcanic eruptions. J. Geophys. Res. 108, Article 726
number 4606, doi:10.1029/2002JD002987. 727
Textor, C., Graf, H.F., Herzog, M., Oberhuber, J.M., Rose, W.I., Ernst, G.G.J., 2006. 728
Volcanic particle aggregation in explosive eruption columns. Part II: Numerical 729
experiments. J. Volcanol. Geothermal Res. 150, 378-394. 730
Thamban, M., Chaturvedi, A., Rajakumar, A., Naik, S.S., D´Souza, W., Sing, A., 731
Rajan, S., Ravindra, R., 2006. Aerosol perturbations related to volcanic eruptions 732
during the past few centuries as recorded in an ice core from the Central 733
Dronning Maud land, Antartica. Current Science 91, 1200-1207. 734
Wagnon, P., Delmas, R. J., Legrand, M., 1999. Loss of volatile acid species from 735
upper firn layers at Vostok, Antarctica. J. Geophys. Res. 104, 3423–3431. 736
Wallace, L., Livingston, W., 1992. The effect of the Pinatubo cloud on hydrogen-737
chloride and hydrogen-fluoride. Geophys. Res. Lett. 19, 1209-1209. 738
Williams, S.N., Stoiber, R.E., Garcia, N., Londono, A., Gemmel, B.C., Lowe, D. R., 739
Connor, C.B., 1986. Eruption of the Nevado des Ruiz volcano, Colombia on 13 740
November 1985: Gas flux and fluid geochemistry. Science 233, 964-967. 741
Woods, A.W., Bursik, M. I., 1991. Particle fallout, thermal disequilibrium and 742
volcanic plumes. Bull. Volcanol. 53, 559-570. 743
Woods, D.C., Chuan, R.L., Rose, W.I. , 1985. Halite particles injected into the 744
stratosphere by the 1982 El Chicón eruption. Science 230, 170-172. 745
Zdanowicz, C. M., Zielinski, G. A., Germani, M. S., 1999. Mount Mazama eruption: 746
Calendrical age verified and atmospheric impact assessed. Geology 27, 621– 624. 747
Table 1
749
Chemical composition (wt. %) and specific surface A (m2/g) of synthetic glass 750
samples and of a natural obsidian from Vulcano (Aeolian Islands, Italy) used for 751 adsorption experiments 752 Rhyolite Dacite Batch 1 Dacite Batch 2 Dacite Batch 3 Andesite Vulcano Obsidian SiO2 Al2O3 Fe2O3 (t) MgO CaO Na2O K2O Total A 76.45 (83) 12.37 (53) 3.14 (24) 0.80 (07) 2.77 (08) 3.33 (05) 98.86 3.82 67.08 (30) 16.49 (21) 4.96 (15) 2.80 (10) 4.31 (09) 3.15 (06) 98.79 4.90 67.02 (49) 16.81 (23) 4.97 (23) 2.93 (11) 4.20 (05) 3.00 (06) 98.93 1.50 66.68 (71) 16.96 (32) 5.14 (37) 2.86 (16) 4.46 (09) 2.92 (07) 99.02 2.74 56.77 (18) 21.63 (13) 7.31 (16) 7.46 (10) 3.88 (09) 1.77 (06) 98.82 3.01 73.47 (35) 13.49 (22) 1.86 (13) 0.11 (04) 0.83 (10) 4.42 (08) 5.10 (05) 99.28 2.97 Numbers in parentheses are one standard deviation in the last digits. Fe2O3 (t) is the
753
total iron content given as Fe2O3. For dacite, three batches of sample were prepared.
754
Batch 1 was used for experiments at room temperature, batch 2 at 150 ˚C, and batch 3 755
at -76 ˚C. Note that the synthetic compositions do not necessarily correspond to 756
global averages of the respective rock type. 757
Rate constants for the adsorption of HCl on glass surfaces 759
Andesite Dacite Rhyolite
T = 22 ˚C T = - 76 ˚C T = 22 ˚C T = 150 ˚C T = 22 ˚C
p (mbar) (10-6 s-1) p (mbar) (10-6 s-1) p (mbar) (10-6 s-1) p (mbar) (10-6 s-1) p (mbar) (10-6 s-1) 68 124 (48) 58 58.5 (3.6) 42 180 (24) 104 44.4 (1.3) 80 45.4 (5.5) 105 52.1 (11.2) 86 103 (9) 147 32.1 (1.4) 95 15.9 (0.5) 125 57.0 (9.7) 185 44.3 (9.3) 123 96.7 (6.4) 197 12.0 (0.3) 315 14.8 (1.1) 191 149 (3) 374 28.2 (8.1) 206 99.4 (6.3) 306 5.98 (1.41) 424 6.92 (0.28) 243 37.7 (13.7) 581 42.8 (11.4) 299 103 (7) 528 6.32 (0.27) 538 25.4 (0.3) 371 43.0 (17.0) 721 117 (23) 529 92.6 (10.7) 692 7.58 (0.72) 798 21.8 (25.8) 506 46.3 (14.1) 852 58.6 (10.2) 723 66.2 (30.0) 794 2.75 (7.06) 956 18.1 (19.0) 713 34.0 (12.6) 982 36.4 (15.7) 935 76.1 (23.3) 965 2.13 (0.43) 967 37.3 (14.5) p is the initial pressure of HCl vapor to which the sample was exposed in each step. The pressures are listed in the sequence of the steps of the 760
adsorption experiment. Numbers in brackets are estimated uncertainties. 761
Fig. 1. Kinetics of HCl adsorption on dacitic glass at room temperature and for an
764
initial pressure p0 = 179 mbar. Pressure in the system decreases exponentially, until
765
equilibrium is reached. 766
767 768
Fig. 2. HCl adsorption and desorption isotherms for (a) andesitic, (b) dacitic, and (c)
769
rhyolitic compositions at room temperature. Error bars are one standard deviation. 770
771
772
Fig. 3. Effect of temperature on the adsorption of HCl on dacite glass. Error bars are
773
one standard deviation. 774
775
776
Fig. 4. Multiple regression model for the adsorption of HCl on dacite glass. Surface
777
concentrations c are in mg/m2. 778
780
781
Fig. 5. HCl adsorption on a natural obsidian from the 1739 A.D. eruption of Vulcano
782
(Aeolian Islands, Italy). a) Kinetics of adsorption at room temperature for an initial 783
pressure of p0 = 138 mbar. The decrease in pressure can be described by a rate
784
constant of = 1.28 . 10-5 s-1; b) Adsorption and desorption isotherms at room 785
temperature. Error bars are one standard deviation. The point at the highest pressure 786
may have been affected by some unknown experimental problem. 787
789
Fig. 6. Concentrations of chlorine adsorbed on volcanic ashes from recent eruptions
790
(see supplementary Table S2 for data and sources). The data are compared with the 791
maximum surface concentrations according to the experimental data for HCl 792
adsorption on dacite glass (vertical lines), assuming two different specific surface 793
areas (1 m2/g for fine ash, 0.1 m2/g for coarser ash) and adsorption at three different 794
temperatures (150 ˚C, 21 ˚C, -76 ˚C). Note that some samples may contain a 795
contribution of Cl-bearing alteration products from other sources, e.g., evaporites, 796
marine aerosols or pre-eruptive interaction with saline groundwaters, altered dome 797
rocks or recycled volcanic ejecta. 798
799
Fig. 7. Calculated fractionation of SO2 and HCl between volcanic gas and the surface
800
of dacitic ash as a function of temperature. 801
802
803
Fig. 8. Fraction of HCl adsorbed on volcanic ash in the umbrella part of a
804
stratospheric plume as a function of initial HCl concentration in the volcanic gas. 805
Assumptions: Plume altitude 20 km, temperature 220 K, dilution factor 200. 806