HAL Id: hal-00295546
https://hal.archives-ouvertes.fr/hal-00295546
Submitted on 10 Nov 2004
HAL is a multi-disciplinary open access
archive for the deposit and dissemination of
sci-entific research documents, whether they are
pub-lished or not. The documents may come from
teaching and research institutions in France or
abroad, or from public or private research centers.
L’archive ouverte pluridisciplinaire HAL, est
destinée au dépôt et à la diffusion de documents
scientifiques de niveau recherche, publiés ou non,
émanant des établissements d’enseignement et de
recherche français ou étrangers, des laboratoires
publics ou privés.
Ground-based water vapour soundings by microwave
radiometry and Raman lidar on Jungfraujoch (Swiss
Alps)
D. Gerber, I. Balin, D. G. Feist, N. Kämpfer, V. Simeonov, B. Calpini, H. van
den Bergh
To cite this version:
D. Gerber, I. Balin, D. G. Feist, N. Kämpfer, V. Simeonov, et al.. Ground-based water vapour
soundings by microwave radiometry and Raman lidar on Jungfraujoch (Swiss Alps). Atmospheric
Chemistry and Physics, European Geosciences Union, 2004, 4 (8), pp.2171-2179. �hal-00295546�
www.atmos-chem-phys.org/acp/4/2171/
SRef-ID: 1680-7324/acp/2004-4-2171
Chemistry
and Physics
Ground-based water vapour soundings by microwave radiometry
and Raman lidar on Jungfraujoch (Swiss Alps)
D. Gerber1, I. Balin2, D. G. Feist1, N. K¨ampfer1, V. Simeonov2, B. Calpini2, *, and H. van den Bergh2
1Institute of Applied Physics, University of Bern, Switzerland
2Laboratory of Air Pollution, Swiss Federal Institute of Technology – Lausanne (EPFL), Lausanne, Switzerland *now at: M´et´eoSuisse, Payerne Station, Switzerland
Received: 23 June 2003 – Published in Atmos. Chem. Phys. Discuss.: 25 September 2003 Revised: 17 September 2004 – Accepted: 5 November 2004 – Published: 10 November 2004
Abstract. Water vapour has been measured from the
Inter-national Scientific Station Jungfraujoch (ISSJ, 47◦N, 7◦E,
3580 m above sea level) during the winters of 1999/2000 and 2000/2001 by microwave radiometry and Raman lidar. The abundance of atmospheric water vapour between the plane-tary boundary layer and the upper stratosphere varies over more than three orders of magnitude. The currently used measurement techniques are only suited to determine the abundance of water vapour in different atmospheric regimes. None can resolve the vertical distribution profile from ground level to the top of the stratosphere by itself. We present such a water vapour profile where simultaneous measurements from a Raman lidar and a microwave radiometer were combined to cover both the troposphere and the stratosphere, respectively. We also present a study of the stratospheric and tropospheric water vapour variability for the two consecutive winters.
1 Introduction
The distribution of water vapour in the Earth’s atmosphere has regained the interest of the scientific community in the re-cent past (Kley et al., 2000; Starr and Melfie, 1991). With the arising of new questions about the trend in stratospheric wa-ter vapour (Nedoluha et al., 1998), exchange processes across the tropopause, and the direct as well as the indirect effects of water vapour on radiative forcing, the need for water vapour measurements has increased. Water vapour plays many roles in different altitude ranges and it would be useful to know its distribution from the ground to the top of the atmosphere to see the whole picture.
However, the large gradient of more than three orders of magnitude in abundance between the planetary bound-ary layer and the stratosphere is a serious challenge for
ev-Correspondence to: D. Gerber
(daniel.gerber@mw.iap.unibe.ch)
ery measuring technique. Each technique, be it ground-or satellite-based remote sensing ground-or in situ sampling of air parcels, is generally limited to a certain altitude range where it produces its best results (Starr and Melfie, 1991; England et al., 1992). Therefore, several measurement techniques have to be combined to produce water vapour profiles that cover an extended altitude range. The challenge is to apply the strengths of each technique and avoid their weaknesses as much as possible. Our goal was to provide water vapour pro-files that reach from the Earth’s surface to the upper strato-sphere at around 60 km. To achieve that, we combined simul-taneous measurements of tropospheric water vapour by a Ra-man lidar and of stratospheric water vapour by a microwave radiometer on the International Scientific Station Jungfrau-joch (ISSJ).
2 Measurement techniques
2.1 Microwave radiometry
In passive microwave radiometry of molecules, the electro-magnetic emission from transitions between different states of rotational energy are measured by a receiver. The linewidth of the observed spectral emission line is affected by different broadening processes. In the altitude range up to the stratopause and the lower mesosphere, the dominating process is pressure broadening, which is a result of collisions between the target molecules and other air molecules. The rate of these collisions depends on the number of molecules per volume unit and is therefore dependent on pressure. Be-cause of the known relation between pressure and altitude, pressure broadening introduces altitude dependent informa-tion to the total spectral emission observed at ground level. From the spectrum observed at ground level, the contribu-tions from each altitude layer can afterwards be retrieved through inversion methods. We used an optimal estimation
2172 D. Gerber et al.: H2O soundings on Jungfraujoch
approach with an a priori profile as described by Rodgers (2000) to derive vertical abundance profiles of water vapour between 20 km and 60 km from our observed spectral line. 2.2 The microwave radiometer AMSOS at the ISSJ The Airborne Millimetre and Submillimetre Wave Observ-ing System (AMSOS) was designed to observe stratospheric water vapour from an aircraft. However, between flight cam-paigns it was also operated on the ISSJ during the winter months of 1999 to 2001 (Siegenthaler et al., 2001). The in-strument measures the 31,3 → 22,0 rotational transition of
the water molecule H216O at 183.31009 GHz. A
hetero-dyne receiver with an uncooled, sub-harmonically pumped Schottky diode mixer converts the atmospheric signal to an intermediate frequency (IF) of 3.7 GHz. The IF signal is amplified by a low noise amplifier and a power amplifier and spectrally analysed with an acousto-optical spectrome-ter (AOS) with 1725 equally spaced channels over a band-width of 1 GHz. Each channel has a frequency resolution of 1 MHz. A Martin-Puplett interferometer suppresses the image sideband by more than 25 dB. The single sideband re-ceiver noise is below 4100 K over the whole bandwidth. The atmospheric signal enters the instrument from a zenith angle of 50◦through a Styrofoam window. The construction of the observation building does not allow observation at smaller zenith angles. The instrument is calibrated in a total power mode with two blackbodies at ambient and at liquid nitrogen temperature.
2.3 Raman lidar spectroscopy
The Raman lidar measurement of water vapour takes advan-tage of the spontaneous vibrational Raman scattering of an incident laser beam by atmospheric N2and H2O molecules.
The third harmonic of a Nd:YAG laser at 355 nm is used as excitation beam in zenith direction. The Raman shifted wavelengths are 387 nm from N2and 408 nm from H2O,
re-spectively. The water-vapour mixing ratio is calculated from these backscattered signals assuming a constant mixing ratio for N2.
A correction term takes into account the differential ex-tinction of the atmosphere at the water vapour (408 nm) and nitrogen (387 nm) Raman shifted wavelengths on the return path due to the total extinction coefficient. The total extinc-tion term is the sum of the molecular extincextinc-tion, the aerosol extinction and the molecular absorption and it is wavelength dependent. This optical extinction corresponds to an integra-tive effect over the entire range from the lidar site to the al-titude of interest. An instrument-dependant calibration con-stant takes into account the transmitter and receiver optical efficiency and the quantum efficiency of the detectors for the two channels, the Raman backscatter cross section and the molecular mass and number density of the water vapour and nitrogen, respectively.
Because of this free calibration term in the forward model the number retrieved for the water vapour mixing ratio is a relative value and an external calibration point must be added for an absolute calibration of the lidar measurements. In our case this fixpoint for the absolute value of the water vapour mixing ratio was given by humidity, pressure and tempera-ture measurements performed routinely on Jungfraujoch by the Swiss Meteorological Institute (M´et´eoSuisse). This is ex-plained in more detail in Balin et al. (2001). Other applica-tions of Raman lidar to measure tropospheric water vapour are described in Whiteman (2003), Sherlock et al. (1999) and De Tomasi and Perrone (2003). Ferrare et al. (1995) show a comparison of a Raman lidar with radiosondes and Wessel et al. (2000) the calibration of a microwave sensor with a Ra-man lidar.
2.4 The Raman lidar setup at the ISSJ
The Raman lidar installed in the astronomical dome of the ISSJ is a multi-wavelength system built to probe the atmo-sphere above the Swiss Alps (Larchevˆeque et al., 2002). The transmitter of the system is based on a Nd:YAG laser (Spec-tra Physics, Infinity) with a maximum energy of 400 mJ at 1064 nm equipped with two non-linear crystals for sec-ond (532 nm) and third (355 nm) harmonic generation. The laser can be operated with repetition rates ranging from 20 to 100 Hz. Dichro¨ıc mirrors at the laser output separate the three laser wavelengths and each beam is expanded 5 times in order to reduce the laser divergence from 0.7 to 0.14 mrad. These expanded beams are emitted to the atmosphere us-ing 45◦ dielectric mirrors mounted on piezoelectric-driven
stages. The typical output energy emitted into the atmo-sphere is 70 mJ at 355 nm, 60 mJ at 532 nm, and 45 mJ at 1064 nm. The lidar system is working on the vertical axis. The lidar emitter for the data analysed in this work was in off-axis configuration and thus the first data analysis can only be performed at an altitude higher than 250 m above the ground, an altitude where a full overlap of the laser beam into the tele-scope field of view is achieved. The receiver of this system is built around a Newtonian telescope with a primary mirror measuring 20 cm in diameter and a focal length of 80 cm. The elastic backscatter signals at 355 nm, 532 nm with par-allel and perpendicular polarisation and 1064 nm as well as the Raman shifted signals from N2 at 387 nm and H2O at
408 nm (pumped at 355 nm) and N2at 607 nm (pumped at
532 nm) are simultaneously recorded. They are used to esti-mate the aerosol backscatter- and extinction-coefficients and the water vapour content. The backscattered light is collected by the telescope and spectrally separated by a set of dichro¨ıc mirrors and filters. Two sets of interference filters at each of the signal output are used to reduce the sky background light and suppress the residual elastically backscattered light in the Raman channels. This combination of filters acts as an equiv-alent narrow band filter with 0.5 nm FWHM at 408 nm and 387 nm, respectively and a rejection ratio of better than 10−7
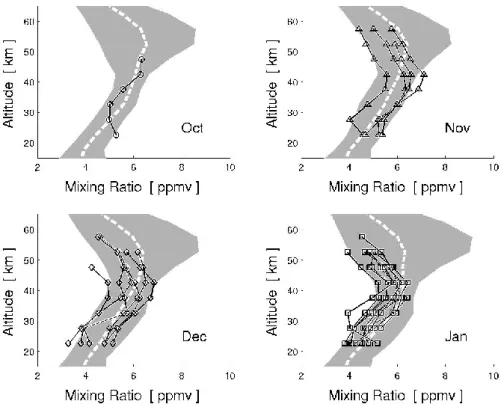
Fig. 1. Stratospheric water vapour distribution over the Jungfraujoch measured by microwave radiometry for the winters 1999/2000 and 2000/2001. Individual profiles are given for the months of October (circles), November (triangles), December (diamonds) and January (squares). The shaded areas in the background are the minimum and maximum profiles of the 1999 HALOE samplings for the corresponding month. The dashed white lines are the respective HALOE monthly mean profiles.
between 200 nm and 1200 nm. Two head-on photomulti-plier tubes (type EMI 9829 QA) are used in photon-counting mode. The acquisition unit has a maximum counting rate of 250 MHz and a sampling rate of 20 MHz was used. The li-dar at the ISSJ is able to measure water vapour profiles up to about 10 km of altitude under ideal atmospheric conditions. Browell et al. (1998) were able to measure water vapour pro-files from 0 km–14 km with a differential absorption lidar, which is a different setup than the one available to us.
3 Stratospheric variability
The 31,3 → 22,0 microwave transmission line at 183 GHz
is approximately 180 times stronger than the one often used for ground-based observations at 22 GHz. On the other hand the attenuation of the stratospheric signal (mostly by tropo-spheric water vapour) is very strong at this frequency. This is not restricting during aircraft measurements for which AM-SOS was originally designed. On Jungfraujoch, however, the remaining part of the troposphere above the observation site is most often opaque at 183 GHz, except for some ded-icated days of extreme dryness as set forth in Siegenthaler et al. (2001). The atmospheric conditions allowed us to re-trieve mixing ratio profiles for 22 days during the winters 1999/2000 and 2000/2001.
Table 1. Distribution of AMSOS samplings for which mixing
ra-tio profiles could be retrieved during the winters 1999/2000 and 2000/2001.
Number of samplings 1999/2000 2000/2001 Overall
Oct – 1 1
Nov 4 – 4
Dec 4 2 6
Jan 7 4 11
Overall 17 7 22
The retrieved volume mixing ratio profiles measured by AMSOS during the winters 1999/2000 and 2000/2001 are plotted in Fig. 1. Measurements span the months of October (circles), November (triangles), December (diamonds) and January (squares). An overview of the distribution of mea-surements over the two years of our sampling is given in Ta-ble 1.
We compared our measurements with a HALOE climatol-ogy taken from the database of N. Lauti´e (Lauti´e et al., 1999). This climatology consists of monthly mean profiles, calcu-lated for latitude intervals of 10◦each. The shaded areas in
2174 D. Gerber et al.: H2O soundings on Jungfraujoch
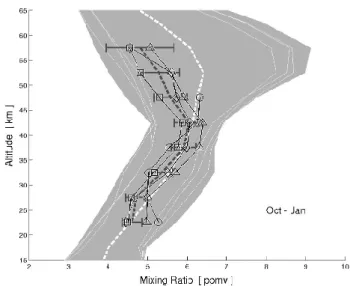
Fig. 2. Stratospheric water vapour distribution over the
Jungfrau-joch measured by microwave radiometry for the winters 1999 to 2001. The profiles are monthly means from October (circles), November (triangles), December (diamonds) and January (squares), respectively. The shaded areas in the background (distinguished by their white borders) are given by the minimal and maximal profiles of the HALOE monthly and zonal mean for the months October to January 1999 as seen in Fig. 1. The dashed white line is the HALOE monthly mean profile for these four months. The dashed gray line with error-bars is the AMSOS mean profile for all four months Oc-tober to January 1999 to 2001.
the background denote the minimum and maximum values measured by HALOE during the respective month in 1999 over the latitude circle from 40◦N to 50◦N. The respec-tive mean value for the corresponding month is given by the dashed white line. To compare the HALOE profiles with our measurements we have convolved them with the aver-aging kernel function and the a priori profile of our retrieval algorithm. This method adapts the HALOE profiles to the lower resolution of our instrument which characterises our retrieved profiles (Rodgers, 2000).
We observed a general agreement between our measure-ments and the HALOE climatology within its variability for each month. At altitudes exceeding 45 km, we typically mea-sured lower values than HALOE. This was especially true for the late winter month of January. For October, the single re-trieved profile for this month did not reach above 45 km of al-titude due to a low signal to noise ratio in the measured spec-trum corresponding to this profile. As a result of this we get a somewhat lower peak value for water vapour of 45 km to 40 km than HALOE, whose profiles normally peak at 50 km. We explain this by the fact that in contrast to our soundings at 47◦N/7◦E, the HALOE climatology of latitudes between 40◦N and 50◦N and all longitudes includes a overly propor-tional contribution of measurements from the south of our observation site where water vapour is supposed to peak at
higher altitude. This is because the altitude distribution of stratospheric water vapour is influenced by a down-welling over the winter pole due to the cold temperatures in the polar vortex. As a consequence, this leads to a downward move-ment of the water vapour peak over the polar region in north-ern hemisphere winter, the period of our observations.
This behaviour has been shown e.g. by Feist et al. (2003) during aircraft campaigns with the AMSOS radiometer. They have observed a transition of the peak altitude of water vapour at 47◦N from about 50 km in August to about 40 km in February on two campaigns in 1998 and 1999. Our own values for the peak altitude of water vapour at this latitude, situated at 45 km to 40 km in the timespan from November to January, fit well into this evolution pattern.
Another feature we observed was that the AMSOS monthly mean mixing ratio profiles gradually decrease as winter advances. The mean AMSOS profile for Novem-ber is higher than the climatological HALOE mean profile for November, with exception of altitudes above 45 km (see Fig. 1). The latter is due to the downward propagation of the peak altitude as explained above. For December the mean AMSOS profile and the climatological HALOE mean show the same values, whereas for January the mean AMSOS pro-file lies below the climatological HALOE mean propro-file. An overview on this development is shown in detail in Fig. 2. The mean AMSOS October profile is given in this figure, too, but it has to be noted that as opposed to the other months this consists of a single measurement only. Nevertheless we seem to have observed the downward propagation of the wa-ter vapour peak altitude in the evolution from the October profile to the November profile. In the following months of December and January the peak altitude was at a constant 42.5 km.
4 Tropospheric variability
In contrast to the stratified stratosphere the troposphere is governed by convection and turbulence. As a result of this water vapour, like other species in the troposphere, is more variable both in time as well as in space in this altitude layer. In addition to this variability, there are seasonal character-istics, too. For example, we expect an overall higher water vapour column in summertime, where the tropopause is gen-erally located at higher altitudes than in winter. The tropo-sphere is also warmer in summertime due to the increased so-lar irradiation, which subsequentially strengthens convective forcing, leading to more thorough mixing of the troposphere. Therefore the natural variability of water vapour should be stronger in summertime.
All these features can be observed in the measurements of the hygristor radiosonde and also in the lidar measurements (Fig. 3). The radiosonde, being an operational experiment, has a full coverage over the year, whereas the lidar or the microwave radiometer only perform occasional soundings.
Fig. 3. Integrated precipitable water vapour in [mm] measured by radiosonde from Payerne (light gray) and by Raman lidar (black squares)
and microwave radiometer (gray diamonds) from Jungfraujoch. The radiosonde measurements span the free troposphere from 3600 m altitude up to the sounding limit of the balloon. Lidar measurements are from 3750 m altitude up to the detection limit. The microwave measurements represent the stratosphere from 20 km to 60 km.
The lidar total integrated water vapour column above the site (for example at 4000 m altitude) and the integrated radiosonde column for the same altitude range are in good correlation. The remaining differences can be explained by: a) The natural influence of the alpine environment (mountain proximity, north-south air mass transfer above the lidar station, convective air masses guided by a rapid uplift rising from the valleys along the mountain flanks, etc.) while the radiosonde was launched from a free topography site (Payerne in the Swiss plateau).
b) The lidar profiles were generally integrated over 1–2 h, while the radiosonde was sampling the whole free tropo-sphere in about 15–30 min.
c) The calibration value was chosen as the value measured by M´et´eoSuisse at the Scientific Station Jungfraujoch (e.g. 100–300 m below the first lidar point), and can make a difference in cases of high vertical variability of water vapour, which is not the case for homogeneous layers. d) The lowest observation altitude of the lidar at 3750 m altitude was slightly higher than the bottom altitude of the radiosonde water vapour column which corresponded to
∼3600 m altitude. This contribution had to be added to the lidar profile and can vary from some percents in a dry winter situation up to 20% for a high humidity summer situation. e) Due to the high variability of the water distribution the standard deviation can reach up to 30% of the total column.
It is interesting to note that for a few days in winter the wa-ter vapour column measured by lidar yielded very low values, comparable in order of magnitude to the microwave measure-ments for 20 km–60 km. One such occasion was 15 Jan-uary 2001, the day for which we derived a combined profile from simultaneous microwave and lidar measurements. On
this day the integrated precipitable water vapour from lidar measurements was as low as 0.24 mm (3750 m–5500 m alti-tude), whereas the microwave radiometer measured 0.39 mm (20 km–60 km). For days with a low tropospheric water col-umn the penetration depth of the lidar was reduced due to the lack of backscattering molecules. So while the water vapour column calculated from the microwave measurement always includes altitudes of 20 km–60 km, the lidar column height is shorter on dry days, a fact that would further accentuate low measurement values.
There were are a handful of days during the winter months where the atmosphere over the Jungfraujoch was exception-ally dry. While this fact allows the microwave retrieval of water vapour at 183 GHz in the first place, it is also a limiting factor when attempting to combine microwave and lidar mea-surements to a combined profile over the whole troposphere-stratosphere as described in Sect. 5.
5 A combined profile
Of the 22 days where the microwave radiometer could re-trieve mixing ratio profiles there was one night where the lidar had been measuring simultaneously, namely the night of 15 January 2001, from 23:30 to 00:30 UT. The microwave radiometer can only retrieve vertical distribution profiles at 183 GHz when the troposphere is extremely dry. The tro-posphere over the Jungfraujoch was indeed particularly dry on January 15, 2001, as can be seen in the lidar profile in Fig. 4. The Raman lidar on the other hand is dependant on a high density of molecules to provide a Raman-backscatter signal of sufficient intensity. The demands of both measur-ing techniques on the atmospheric condition are therefore of
2176 D. Gerber et al.: H2O soundings on Jungfraujoch
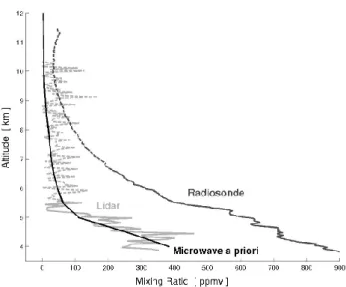
Fig. 4. Tropospheric profiles of the Raman lidar (light gray) and the Payerne radiosonde (dark gray). The dashed part of the lidar profile is where the signal to noise ratio falls beyond the detection threshold. The dashed part of the radiosonde profile denotes temper-atures below −37◦C, at which the response of the carbon hygristor degrades. The black line is the microwave a priori profile tied to the lidar measurements at altitudes where the latter is valid. This is identical to the combined microwave-lidar profile at the altitudes shown here.
opposing nature. Because of the unusually dry atmospheric condition of 15 January 2001, the Raman lidar had no signal above the noise-level for altitudes above 5.5 km as shown in Fig. 4.
The microwave radiometer derives altitude information about a species’s abundance from the pressure broadening of the emission line. The upper limit to where altitude in-formation can still be gained is given by the decreasing ratio of pressure broadening over thermal broadening at high al-titudes. The lower limit is given by the bandwidth of the spectrometer, which cannot resolve the broad tropospheric contributions to the spectral line anymore. AMSOS can re-trieve a vertical distribution of the water vapour mixing ratio with less than 20% a priori contribution between 20 km and 60 km altitude.
The upper limit of the lidar profile is given by the intensity of the received Raman backscatter signal. This is basically a function of the number of scattering particles but also the dimensions of the detecting optical telescope. On the excep-tionally dry day considered in this study the Raman lidar on Jungfraujoch could retrieve a water vapour mixing ratio pro-file up to 5.5 km altitude. When trying to combine the two datasets we therefore faced a gap in altitude from 5.5 km to 20 km where we had no measurements from either the mi-crowave radiometer nor the lidar.
Potential alternative measurement techniques to be consid-ered for closing the altitude gap between the lidar
measure-ments and the microwave measuremeasure-ments were the radioson-des of M´et´eoSuisse or satellites. One operational radiosonde was launched at Payerne (85 km to the west-northwest of Jungfraujoch) at the same time as the lidar sampling. Fig-ure 4 shows that there is a big discrepancy between the ra-diosonde at Payerne and the lidar on the Jungfraujoch which was probably due to the high variability of tropospheric water vapour both in space and time. Also the radiosonde profile can only be trusted up to ∼6.5 km, where the temperature on this day fell below −37◦C. The reason for this is that car-bon hygristors are known to loose their responsiveness below temperatures of −35◦C to −40◦C, depending on their man-ufacturing (Jeannet et al., 2001). A new experimental sensor by the name of SnowWhite, featuring a chilled mirror dew-point hygrometer, is occasionally launched by M´et´eoSuisse. The SnowWhite sounding closest to our observation in time was performed on 17 January 2003. This sounding delivered a reliable water vapour profile up to an altitude of ∼10.5 km (Jeannet and Levrat, 20031). Unfortunately, given the large variability of water vapour in the troposphere, the results of this SnowWhite sounding did not capture the conditions we had during our combined measurement on 15 January 2001. Therefore it was even less suitable than the simultaneously launched operational sonde to fill the gap between our mea-surements. Satellite measurements are not suitable either be-cause mostly they do not reach down to the tropopause and never have enough spatial resolution that a comparison with our profile above a strictly confined location would make sense.
Instead, we suggested an alternative approach to use the microwave a priori profile to bridge the altitude gap down to the lidar measurements. The retrieval algorithm of the microwave radiometer generally produces a compromise so-lution between an a priori profile and a measurement. On altitude levels where the information content of the measure-ment is high the retrieved profile resembles the true atmo-spheric distribution. However on altitude levels too high or low for the radiometer to resolve the retrieved profile basi-cally reverts to the a priori profile. This process is a gradual one. For AMSOS, the a priori contribution to the retrieved profile grows above 20% at altitudes below 20 km and above 60 km. There we would normally cut off our retrieved pro-file because the values we get are a priori values and do not reflect the state of the atmosphere during the measurement.
Usually, the a priori profiles are climatological profiles that are not necessarily related to the true state of the atmosphere at the time of the measurement. However, with the lidar mea-surement in the troposphere we had a clear knowledge about the water vapour distribution from our observation site up to 5.5 km. When we scaled the tropospheric part of our a pri-ori profile to match the lidar data we had an a pripri-ori profile
1Jeannet, P. and Levrat, G.: Mesures des profiles d’humidit´e du 17.01.2001 avec hygrom`etre `a miroir SnowWhite et hygristor VIZ: Note `a l’attention de M. D. Gerber, personal communication, 2003.
Table 2. Numeric values of the combined microwave-lidar profile
of 15 January 2001 (Fig. 5). Error values denote retrieval errors of the lidar (troposphere) and the microwave radiometer (strato-sphere), respectively. Error values in between (denoted by a ?) which are not linked to a direct measurement are given as inter-polated relative errors.
Alt. Mix. Ratio Error Alt. Mix. Ratio Error (km) (ppmv) (ppmv) (km) (ppmv) (ppmv) 4.0 385.12 53.17 12.5 3.44 ?1.07 4.5 254.00 67.67 17.5 4.06 0.72 5.0 110.38 45.11 22.5 4.47 0.40 5.5 62.88 45.11 27.5 4.91 0.48 6.0 47.29 33.83 32.5 5.31 0.52 6.5 35.21 ?24.09 37.5 5.81 0.61 7.0 28.82 ?18.83 42.5 6.20 0.70 7.5 23.62 ?14.70 47.5 5.62 0.80 8.0 18.89 ?11.17 52.5 4.65 0.78 8.5 13.42 ?7.52 57.5 3.75 0.90 9.0 10.58 ?5.60 62.5 3.29 1.01 9.5 7.29 ?3.63 67.5 3.04 0.78 10.0 5.48 ?2.56 72.5 2.42 0.38 10.5 5.15 ?2.24 77.5 1.92 0.15 11.0 4.78 ?1.94 82.5 1.96 0.07 11.5 4.38 ?1.64 87.5 2.50 0.04 12.0 3.93 ?1.35
which reflected the true state of the troposphere at the mo-ment of the microwave sounding, at least up to 5.5 km. The tropopause was chosen as the upper limit to where the ini-tial a priori profile was scaled to overlap the lidar measure-ments. This validated a priori profile was subsequently used to retrieve stratospheric water vapour. The benefits from this method were twofold:
First off all we increased the accuracy of our retrieval be-cause we had a much more accurate estimation of the tropo-spheric attenuation that had to be considered in the radiative transfer calculations.
Secondly, we did not have to cut off the parts below 20 km of our retrieved profile because of the substantial a priori con-tribution anymore. While the a priori concon-tribution was of course still significant at these altitudes, we knew from the initial a priori generation that the tropospheric part of the a priori reflected the true state of the atmosphere according to the lidar measurement.
The profile we gained this way is shown in Fig. 5. In this figure the solid black line depicts the combined microwave-lidar profile and the dotted black line the microwave a priori profile. Numeric values for the combined microwave-lidar profile and errors are given in Table 2.
The microwave part merges smoothly into the lidar part in the region of the tropopause, where the microwave profile changes from information on the state of the atmosphere to
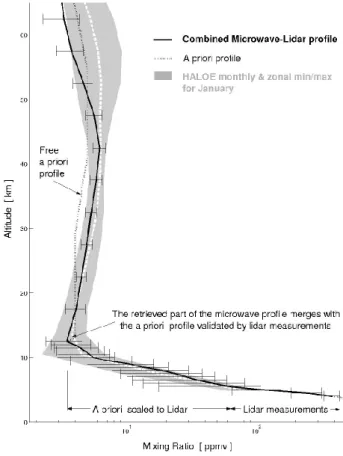
Fig. 5. Combined microwave-lidar profile (black line) of January
15, 2001, for both the troposphere and stratosphere. The dotted black line is the initial a priori profile of the microwave retrieval. This a priori is identical to the lidar measurement up to 6 km of altitude. The retrieved microwave profile converges to its a priori profile below 20 km. Below the tropopause at 12.5 km the initial a priori is given for the combined profile since the retrieved profile at these altitudes contains absolutely the same information but with a much lower resolution. The shaded area in the background is the minimal and maximal value of the HALOE monthly and zonal mean for the month of January. The dashed white line is the HALOE monthly mean profile for this month. The abscissa is in logarith-mic scale to account for the large difference in abundance over the altitudes considered.
a priori information. At these altitudes a priori information becomes equal per definition to lidar measurement since the apriroi profile has been scaled to overlap with the lidar mea-surements in the altitude rage where the latter are available.
It has to be noted that the profile in Fig. 5 is of higher resolution in the troposphere than in the stratosphere. The microwave retrieval per se will of course conserve its lower resolution also in the troposphere. Basically one can say that the retrieved microwave profile converges towards its apriroi profile as it closes in on the tropopause but it does so with low vertical resolution. But we already know that same apriroi profile (which follows the lidar measurements in the tropo-sphere) with a much higher resolution. The low resolution of
2178 D. Gerber et al.: H2O soundings on Jungfraujoch
the microwave retrieval does not give credit to the high res-olution lidar measurements. In a truly combined profile one would want to switch from the retrieved microwave profile to the high resolution lidar/apriroi profile sooner or later in the troposphere. We found the tropopause to be a suitable joint for this purpose.
Therefore the profile in Fig. 5 is a combination of the mi-crowave data above the tropopause and the lidar-validated apriroi data below the tropopause. The joint of the two pro-files at the tropopause is smooth because the retrieved mi-crowave profile converges to its apriroi value at these alti-tudes.
The error-bars denote the retrieval errors of the microwave and lidar retrieval, the former for the stratosphere and the lat-ter for the troposphere. In the inlat-termediate section, where the combined profile follows the lidar-bound a priori profile, the mixing ratio values can not directly be attributed to an instrument measurement. For this region we used the inter-polated relative error between the topmost lidar measurement and the bottommost microwave measurement as the overall error estimate. Error-bars derived this way are denoted by a
?in Table 2. We hereby achieved a smooth evolution of the errors over the tropopause region while respecting the magni-tude of errors at altimagni-tudes where error calculations from data retrieval exist.
In the background we plotted the climatological mean HALOE profile of January together with its minimum and maximum values.
6 Conclusions
The atmospheric water vapour distribution has been mea-sured from the International Scientific Station Jungfraujoch in the Swiss Alps in the winters 1999/2000 and 2000/2001. A microwave radiometer measuring at 183 GHz retrieved stratospheric profiles from 20 km up to 60 km of altitude, while a Raman lidar retrieved profiles for the free tropo-sphere from the observation altitude of 3500 m altitude up to about 10 km. The microwave emission line is only visi-ble under very dry tropospheric conditions with tropospheric transmittances of 0.3 or higher at our observation angle of 50◦(Siegenthaler et al., 2001). For the period observed the microwave radiometer was able to retrieve 22 volume mix-ing ratio profiles spread over the months of October to Jan-uary. These profiles were compared to a HALOE monthly climatology for the zonal girdle between 40◦N and 50◦N.
Our measurements were in good agreement with the HALOE climatology within its monthly variability. We observed a lower water vapour peak altitude than HALOE, a fact that we related to the more numerous presence of HALOE mea-surements to the south of our observation latitude than of those to the north. In the winter months the water vapour peak showed a downward gradient that we attributed to the downwelling of air in the polar regions during this time
and which seems to start already at mid-latitudes. Judging from our monthly mean profiles this downward propagation of the peak altitude seems to happen between October and November. We further observe a continuous decrease in wa-ter vapour mixing ratios throughout the months of November to January in our monthly mean profiles.
The variability of the integrated precipitable water vapour column above Jungfraujoch was determined from Raman li-dar measurements. The data showed increased humidity and larger variations in summer, which was in accordance with data from a hygristor radiosonde by M´et´eoSuisse. On some days in the winter the water vapour column measured by li-dar for the few kilometres above Jungfraujoch could reach values down to the order of what the microwave radiome-ter/measured for the whole stratosphere. One such day was 15 January 2001, on which the simultaneous microwave-lidar observation took place.
In spite of the opposing requirements on atmospheric con-ditions of the two instruments and the non-continuous sam-pling rate we had one hour of simultaneous observation by the microwave radiometer and the lidar on 15 January 2001, from 23:30 to 00:30 UT. Lidar measurements only reached up to 6 km on this day because of the extremely dry tropo-sphere. The dryness of the troposphere above Jungfraujoch showed up in comparison with a radiosonde profile launched at the same time in Payerne, 85 km to the west-norhtwest of the Jungfraujoch. The radiosonde did not reach above the observation altitude of the lidar because the carbon hygris-tor becomes inaccurate at temperatures close to and below
∼−40◦C which were measured at this altitude. A frost point hygrometer launched about two days later also at Payerne de-livered a water vapour profile up to an altitude of ∼10.5 km, but because of the difference in time and place it did not rep-resent the dry air we measured the night of our simultaneous observations.
We also suggested a method for combining the two mea-surements and to bridge the altitude gap where no direct measurements existed. We adapted the a priori profile used in the microwave retrieval to match the tropospheric water vapour distribution measured by the lidar and then subse-quently used this validated a priori information to retrieve the microwave profile. This extended the validity range our microwave profile, which consisted mainly of a priori infor-mation below about 20 km and the top of the troposphere. The retrieved water vapour abundances below 20 km have a very high a priori contribution. However, this did not corrupt the accuracy of our retrieved profile since this a priori profile reflected the true state of the atmosphere as we knew it from the lidar sounding.
Through this approach, we were able to retrieve an exem-plary water vapour profile for a dry winter atmosphere from 3500 m altitude up to 60 km. By introducing information from the lidar measurements into the microwave retrieval process as a priori information, we were even able to fill the gap between the altitude ranges of the two techniques with
reasonable data. To the knowledge of the authors this was the first time that two measurement techniques were combined to retrieve a vertical water vapour distribution profile that cov-ers the troposphere, stratosphere and lower mesosphere.
Acknowledgements. We thank P. Jeannet from M´et´eoSuisse for
providing us with profiles of the SnowWhite sonde. We thank M´et´eoSuisse for providing us with the hygristor data from their regular radiosondes from Payerne. Special thanks go to the International Scientific Station Jungfraujoch, which allows us to use their facility for our research.
Edited by: A. Hofzumahaus
References
Balin, I., Larchevˆeque, G., Quaglia, P., Simeonov, V., van den Bergh, H., and Calpini, B.,: Water vapor vertical profile by ra-man lidar in the free troposphere from the jungfraujoch alpine station, Adv. Global Change Res., 10, 123–138, 2002.
Browell, E. V., Ismail, S., and Grant, W. B.: Differential absorbtion lidar (DIAL) measurements from air and space, Appl. Phys. B-Lasers and Optics, 67, 4, 399–410, 1998.
De Tomasi, F. and Perrone, M. R.: Lidar measurements of tropo-spheric water vapor and aerosol profiles over southeastern Italy, J. Geophys. Res., 108, D9, Art. No. 4286, 2003.
England, M. N., Ferrare, R. A., Melfi, S. H., Whiteman, D. N., and Clark, T. A.: Atmospheric water vapour measurements: Com-parison of microwave radiometry and lidar, J. Geophys. Res., 97, 899–916, 1992.
Feist, D., Vasic, V., and K¨ampfer, N.: Aircraft measurements of the variability of stratospheric water vapor over the norhtern hemi-sphere, Poster at the 83rd annual Metting of the American Mete-orological Society, Long Beach CA, 2003.
Ferrare, R. A., Melfi, S. H., Whitman, D. N., et al.: A comparison of water–vapor measurements made by raman lidar and radioson-des, J. Atmos. Ocean Tech., 12, 6, 1177–1195, 1995.
Jeannet, P., Ruppert, P., Hoegger, B., and Levrat, G.: At-mosph¨arische Wasserdampfprofile mittels Taupunktspiegel-Hygrometer, DACH–MT 2001, Wien, 18–21 Sept., 2001.
Kley, D., Russell III, J. M., and Phillips, C. (Eds): SPARC as-sessment of upper tropospheric and stratospheric water vapour, no. WCRP-113 in World Climate Research Programme Reports, SPARC Office, BP 3, 91371 Verri`eres le Buisson Cedex, France, 2000.
Larchevˆeque, G., Balin, I., Nessler, R., Quaglia, P., Simeonov, V., van den Bergh, H., and Calpini, B.: Development of a multiwave-length aerosol and water–vapour lidar at the jungfraujoch alpine station (3580 m above sea level) in switzerland, Appl. Opt., 41, 2781–2790, 2002.
Lauti´e, N., de la N¨oe, J., and Ricaud, P.: A water vapour profiles database, in: Fith European Workshop on Stratospheric Ozone, edited by: Harris, N. R. P., Guirlet, M., Amanatidis, G. T., 526– 529, 1999.
Nedoluha, G. E., Bevilacqua, R. M., Gomez, R. M., Siskind, D. E., Hicks, B. C., Russell III, J. M., and Connor, B. J.: Increases in middle atmospheric water vapor as observed by the Halo-gen Occultation Experiment and the ground-based Water Vapor Millimeter-wave Spectrometer from 1991 to 1997, J. Geophys. Res., 103, 3531–3543, 1998.
Rodgers, C. D.: Inverse Methods for Atmospheric Sounding: The-ory and Practise, vol. 2 of Series on atmospheric, oceanic and planetary physics, World Scientific Publishing Co.Pte.Ltd., P O Box 128, Farrer Road, Singapore 912805, ISBN 981-02-2740-X, 2000.
Sherlock, V., Garnier, A., Hauchecorne, A., et al.: Implementation and validation of a Raman measurement of middle and upper tro-pospheric water vapor, Appl. Optics, 38, 27, 5838–5850, 1999. Siegenthaler, A., Lezeaux, O., Feist, D. G., and K¨ampfer, N.: First
water vapor measurements at 183 GHz from the high alpine sta-tion Jungfraujoch, IEEE Transacsta-tions on Geoscience and Re-mote Sensing, 39, 2084–2086, 2001.
Starr, D. O. and Melfie, S. H. (Eds): The Role of Water-vapor in Cli-mate: A Strategic Research Plan for the Proposed GEWEX, Wa-ter Vapor Project (GVaP), vol. CP–3120 of NASA Conf. Proc., 1991.
Wessel, J., Beck, S. M., Chan, Y. C., et al.: Raman lidar calibration for the DMSP SSM/T-2 microwave water vapor sensor, IEEE Transactions on Geoscience and Remote Sensing, 38, 1, 141– 154, 2000.
Whiteman, D. N.: Examination of the traditional Raman lidat tech-nique, II. Evaluating the ratios for water vapor and aerosols, Appl. Optics, 42, 15, 2593–2608, 2003.
![Fig. 3. Integrated precipitable water vapour in [mm] measured by radiosonde from Payerne (light gray) and by Raman lidar (black squares) and microwave radiometer (gray diamonds) from Jungfraujoch](https://thumb-eu.123doks.com/thumbv2/123doknet/14543902.535881/6.892.154.745.111.365/integrated-precipitable-measured-radiosonde-payerne-microwave-radiometer-jungfraujoch.webp)